In short
This calculator compares two fictional education options one year at a time. Each row keeps direct costs, indirect costs, grants, and savings in separate fields.
The yearly remaining amount is direct cost plus indirect cost, minus the grant and savings used. The multi-year total adds those yearly results.
Download the complete HTML file, replace the sample names and amounts, choose the number of years, and recalculate. The result is arithmetic, not a school or financial recommendation.
We built the example for a student or family who has two sets of figures but does not want one headline total to hide the assumptions. The fictional Ridge Program and Harbor Program each have three rows, so a changing grant or indirect cost stays attached to the year when it applies.
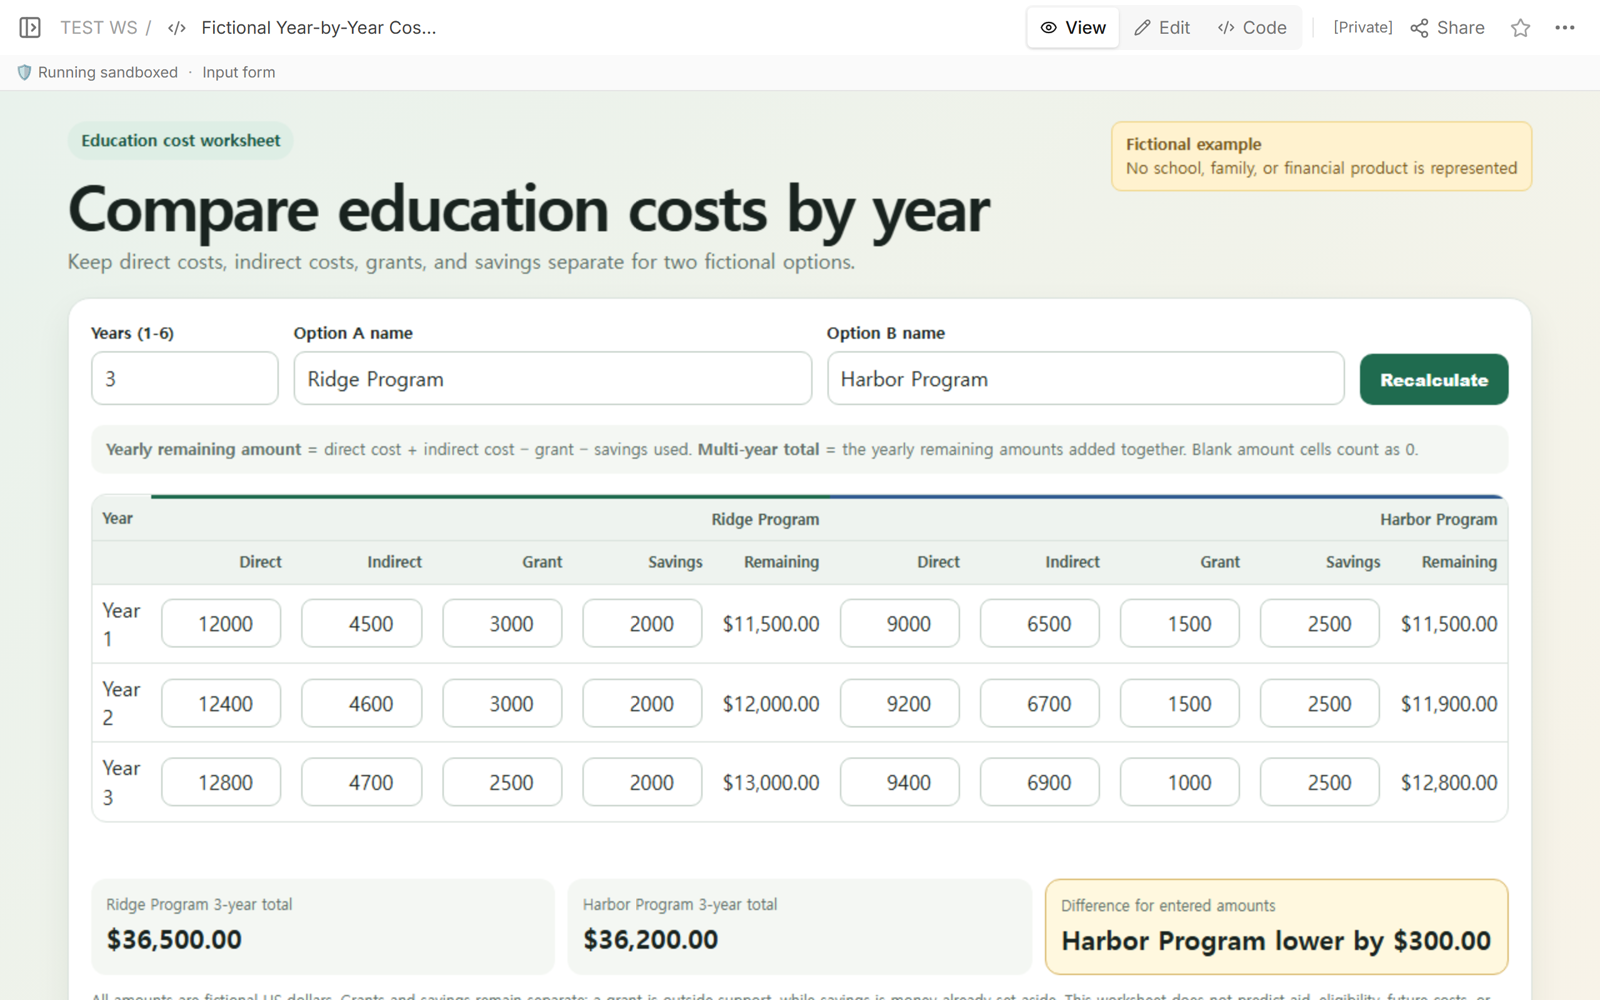
With the sample values, Ridge totals USD 36,500 and Harbor totals USD 36,200. Harbor is lower by USD 300 for the entered amounts. That narrow difference does not make Harbor the better education choice; the page does not compare academic fit, completion, eligibility, borrowing, taxes, or future prices.
How do you compare education costs by year?
Use one row per year and the same four categories for both options. In this example, direct costs are the amounts assigned to the program itself. Indirect costs are the separate living, travel, supplies, or other estimates that you choose to enter. A grant is outside support. Savings is money already set aside. Keeping the last two in separate columns prevents the worksheet from presenting them as the same source.
Multi-year total = all yearly remaining amounts added together
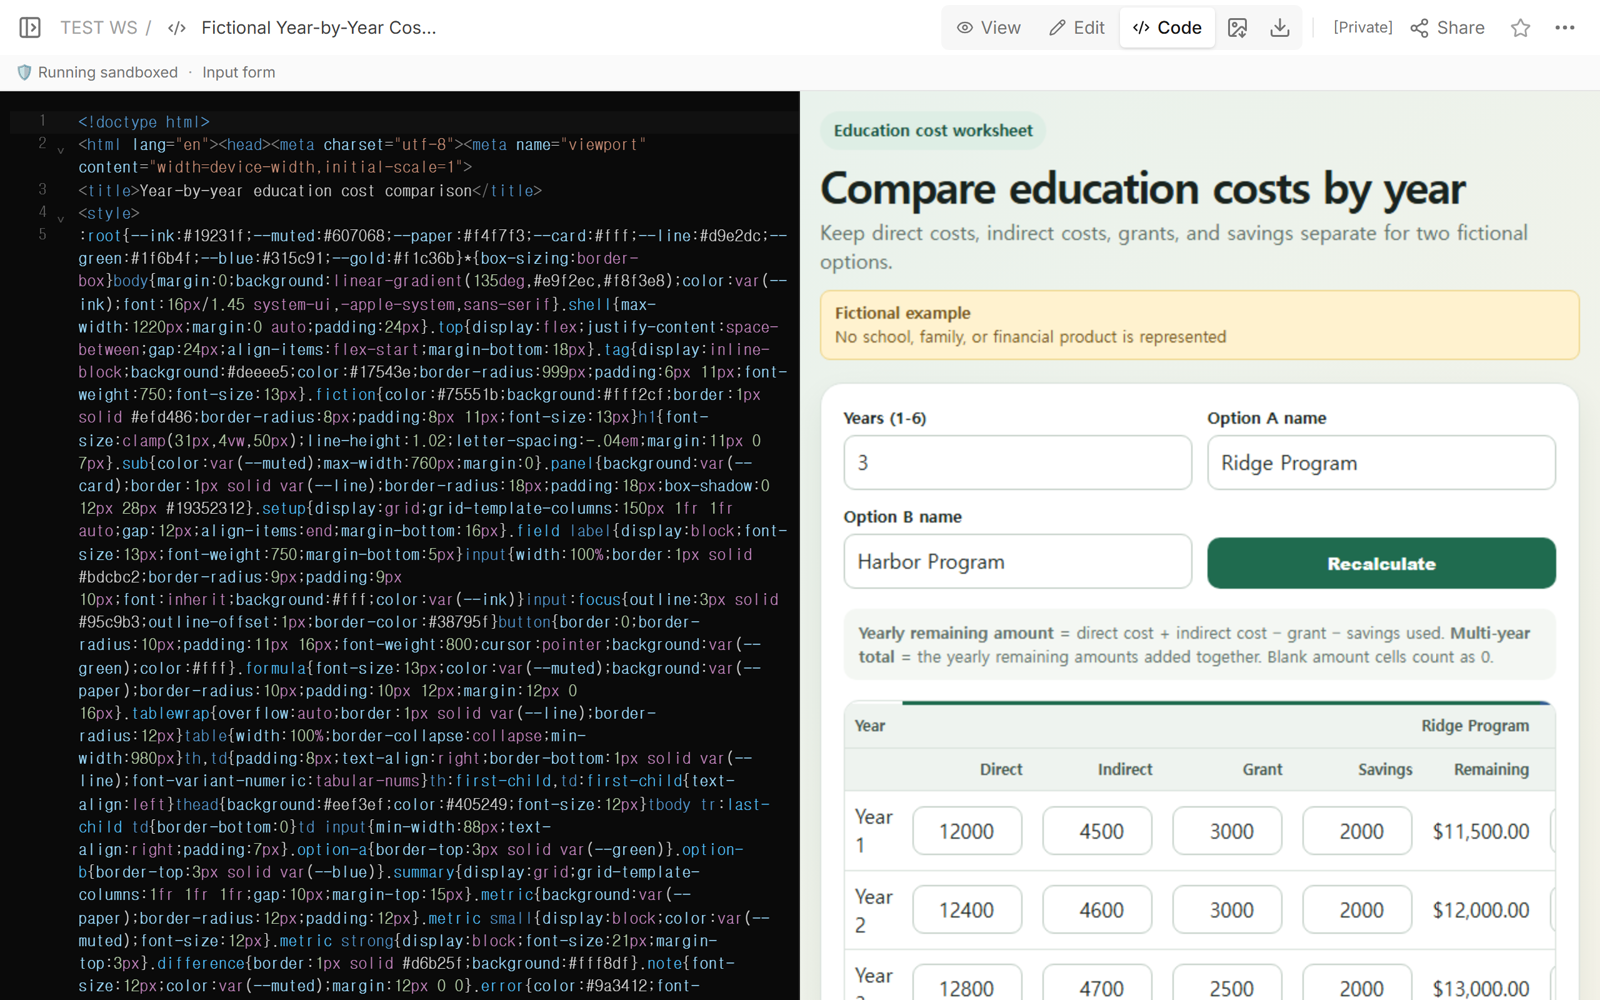
Ridge year 1 uses USD 12,000 direct cost, USD 4,500 indirect cost, a USD 3,000 grant, and USD 2,000 of savings. The displayed remaining amount is USD 11,500. Harbor reaches the same year 1 result from a different mix: USD 9,000 direct, USD 6,500 indirect, a USD 1,500 grant, and USD 2,500 of savings.
How do I use the downloadable calculator?
Download the complete year-by-year education cost calculator. Save the file, open it in a browser, and work from the top of the page:
- Set Years from 1 to 6. Changing the period rebuilds the table for that many years.
- Replace Ridge Program and Harbor Program with your two option names.
- For each year, enter direct cost, indirect cost, grant, and savings used. Use 0 when the category is known to be zero. A blank amount is also calculated as 0, so fill it deliberately rather than leaving an unknown amount blank.
- Choose Recalculate. Read each yearly remaining amount, then compare the two multi-year totals.
The file contains its layout and calculation in one HTML document. It does not send the amounts to another service. Keep the original download as a blank fallback before replacing the fictional values with your own figures.
What happens when an input is blank or zero?
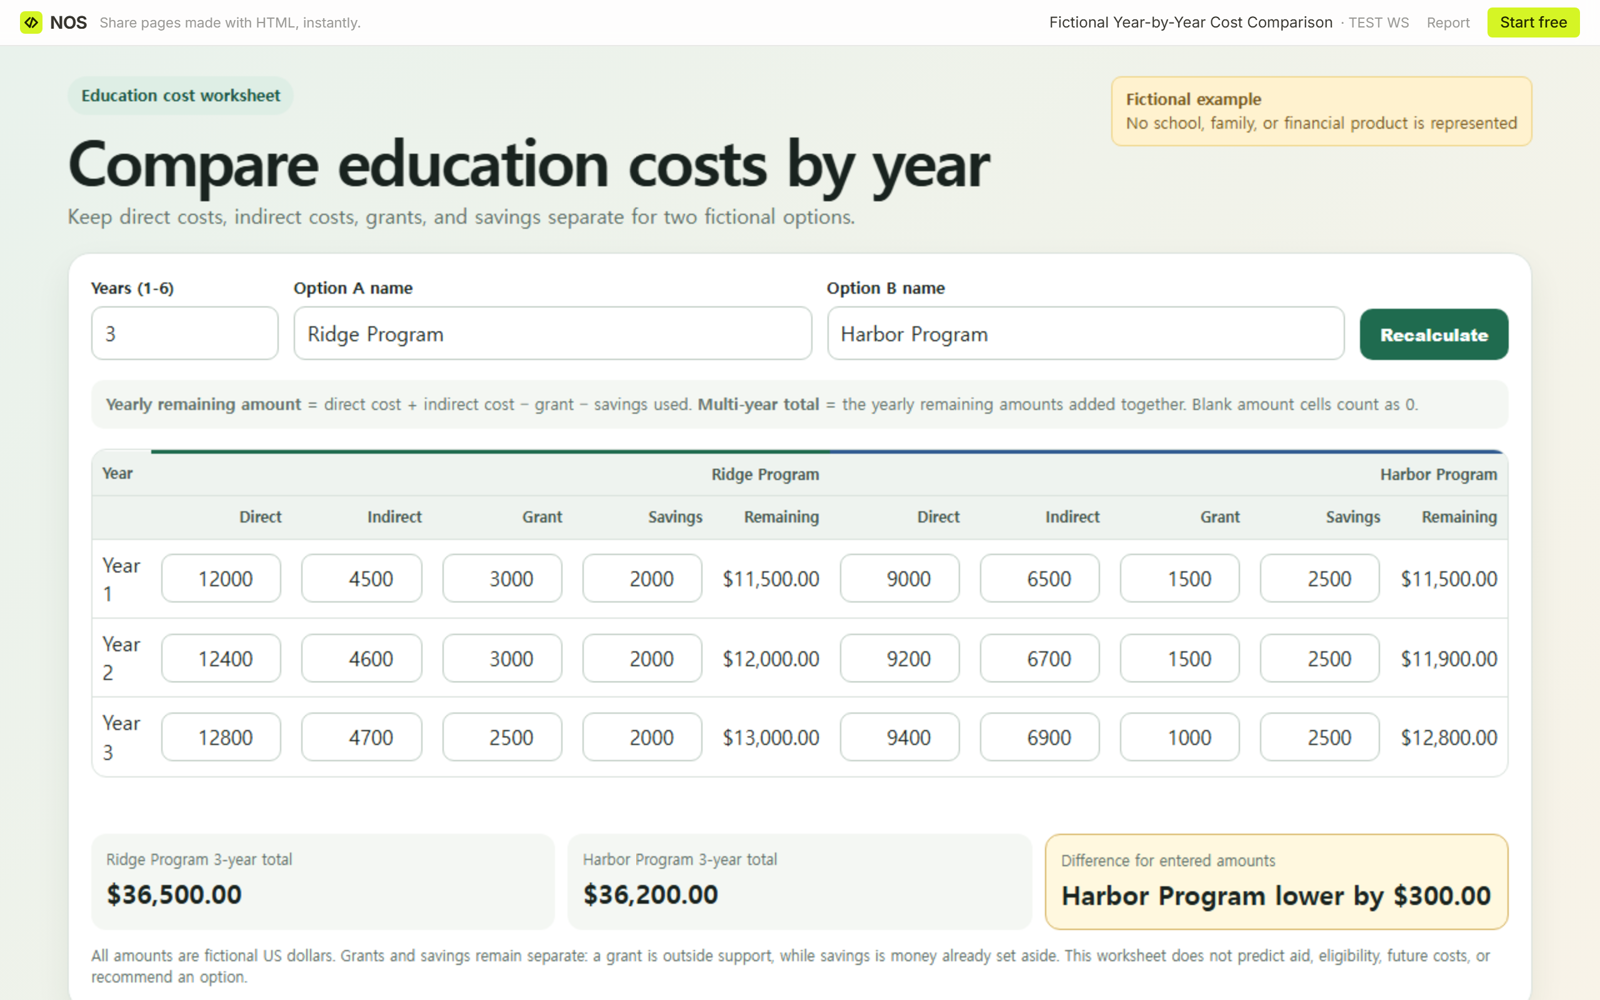
We tested the actual file before linking it. The starting three-year totals were USD 36,500 for Ridge and USD 36,200 for Harbor. Clearing Ridge year 1 direct cost made that cell count as 0 and changed Ridge to USD 24,500. Entering an explicit 0 produced the same total. This is useful for a known zero, but it also means a missing estimate can make the result look artificially low.
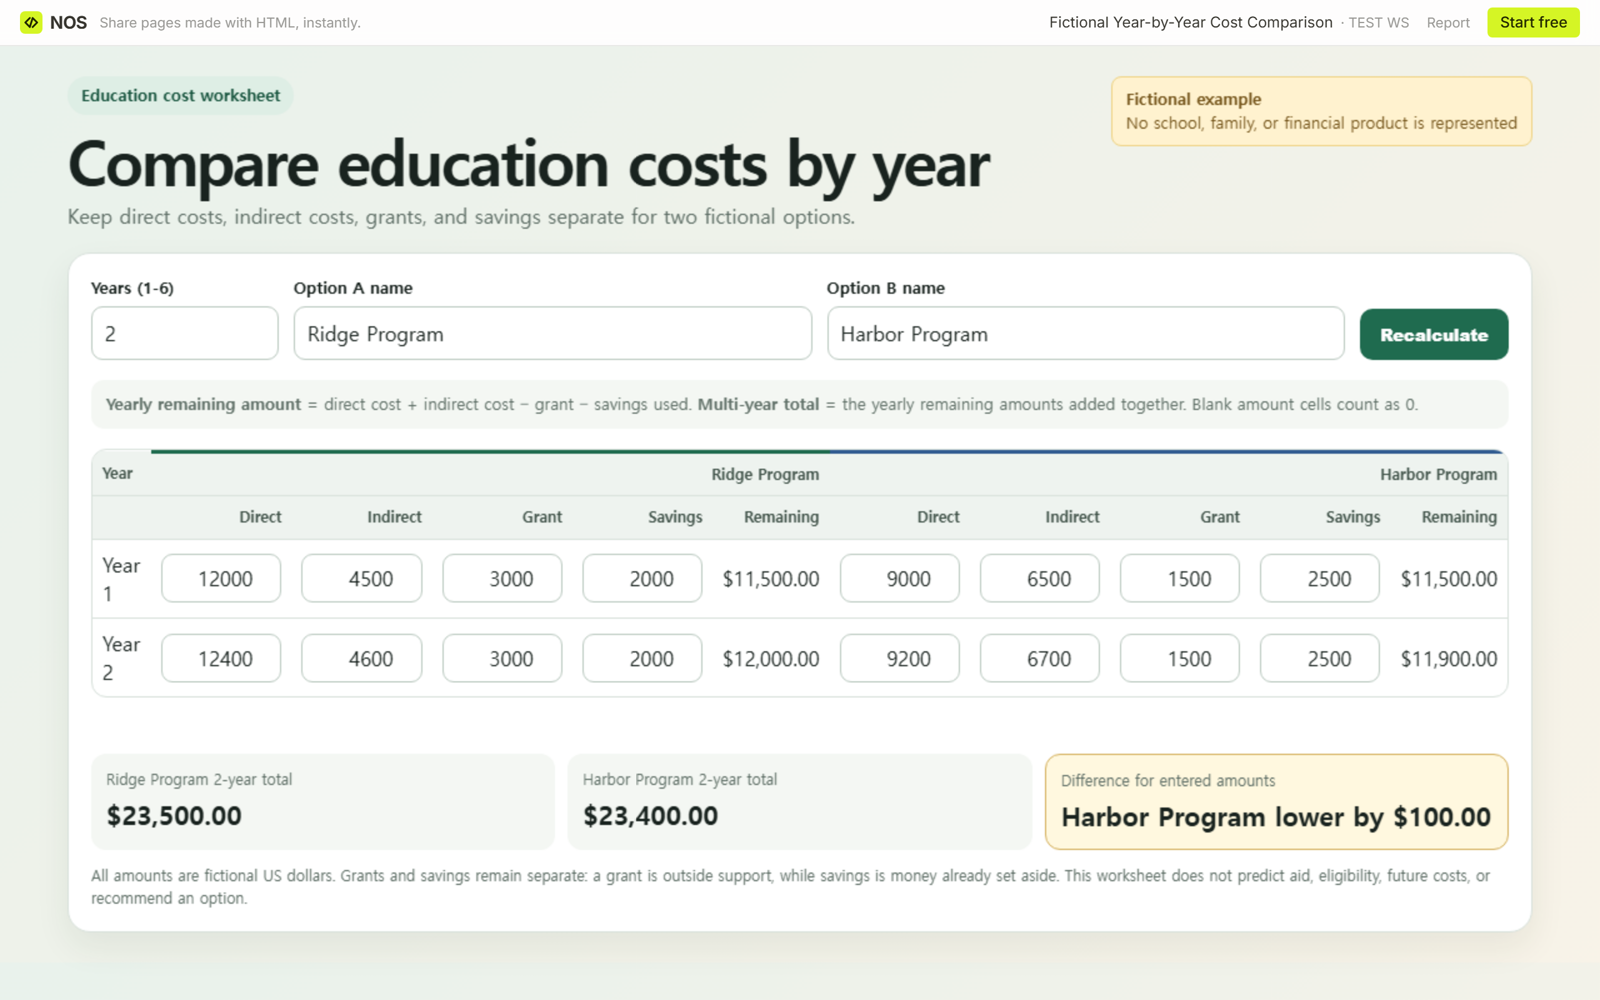
Grant and savings remain separate inputs. Setting only the Ridge year 1 grant to 0 changed Ridge to USD 39,500 while Harbor stayed at USD 36,200. The calculator did not move that amount into savings or another category. Changing the period from three years to two produced two rows and totals of USD 23,500 for Ridge and USD 23,400 for Harbor.
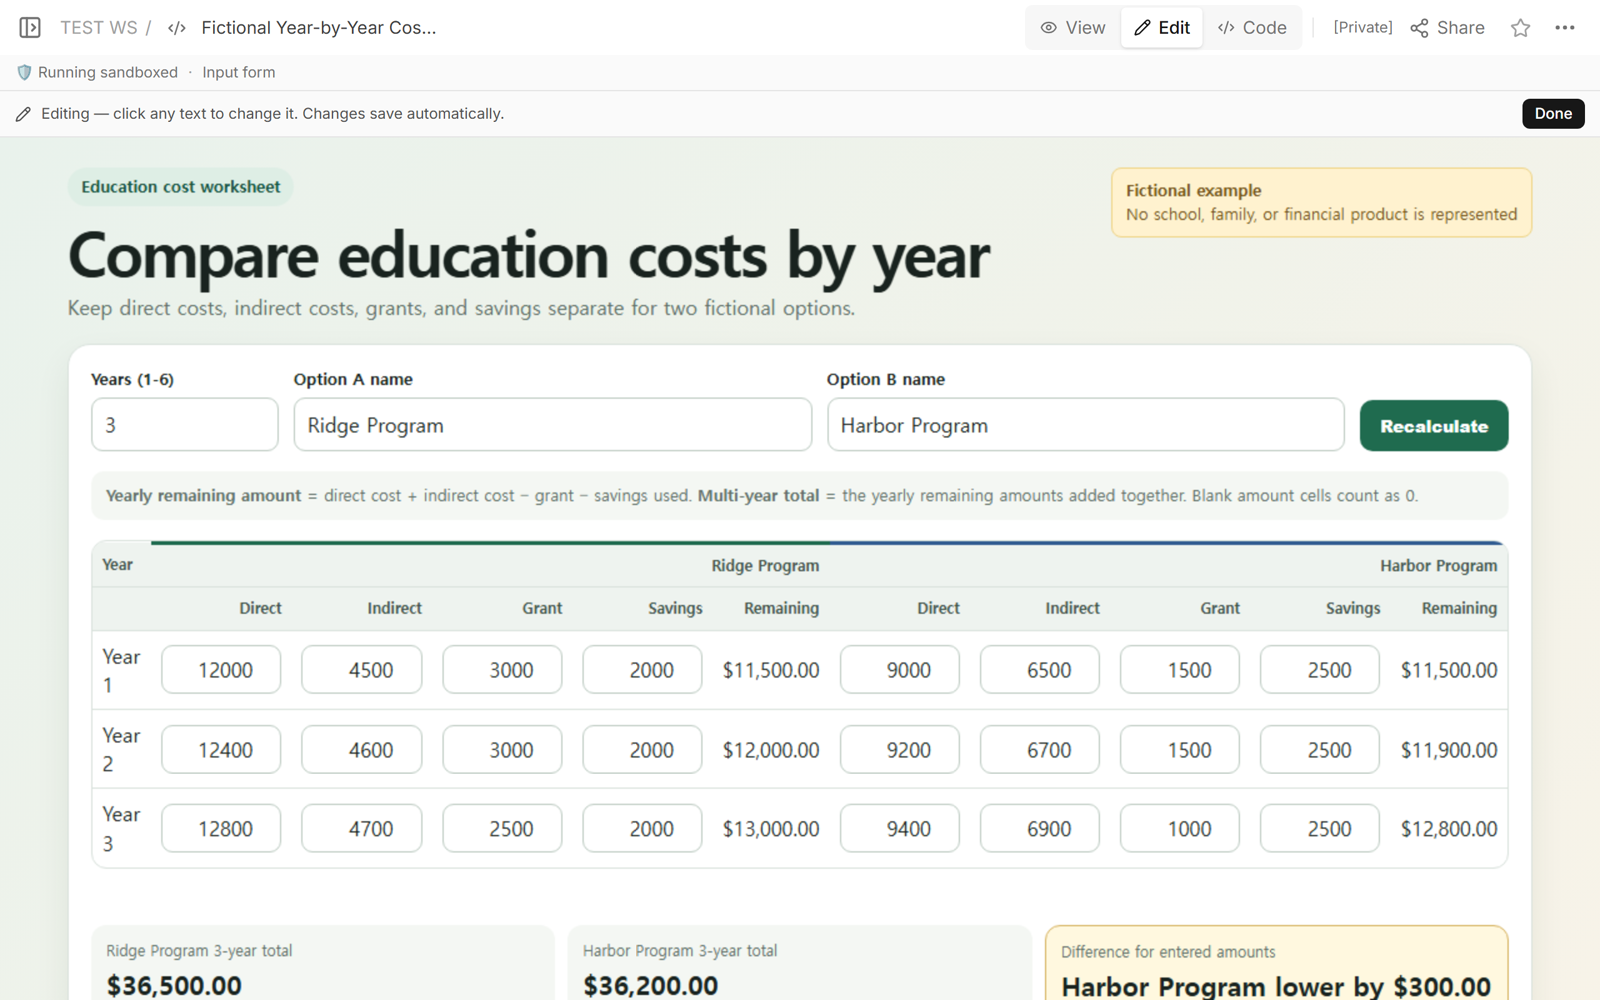
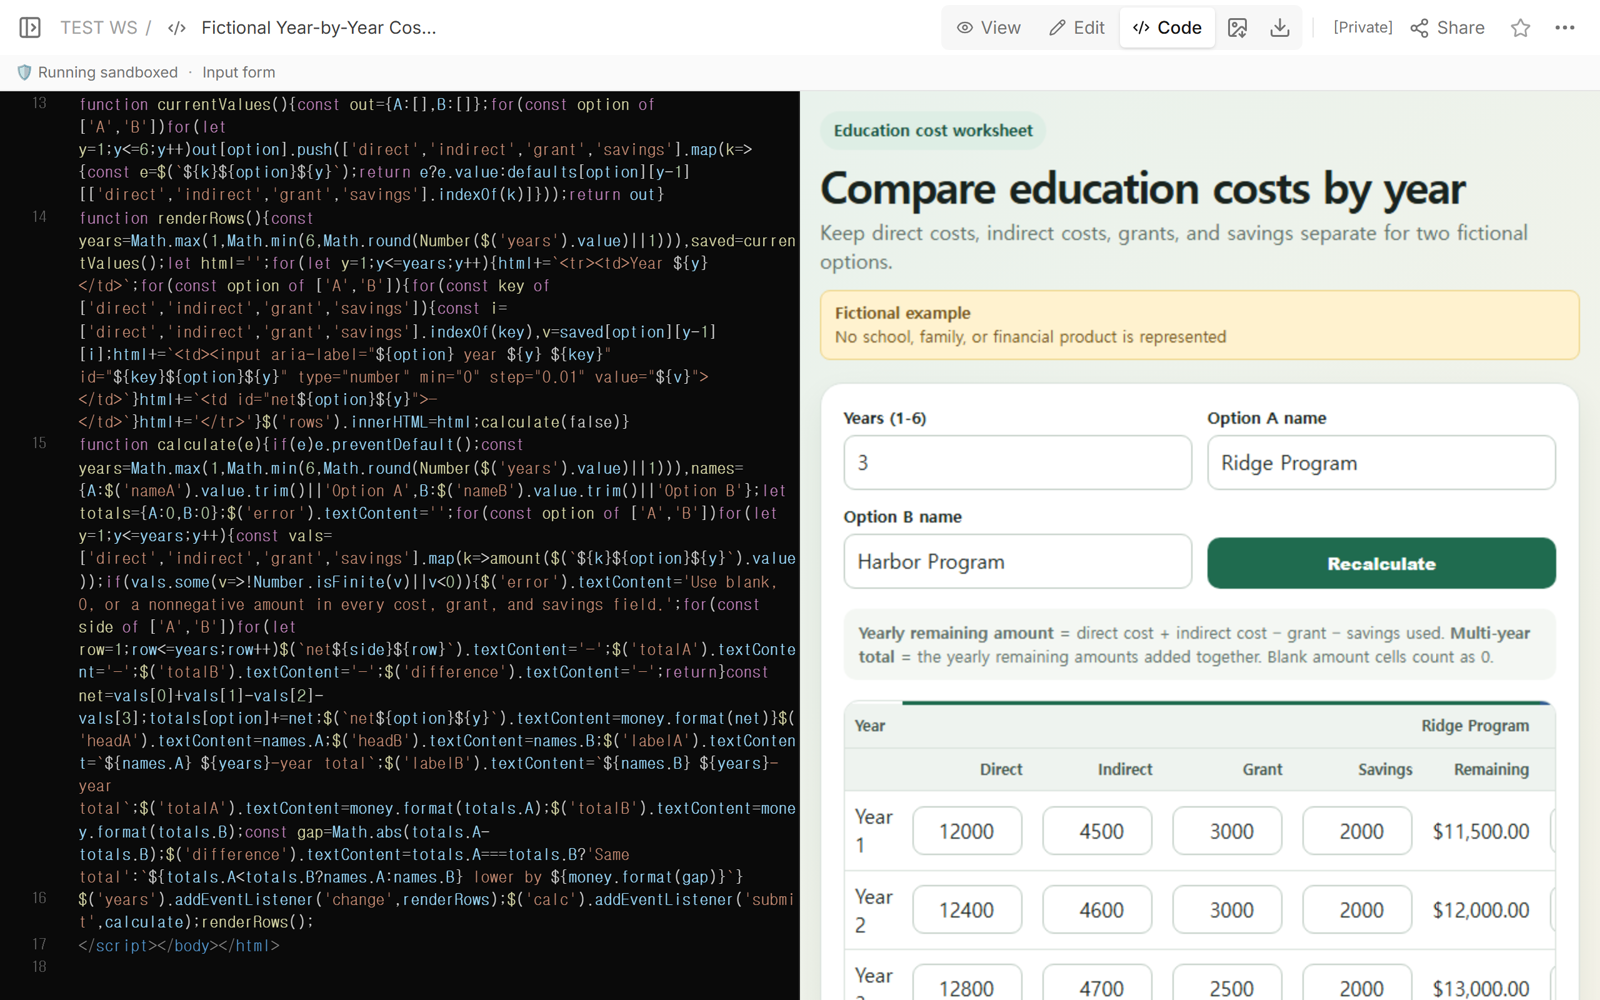
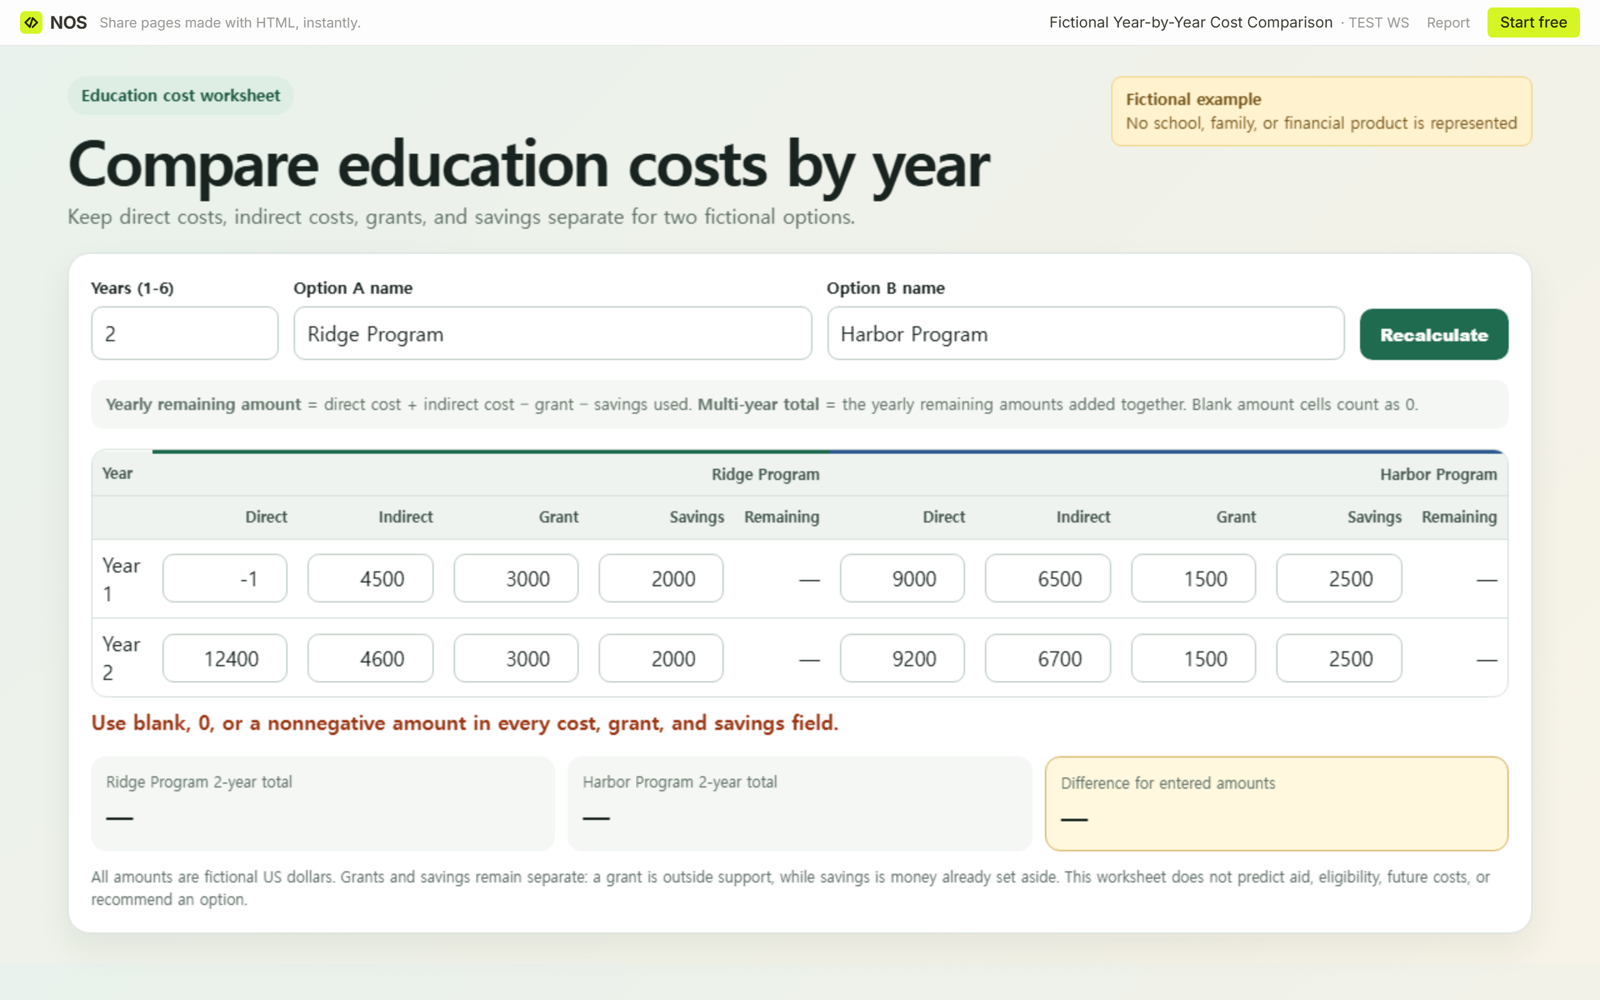
We changed the public calculator from three years to two and recalculated. The same reader link then showed two rows, USD 23,500 for Ridge, and USD 23,400 for Harbor. We also entered a negative direct cost to test the rejected-input state: the page showed its validation message and cleared every yearly result and total instead of leaving the earlier figures on screen. Restoring the sample amount and three-year period returned the original totals.
What should you check before using the total?
First, label every figure with the year it belongs to. Then check that both options use the same currency and cover the same number of years. Decide what your direct and indirect categories mean before entering amounts, and use that definition on both sides. Enter support only in the grant column and money already set aside only in savings.
Finally, compare the source notes with the table. If a grant is unconfirmed, an indirect cost is missing, or a savings amount is not actually available for that year, the calculator cannot resolve the uncertainty. Correct the input or keep the result marked as incomplete. For other arithmetic checks, the percentage change calculator shows how to inspect a change, while job offer comparison demonstrates keeping unlike components separate.
When not to do this
- Do not use the fictional values as estimates for a real program.
- Do not treat an unknown grant, future cost, eligibility decision, or savings balance as 0 just to complete the table.
- Do not use the lower displayed total as financial, tax, borrowing, or enrollment advice.
- Do not place private financial records on a public share page.
Using NOS for a shareable calculator
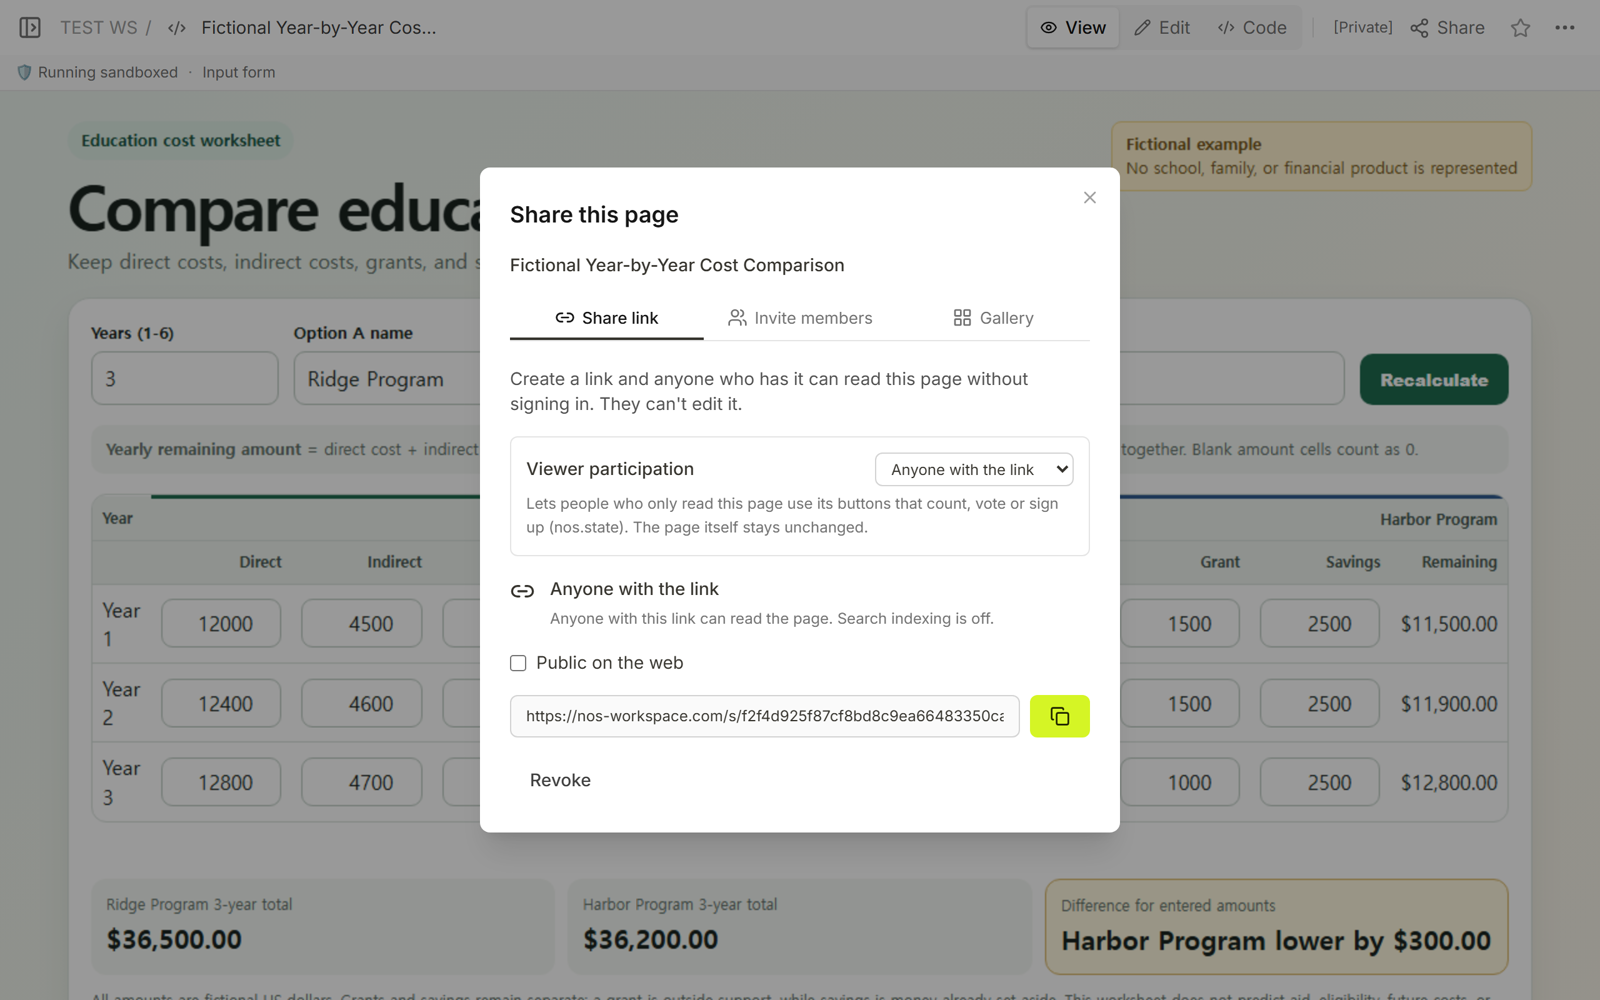
NOS held the prepared HTML calculator, showed it in View, and created a reader link from Share. We updated the existing fictional page and reopened the same reader address to confirm the current education-cost version. The NOS pricing page is the place to check current plan information; no plan price is needed for this calculation.