Leaflet is a JavaScript library for maps. Its home page calls it "an open-source JavaScript library for mobile-friendly interactive maps".
A Leaflet map in a single HTML file needs three things: the Leaflet stylesheet, the Leaflet script, and a <div> with a height. Your own few lines of JavaScript then create the map and put things on it.
Try it first. Drag the map, zoom with the buttons, and click anywhere to read the coordinates.
<!doctype html>
<html lang="en">
<head>
<meta charset="utf-8">
<meta name="viewport" content="width=device-width, initial-scale=1">
<title>Leaflet map in one HTML file</title>
<!-- 1. Leaflet CSS first (pinned version) -->
<link rel="stylesheet" href="https://unpkg.com/leaflet@1.9.4/dist/leaflet.css"
      integrity="sha256-p4NxAoJBhIIN+hmNHrzRCf9tD/miZyoHS5obTRR9BMY=" crossorigin="">
<style>
  body { margin: 0; font-family: system-ui, sans-serif; }
  /* 2. The map div needs a height, or it is 0px tall */
  #map { height: 380px; background: #eef3ea; }
</style>
</head>
<body>
<div id="map"></div>

<!-- 3. Leaflet JS after the CSS -->
<script src="https://unpkg.com/leaflet@1.9.4/dist/leaflet.js"
        integrity="sha256-20nQCchB9co0qIjJZRGuk2/Z9VM+kNiyxNV1lvTlZBo=" crossorigin=""></script>
<script>
  // 4. Create the map: centre [lat, lng] and zoom level
  const map = L.map('map').setView([51.505, -0.09], 14);

  // No tile layer here, so nothing loads from a tile server.
  // A faint grid shows the map moving when you drag or zoom.
  for (let i = -4; i <= 4; i++) {
    L.polyline([[51.505 + i * 0.005, -0.13], [51.505 + i * 0.005, -0.05]], { color: '#c9d6c3', weight: 1 }).addTo(map);
    L.polyline([[51.48, -0.09 + i * 0.008], [51.53, -0.09 + i * 0.008]], { color: '#c9d6c3', weight: 1 }).addTo(map);
  }

  // Shapes, each with a popup
  L.circle([51.508, -0.11], { radius: 500, color: '#d33', fillOpacity: 0.25 })
    .addTo(map).bindPopup('A circle with a 500 m radius');
  L.polygon([[51.509, -0.08], [51.503, -0.06], [51.51, -0.047]], { color: '#2a6' })
    .addTo(map).bindPopup('A polygon');
  L.circleMarker([51.5, -0.09], { radius: 9, color: '#fff', weight: 2, fillColor: '#1f6feb', fillOpacity: 1 })
    .addTo(map).bindPopup('<b>Hello!</b><br>Drag, zoom, or click the map.').openPopup();

  // Click anywhere: show the coordinates
  map.on('click', function (e) {
    L.popup().setLatLng(e.latlng)
      .setContent('You clicked ' + e.latlng.lat.toFixed(4) + ', ' + e.latlng.lng.toFixed(4))
      .openOn(map);
  });
</script>
</body>
</html>
This example has no street map underneath on purpose. The street map comes from image tiles on another server, covered in the tiles section below.
The smallest working page
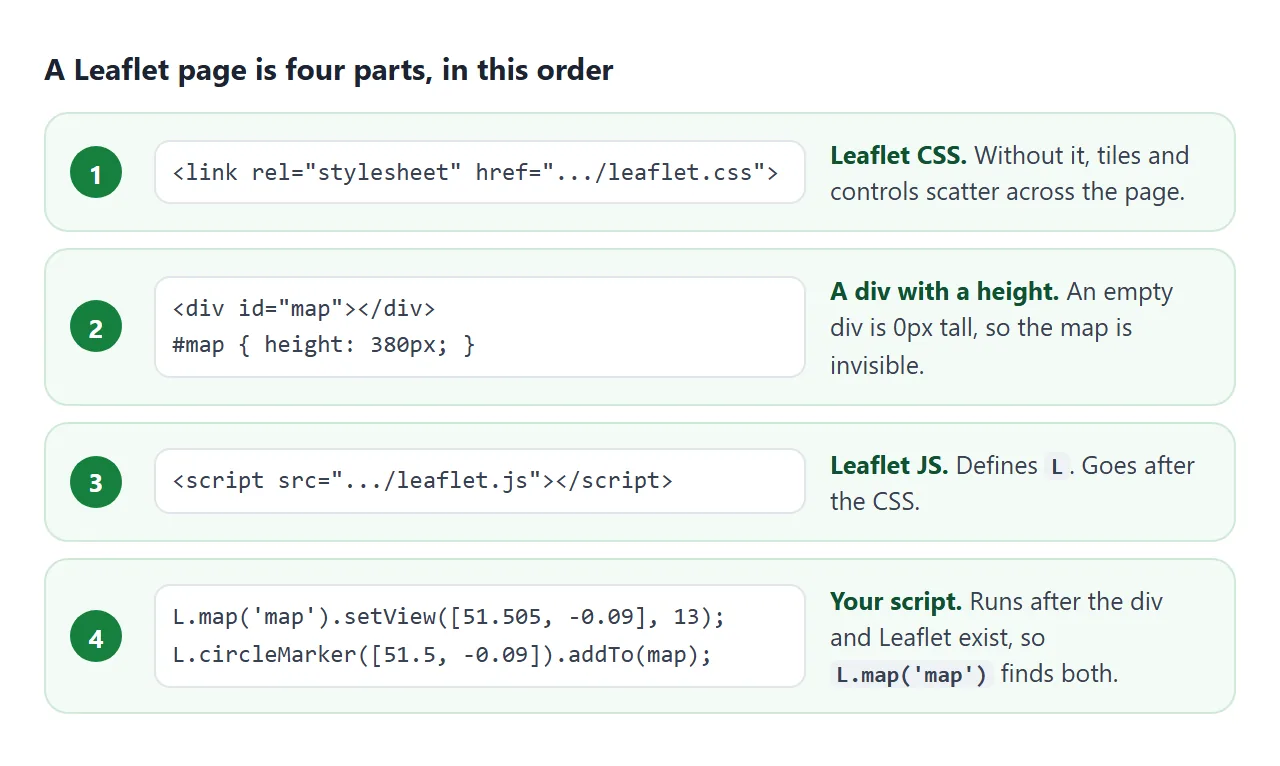
Every Leaflet page has the same four parts, in this order:
- The Leaflet CSS in the
<head>. - A map div with a height, such as
#map { height: 400px; }. - The Leaflet script, after the CSS.
- Your script, which calls
L.map('map')and adds layers.
This is the page from the Leaflet quick start guide, put into one file. It includes the OpenStreetMap tile layer, so open it from your computer to see the street map:
<!doctype html>
<html lang="en">
<head>
<meta charset="utf-8">
<meta name="viewport" content="width=device-width, initial-scale=1">
<link rel="stylesheet" href="https://unpkg.com/leaflet@1.9.4/dist/leaflet.css"
integrity="sha256-p4NxAoJBhIIN+hmNHrzRCf9tD/miZyoHS5obTRR9BMY=" crossorigin="">
<style>#map { height: 400px; }</style>
</head>
<body>
<div id="map"></div>
<script src="https://unpkg.com/leaflet@1.9.4/dist/leaflet.js"
integrity="sha256-20nQCchB9co0qIjJZRGuk2/Z9VM+kNiyxNV1lvTlZBo=" crossorigin=""></script>
<script>
const map = L.map('map').setView([51.505, -0.09], 13);
L.tileLayer('https://tile.openstreetmap.org/{z}/{x}/{y}.png', {
maxZoom: 19,
attribution: '© <a href="http://www.openstreetmap.org/copyright">OpenStreetMap</a>'
}).addTo(map);
L.marker([51.5, -0.09]).addTo(map).bindPopup('Hello world!').openPopup();
</script>
</body>
</html>
setView takes a centre as [latitude, longitude] and a zoom level. Higher numbers zoom in closer.
Which version and which script tag
The Leaflet download page lists Leaflet 1.9.4, released on May 18, 2023, as the current stable version. It also lists Leaflet 2.0.0-alpha.1, released on August 16, 2025, as a prerelease.
The same page says Leaflet is available on the free CDNs unpkg, cdnjs and jsDelivr. The tags above are the ones the download page gives for unpkg.
| Part | What it is for |
|---|---|
leaflet@1.9.4 in the URL |
Pins the version, so the file never changes |
integrity="sha256-..." |
The browser refuses the file if it does not match the hash |
crossorigin="" |
Needed for the integrity check on a file from another site |
leaflet.css |
Positions tiles, controls and popups |
Copy the CSS and JS tags as a pair, with their hashes. A hash belongs to one exact file, so it blocks every other version.
Leaflet itself is open source. Its GitHub repository lists the licence as BSD-2-Clause.
The map is blank: give the div a height
A <div> with nothing inside is 0px tall. Leaflet draws the map at the size of its div, so a div with no height shows nothing, and there is no error in the console.
Both maps below run exactly the same code. Only the CSS differs:
<!doctype html>
<html lang="en">
<head>
<meta charset="utf-8">
<meta name="viewport" content="width=device-width, initial-scale=1">
<title>Map div with and without a height</title>
<link rel="stylesheet" href="https://unpkg.com/leaflet@1.9.4/dist/leaflet.css"
      integrity="sha256-p4NxAoJBhIIN+hmNHrzRCf9tD/miZyoHS5obTRR9BMY=" crossorigin="">
<style>
  body { margin: 0; padding: 12px; font-family: system-ui, sans-serif; font-size: 14px; background: #f4f5f7; }
  .cols { display: grid; grid-template-columns: 1fr 1fr; gap: 10px; }
  .col { background: #fff; border-radius: 10px; padding: 10px; box-shadow: 0 3px 10px rgba(0, 0, 0, .08); min-width: 0; }
  h3 { margin: 0 0 4px; font-size: 14px; }
  code { font-size: 12px; background: #eef1f5; padding: 1px 4px; border-radius: 4px; }
  .map { background: #eef3ea; outline: 2px dashed #e08a2c; }
  #with { height: 220px; outline-color: #2a9d55; }
  .size { margin: 6px 0 0; color: #555; }
</style>
</head>
<body>
<div class="cols">
  <div class="col">
    <h3>No height</h3><code>#without { }</code>
    <div id="without" class="map"></div>
    <p class="size" id="size1"></p>
  </div>
  <div class="col">
    <h3>Height set</h3><code>#with { height: 220px; }</code>
    <div id="with" class="map"></div>
    <p class="size" id="size2"></p>
  </div>
</div>

<script src="https://unpkg.com/leaflet@1.9.4/dist/leaflet.js"
        integrity="sha256-20nQCchB9co0qIjJZRGuk2/Z9VM+kNiyxNV1lvTlZBo=" crossorigin=""></script>
<script>
  // Exactly the same code for both maps
  ['without', 'with'].forEach(function (id, i) {
    const map = L.map(id).setView([51.505, -0.09], 13);
    L.circle([51.505, -0.09], { radius: 600, color: '#1f6feb' }).addTo(map);
    const h = document.getElementById(id).offsetHeight;
    document.getElementById('size' + (i + 1)).textContent = 'Map div height: ' + h + 'px';
  });
</script>
</body>
</html>
The quick start guide says it directly: "Make sure the map container has a defined height". Any CSS height works, in pixels or in vh.
A related case: a map inside a tab, an accordion or a dialog that is hidden when the page loads. The div has no size at that moment. Call map.invalidateSize() right after you show it, and Leaflet measures the div again.
Tiles: where the street map comes from
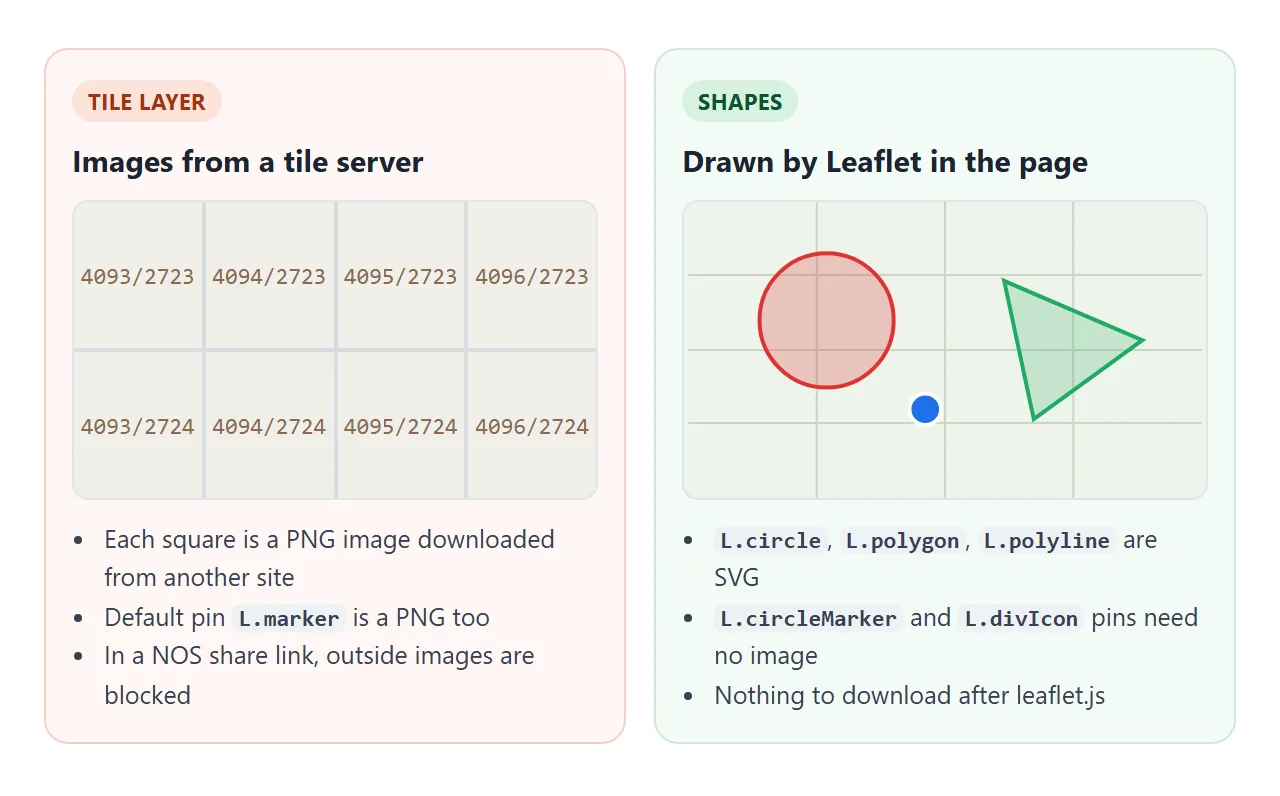
The street map is not part of Leaflet. L.tileLayer downloads square images, called tiles, from a tile server and lays them side by side. Dragging and zooming request more of them.
The Leaflet reference notes that most tile servers require attribution. The OpenStreetMap tile usage policy asks you to "show OpenStreetMap licence attribution clearly on the map". It also says the tile servers are funded by donations and that availability is "best-effort".
Shapes are different. L.circle, L.polygon, L.polyline and L.circleMarker are drawn by Leaflet in the page as SVG. They need nothing from a server once leaflet.js has loaded.
The default pin, L.marker, is an image too. Leaflet loads marker-icon.png from an images folder next to leaflet.css. Two options need no image file:
// A round pin, size in pixels
L.circleMarker([51.5, -0.09], { radius: 8 }).addTo(map);

// Any HTML as a pin, styled with your own CSS
const icon = L.divIcon({ className: '', html: '<div class="pin">1</div>', iconSize: [26, 26] });
L.marker([51.5, -0.09], { icon: icon }).addTo(map);
For a map that is only a drawing, such as a floor plan, map markers in HTML shows a version with no library at all.
Latitude first, longitude second
Leaflet takes points as [lat, lng]. GeoJSON, the common file format for map data, stores them the other way round. The GeoJSON specification, RFC 7946, says the first two elements are "longitude and latitude ... precisely in that order".
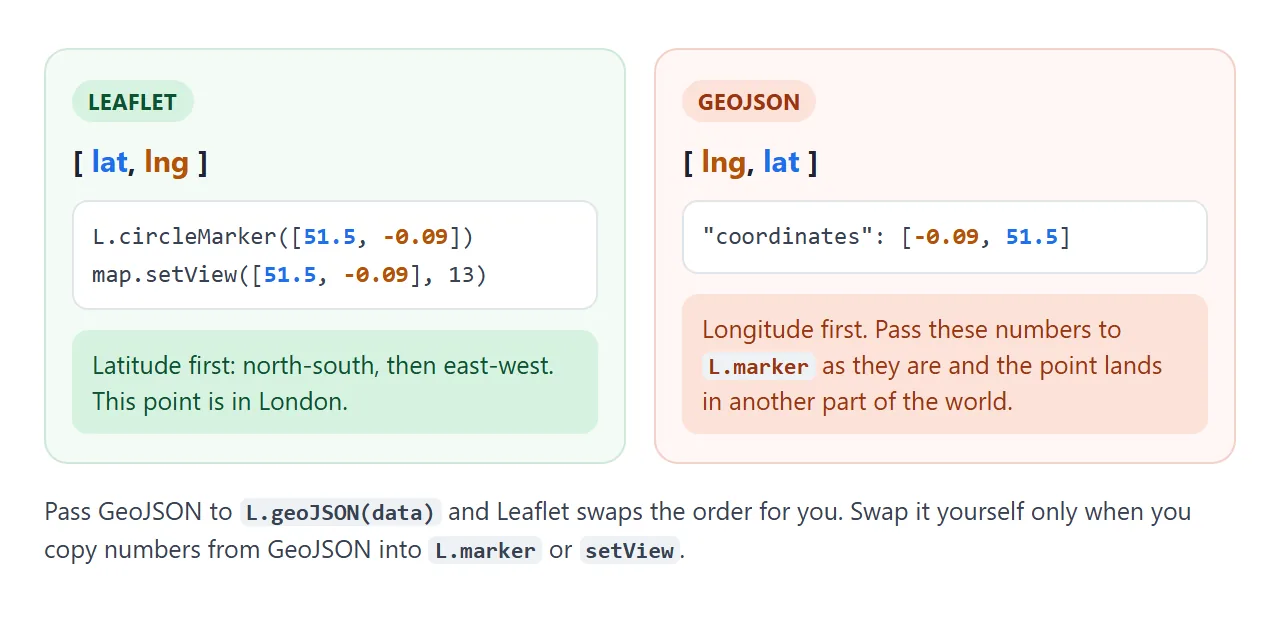
When you pass GeoJSON to L.geoJSON, Leaflet reads the order correctly for you:
const data = {
  type: 'Feature',
  properties: { name: 'Meeting point' },
  geometry: { type: 'Point', coordinates: [-0.09, 51.5] } // lng, lat
};
L.geoJSON(data).bindPopup('Meeting point').addTo(map);
Swap the numbers yourself only when you copy them out of GeoJSON into L.marker or setView. To turn the visitor's own position into a point, see the Geolocation API.
A finished example: a venue map with no tiles
Leaflet also works on flat plans. With crs: L.CRS.Simple, the Leaflet reference says it "maps longitude and latitude into x and y directly", for maps of flat surfaces. Coordinates are then plain units on your drawing.
<!doctype html>
<html lang="en">
<head>
<meta charset="utf-8">
<meta name="viewport" content="width=device-width, initial-scale=1">
<title>Venue map with Leaflet</title>
<link rel="stylesheet" href="https://unpkg.com/leaflet@1.9.4/dist/leaflet.css"
      integrity="sha256-p4NxAoJBhIIN+hmNHrzRCf9tD/miZyoHS5obTRR9BMY=" crossorigin="">
<style>
  body { margin: 0; font-family: system-ui, sans-serif; font-size: 14px; background: #eceef1; }
  .app { display: grid; grid-template-columns: 1fr 200px; gap: 10px; padding: 10px; }
  #map { height: 400px; border-radius: 10px; background: #f7f5ef; }
  ul { list-style: none; margin: 0; padding: 0; }
  li button {
    width: 100%; text-align: left; font: inherit; margin-bottom: 6px; padding: 8px 10px;
    border: 0; border-radius: 8px; background: #fff; cursor: pointer;
  }
  li button.on { background: #1f6feb; color: #fff; }
  .pin {
    width: 26px; height: 26px; border-radius: 50%; background: #1f6feb; color: #fff;
    border: 2px solid #fff; box-shadow: 0 1px 4px rgba(0, 0, 0, .4);
    display: grid; place-items: center; font-weight: 700; font-size: 13px; box-sizing: border-box;
  }
  @media (max-width: 560px) {
    .app { grid-template-columns: 1fr; }
    #map { height: 300px; }
    ul { display: grid; grid-template-columns: 1fr 1fr; gap: 0 6px; }
  }
</style>
</head>
<body>
<div class="app">
  <div id="map"></div>
  <ul id="list"></ul>
</div>

<script src="https://unpkg.com/leaflet@1.9.4/dist/leaflet.js"
        integrity="sha256-20nQCchB9co0qIjJZRGuk2/Z9VM+kNiyxNV1lvTlZBo=" crossorigin=""></script>
<script>
  // A flat plan, not the globe: CRS.Simple uses plain x/y units
  const map = L.map('map', { crs: L.CRS.Simple, minZoom: -2, maxZoom: 2, zoomSnap: 0.25 });

  // The floor plan is an inline SVG, 1000 x 600 units
  const W = 1000, H = 600;
  const svg = document.createElementNS('http://www.w3.org/2000/svg', 'svg');
  svg.setAttribute('viewBox', '0 0 ' + W + ' ' + H);
  svg.innerHTML =
    '<rect x="10" y="10" width="980" height="580" rx="16" fill="#fff" stroke="#9aa3ad" stroke-width="6"/>' +
    '<rect x="40" y="40" width="380" height="240" fill="#e7f0fb"/><text x="230" y="170" font-size="34" text-anchor="middle" fill="#5b6b7c">Main hall</text>' +
    '<rect x="460" y="40" width="240" height="240" fill="#eaf6ee"/><text x="580" y="170" font-size="30" text-anchor="middle" fill="#5b6b7c">Room A</text>' +
    '<rect x="740" y="40" width="220" height="240" fill="#eaf6ee"/><text x="850" y="170" font-size="30" text-anchor="middle" fill="#5b6b7c">Room B</text>' +
    '<rect x="40" y="320" width="560" height="240" fill="#fdf1e3"/><text x="320" y="450" font-size="34" text-anchor="middle" fill="#5b6b7c">Food court</text>' +
    '<rect x="640" y="320" width="320" height="240" fill="#f2eefa"/><text x="800" y="450" font-size="30" text-anchor="middle" fill="#5b6b7c">Lobby</text>';
  const bounds = [[0, 0], [H, W]];
  L.svgOverlay(svg, bounds).addTo(map);
  map.fitBounds(bounds);

  // Places in SVG coordinates. y is flipped: Leaflet counts up from the bottom
  const places = [
    { name: 'Registration', x: 800, y: 500, note: 'Badges from 8:30' },
    { name: 'Keynote stage', x: 230, y: 90, note: 'Opening talk at 9:30' },
    { name: 'Workshop 1', x: 580, y: 230, note: 'Room A, 11:00' },
    { name: 'Workshop 2', x: 850, y: 230, note: 'Room B, 14:00' },
    { name: 'Coffee', x: 120, y: 380, note: 'All day' },
    { name: 'Lunch', x: 420, y: 520, note: '12:30 to 13:30' }
  ];
  const toLatLng = function (p) { return [H - p.y, p.x]; };

  const list = document.getElementById('list');
  places.forEach(function (p, i) {
    // divIcon: an HTML pin, no image file
    const icon = L.divIcon({ className: '', html: '<div class="pin">' + (i + 1) + '</div>', iconSize: [26, 26] });
    const marker = L.marker(toLatLng(p), { icon: icon, title: p.name })
      .addTo(map).bindPopup('<b>' + p.name + '</b><br>' + p.note);

    const btn = document.createElement('button');
    btn.textContent = (i + 1) + '. ' + p.name;
    btn.addEventListener('click', function () {
      map.flyTo(toLatLng(p), 0.5, { duration: 0.5 });
      marker.openPopup();
    });
    marker.on('popupopen', function () { btn.classList.add('on'); });
    marker.on('popupclose', function () { btn.classList.remove('on'); });
    const li = document.createElement('li');
    li.appendChild(btn);
    list.appendChild(li);
  });

  // Click empty space to read coordinates, handy when adding places
  map.on('click', function (e) {
    L.popup().setLatLng(e.latlng)
      .setContent('x ' + Math.round(e.latlng.lng) + ', y ' + Math.round(H - e.latlng.lat))
      .openOn(map);
  });
</script>
</body>
</html>
Four details worth copying:
L.svgOverlayputs an inline<svg>over the bounds you give it, so the plan zooms and pans with the map.fitBoundszooms to show the whole plan, at any screen width.- The y axis is flipped. In
CRS.Simple, y counts up from the bottom, soH - yconverts from SVG coordinates. - The list uses buttons. Each one calls
flyToandopenPopup, so the plan also works from the keyboard.
Everything here is drawn in the page, so nothing is downloaded after leaflet.js.
When it does not work
| What you see | Cause | Fix |
|---|---|---|
| Nothing at all, no error | The map div has no height | Set a height on #map |
| Tiles scattered down the page | leaflet.css is missing or failed to load |
Add the CSS link in the head |
L is not defined |
Your script runs before leaflet.js |
Put your script after the Leaflet tag |
Map container not found |
L.map('map') runs before the div exists |
Put your script below the div |
| Grey map inside a tab or dialog | The div was hidden when the map was created | Call map.invalidateSize() after showing it |
| Script blocked, integrity error | Hash and file do not match | Copy both tags from the download page |
| A marker lands in the wrong place | Coordinates in GeoJSON order | Use [lat, lng] |
| A broken image instead of a pin | The marker image did not load | Use L.circleMarker or L.divIcon |
If the page shows nothing and the table does not help, HTML JavaScript not working covers the general checks.
Share it as a link
A map is easier to show than to describe. A screenshot cannot be dragged or zoomed, and an .html attachment may open as plain code on a phone.
To send the working version, paste the page into a NOS document and choose Create share link. HTML to link walks through it.
The page renders as written, leaflet.js and leaflet.css load from unpkg and your code runs, so the people you send it to can drag, zoom and click the map without an account. If you change the code later, the same link shows the new version.
One limit to plan for: a NOS share page blocks images from other sites, so tile layers and the default pin image do not appear there.
Shapes, circleMarker, divIcon pins and inline SVG plans like the examples on this page work. To send people to a real street address instead, a link to a map location sends them to a map service.