To put markers on a map in HTML without a map service, draw the map as an inline SVG, wrap it in a box with position: relative, and add one <button> per marker with left and top in percent.
The percentages keep each pin on its spot at every screen width.
Try it. Click a pin, or press Tab to move between them and Enter to open one.
<!doctype html>
<html lang="en">
<head>
<meta charset="utf-8">
<meta name="viewport" content="width=device-width, initial-scale=1">
<title>Map with markers</title>
<style>
body { margin: 0; padding: 12px; font-family: system-ui, sans-serif; background: #f4f5f7; }
p.hint { margin: 0 0 8px; font-size: 13px; color: #5b6270; }
.map { position: relative; max-width: 560px; } /* markers are placed in % of this box */
.map > svg { display: block; width: 100%; height: auto; border-radius: 10px; }
.pin {
position: absolute; width: 28px; height: 36px; padding: 0;
border: 0; background: none; cursor: pointer;
transform: translate(-50%, -100%); /* the tip of the pin sits on the point */
}
.pin svg { display: block; width: 100%; height: 100%; fill: #d9480f; }
.pin[aria-expanded="true"] svg { fill: #1d4ed8; }
.pin:focus-visible { outline: 3px solid #1d4ed8; outline-offset: 2px; border-radius: 6px; }
.popup {
position: absolute; z-index: 2; width: 190px; padding: 10px 12px;
background: #fff; border-radius: 10px; box-shadow: 0 8px 24px rgba(0, 0, 0, .2);
font-size: 13px; line-height: 1.4;
}
.popup b { display: block; font-size: 14px; margin-bottom: 2px; padding-right: 20px; }
.popup .x { position: absolute; right: 6px; top: 6px; border: 0; background: none; font-size: 16px; cursor: pointer; }
</style>
</head>
<body>
<p class="hint">Click or tab to a pin. Esc closes the popup.</p>
<div class="map" id="map">
<svg viewBox="0 0 800 500" role="img" aria-label="Campus map">
<rect width="800" height="500" fill="#eef1ea"/>
<path d="M0 400 C160 360 280 450 440 410 S690 350 800 380 V500 H0Z" fill="#cfe3f5"/>
<rect x="470" y="50" width="270" height="170" rx="18" fill="#d4ebcf"/>
<g stroke="#fff" stroke-width="18" stroke-linecap="round" fill="none">
<path d="M20 260 H780"/><path d="M300 20 V370"/><path d="M620 260 V350"/>
</g>
<g fill="#d8dce2">
<rect x="60" y="60" width="180" height="150" rx="8"/>
<rect x="340" y="60" width="100" height="160" rx="8"/>
<rect x="60" y="290" width="200" height="70" rx="8"/>
<rect x="340" y="290" width="240" height="70" rx="8"/>
</g>
<g font-family="system-ui, sans-serif" font-size="20" fill="#5b6270">
<text x="560" y="140">Park</text><text x="330" y="470">River</text>
</g>
</svg>
</div>
<template id="pin-svg">
<svg viewBox="0 0 24 32" aria-hidden="true"><path d="M12 0C5.4 0 0 5.4 0 12c0 9 12 20 12 20s12-11 12-20C24 5.4 18.6 0 12 0z"/><circle cx="12" cy="12" r="4.5" fill="#fff"/></svg>
</template>
<script>
// x and y are in the SVG's own units (viewBox 0 0 800 500)
const places = [
{ x: 150, y: 135, name: 'Main hall', text: 'Open 7:00-22:00. Visitor badges at the front desk.' },
{ x: 390, y: 140, name: 'Library', text: 'Quiet floors 2 and 3. Printers by the stairs.' },
{ x: 605, y: 110, name: 'Park gate', text: 'Picnic tables and a water fountain.' },
{ x: 460, y: 325, name: 'Cafe', text: 'Coffee from 8:00. Seats by the river.' },
];
const map = document.getElementById('map');
const popup = document.createElement('div');
popup.className = 'popup';
popup.id = 'popup';
popup.hidden = true;
popup.innerHTML = '<button class="x" aria-label="Close">×</button><b></b><span></span>';
places.forEach((p) => {
const pin = document.createElement('button');
pin.className = 'pin';
pin.style.left = (p.x / 800 * 100) + '%'; // SVG units -> percent of the map
pin.style.top = (p.y / 500 * 100) + '%';
pin.setAttribute('aria-label', p.name);
pin.setAttribute('aria-expanded', 'false');
pin.setAttribute('aria-controls', 'popup');
pin.append(document.getElementById('pin-svg').content.cloneNode(true));
pin.addEventListener('click', () => (pin.getAttribute('aria-expanded') === 'true' ? close() : open(pin, p)));
map.append(pin);
});
let current = null;
function open(pin, p) {
close();
current = pin;
popup.querySelector('b').textContent = p.name;
popup.querySelector('span').textContent = p.text;
pin.after(popup); // right after its pin, so Tab goes pin -> popup -> next pin
popup.hidden = false;
pin.setAttribute('aria-expanded', 'true');
place();
}
function close() {
if (!current) return;
popup.hidden = true;
current.setAttribute('aria-expanded', 'false');
current = null;
}
// Above the pin if there is room, otherwise below; never past the map's sides
function place() {
const m = map.getBoundingClientRect(), r = current.getBoundingClientRect();
const w = popup.offsetWidth, h = popup.offsetHeight;
const x = Math.max(4, Math.min(r.left + r.width / 2 - m.left - w / 2, m.width - w - 4));
let y = r.top - m.top - h - 6;
if (y < 4) y = r.bottom - m.top + 6;
popup.style.left = x + 'px';
popup.style.top = y + 'px';
}
popup.querySelector('.x').addEventListener('click', () => { const pin = current; close(); pin.focus(); });
document.addEventListener('keydown', (e) => {
if (e.key === 'Escape' && current) { const pin = current; close(); pin.focus(); }
});
// a click on the map itself (not a pin or the popup) closes it
map.addEventListener('click', (e) => { if (!e.target.closest('.pin, .popup')) close(); });
window.addEventListener('resize', () => { if (current) place(); });
</script>
</body>
</html>
This page is about maps you draw or already have as a picture: a campus, a venue, a trade show hall, an office floor plan.
For a real street map, embedding a Google map is the short route. For clickable areas on a photo, see HTML image maps.
The map: one SVG with a viewBox
The viewBox gives the drawing its own coordinate system. With a viewBox of 800 by 500, the point (240, 150) is always the same spot on the map, whatever size the SVG is drawn at.
<div class="map" style="position: relative">
  <svg viewBox="0 0 800 500" style="display: block; width: 100%; height: auto">
    <!-- rooms, roads, labels -->
  </svg>
  <!-- marker buttons go here -->
</div>
Two details matter. display: block removes the small gap under an inline SVG, so the wrapper is exactly as tall as the map.
In a 400 pixel wide test, the wrapper was 254 pixels tall without it and 250 with it, in Chromium, Firefox and WebKit.
Then height: auto keeps the 8 to 5 shape as the width changes. Scaling an SVG to fit covers the viewBox in more depth.
A bitmap works too. An <img> with width: 100% inside the same wrapper behaves the same way. Use the image's pixel size in place of the viewBox numbers.
Placing markers in percent
A marker's percent position is its map coordinate divided by the map size.
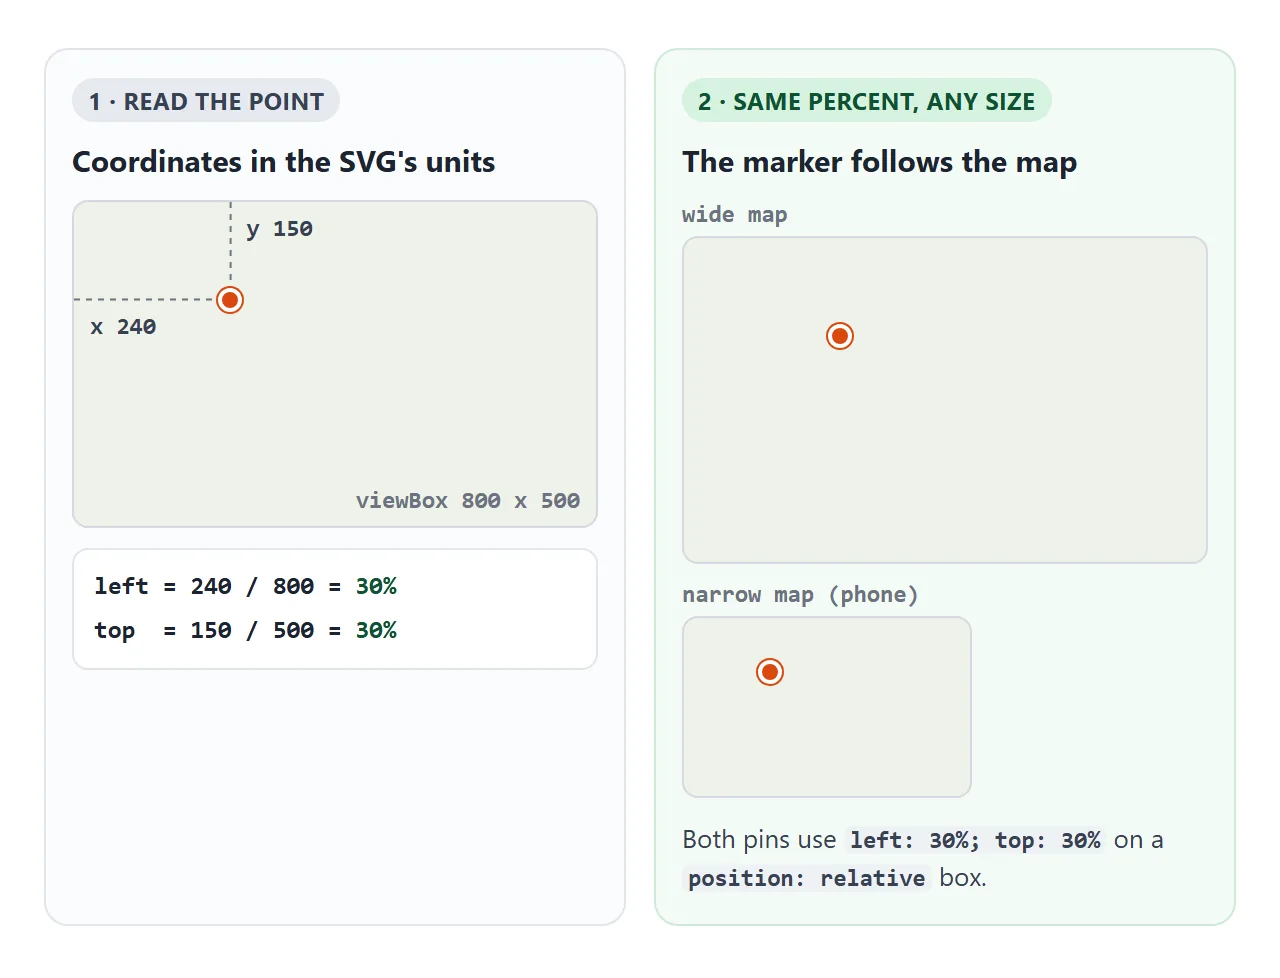
pin.style.left = (x / 800 * 100) + '%';
pin.style.top  = (y / 500 * 100) + '%';
Percent left and top on an absolutely positioned element are measured against the nearest positioned ancestor. That is the wrapper, which is why it needs position: relative. CSS position explains the rule.
Keep the places as data, one object per place, and create the buttons in a loop. Adding a place is then one more line in the array, not another block of HTML.
Put the tip of the pin on the point
left and top place the button's top-left corner. For a teardrop pin, that leaves the tip below and to the right of the place it marks.
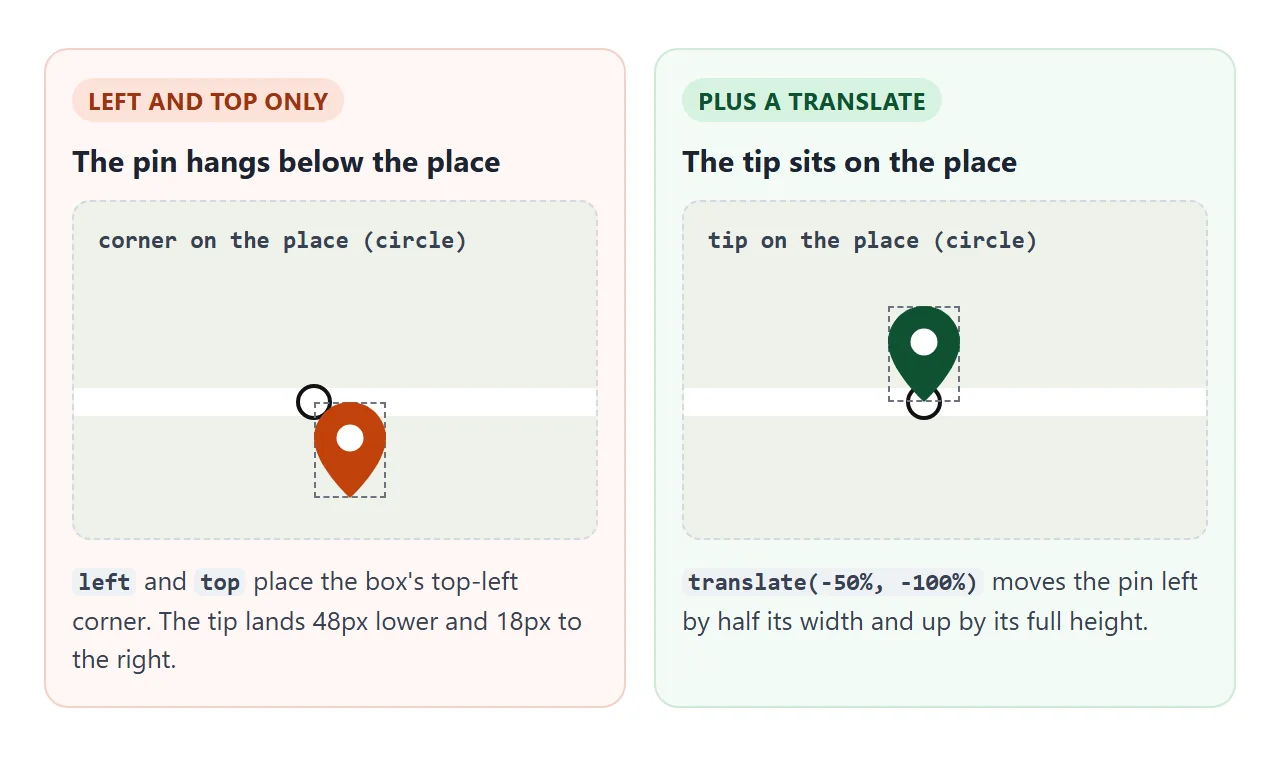
.pin {
  position: absolute;
  transform: translate(-50%, -100%);
}
Percentages in translate() refer to the element's own size. So the pin moves left by half its width and up by its full height, and the tip lands on the point. For a round dot marker, use translate(-50%, -50%) to centre it instead.
One popup, placed next to the pin
Each pin does not need its own popup. The examples keep a single popup element and fill it with the text of whichever pin was pressed. Then they measure both boxes and place the popup:
- Centre it horizontally over the pin, then clamp it so it never crosses the map's left or right edge.
- Put it above the pin. If there is no room above, put it below.
- Recalculate on
resize, because the pin moves when the map changes width.
const m = map.getBoundingClientRect();
const r = pin.getBoundingClientRect();
let x = r.left + r.width / 2 - m.left - popup.offsetWidth / 2;
x = Math.max(4, Math.min(x, m.width - popup.offsetWidth - 4));
let y = r.top - m.top - popup.offsetHeight - 6;
if (y < 4) y = r.bottom - m.top + 6;
The popover attribute is another way to show the box, and CSS anchor positioning can tie it to the pin without the measuring code. The measuring version above is shown because it is short and does not depend on either feature.
Keyboard and screen readers
Markers are buttons, so Tab, Enter and Space work without extra code. Four more things make the map usable without a mouse:
- A name on every pin. The pin is a picture, so add an aria-label with the place name.
- State on the pin.
aria-expanded="true"while its popup is open tells a screen reader the button opened something. - The popup right after its pin. Tab order follows the order of elements in the page, not their position on screen. Moving the popup with
pin.after(popup)puts its close button next in line. - Escape closes, and focus goes back. Return focus to the pin so the user continues from where they were.
Order the places from top to bottom in the data. Then Tab walks across the map in reading order rather than in the order you happened to add them. The tabindex guide explains why reordering with positive tabindex values causes more trouble than it solves.
Grouping markers that overlap
Put thirty cafes on a small map and the ones downtown pile up into a blob that no one can tap. The usual fix is clustering: markers that would be drawn close together are replaced by one bubble with a count.
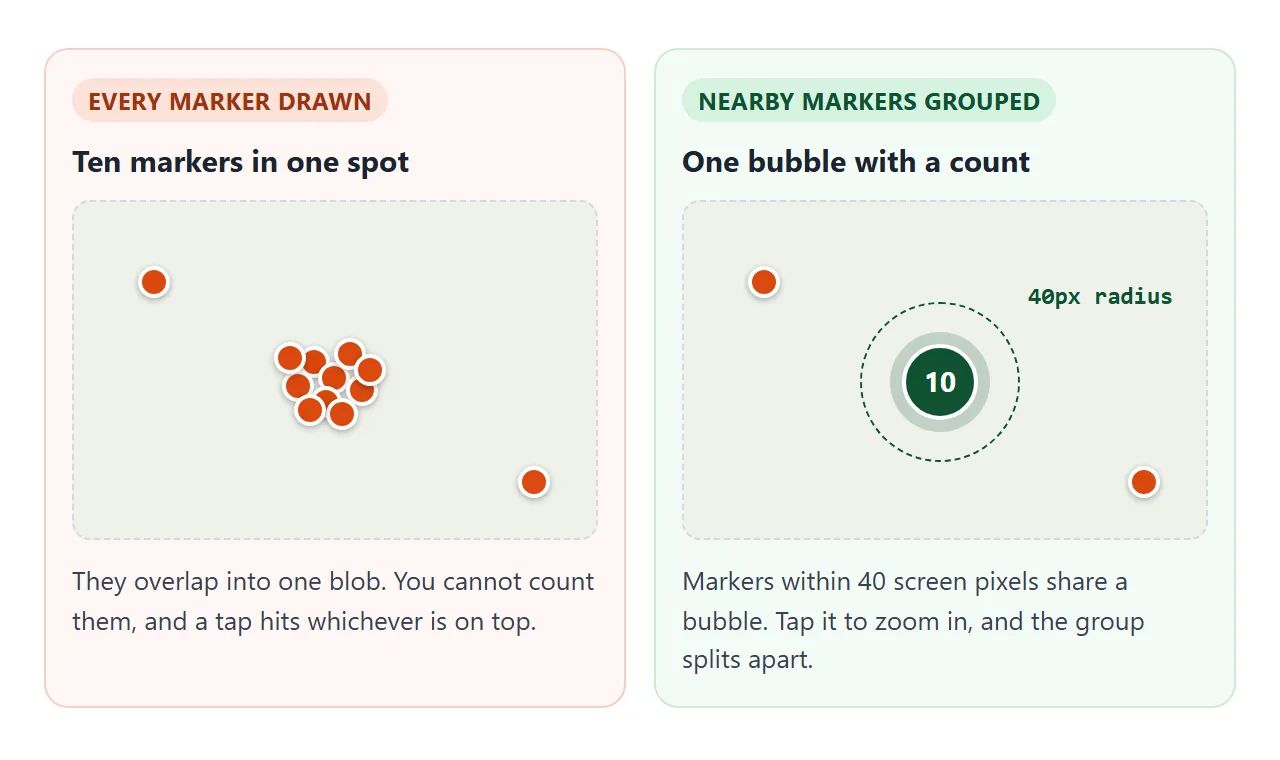
The grouping works in screen pixels, not map units, because overlap depends on how big the map is drawn. The same thirty points may need more bubbles on a phone than on a laptop. The example below:
- turns every place into a pixel position at the current size,
- takes each ungrouped marker in turn and pulls in every other ungrouped marker within 40 pixels,
- draws a group at the average position of its members,
- regroups whenever the map changes width, using a
ResizeObserver.
<!doctype html>
<html lang="en">
<head>
<meta charset="utf-8">
<meta name="viewport" content="width=device-width, initial-scale=1">
<title>Clustering nearby markers</title>
<style>
body { margin: 0; padding: 12px; font-family: system-ui, sans-serif; background: #f4f5f7; }
.bar { display: flex; flex-wrap: wrap; gap: 8px; align-items: center; margin-bottom: 8px; font-size: 13px; }
.bar button { font: inherit; padding: 4px 11px; border: 1px solid #c9cdd4; border-radius: 6px; background: #fff; cursor: pointer; }
#status { color: #5b6270; }
.view { max-width: 560px; overflow: hidden; border-radius: 10px; } /* scrolls when zoomed in */
.map { position: relative; width: 100%; } /* width grows with zoom */
.map > svg { display: block; width: 100%; height: auto; }
.m {
position: absolute; transform: translate(-50%, -50%);
border: 2px solid #fff; border-radius: 50%; cursor: pointer; padding: 0;
color: #fff; font: 700 13px system-ui, sans-serif;
}
.m.one { width: 18px; height: 18px; background: #d9480f; }
.m.group { width: 34px; height: 34px; background: #1d4ed8; box-shadow: 0 0 0 5px rgba(29, 78, 216, .25); }
.m:focus-visible { outline: 3px solid #111; outline-offset: 2px; }
</style>
</head>
<body>
<div class="bar">
<button id="out" aria-label="Zoom out">−</button>
<button id="in" aria-label="Zoom in">+</button>
<label><input type="checkbox" id="on" checked> Group nearby markers</label>
<span id="status" aria-live="polite"></span>
</div>
<div class="view" id="view" tabindex="0" aria-label="Map of cafes">
<div class="map" id="map">
<svg viewBox="0 0 800 500" aria-hidden="true">
<rect width="800" height="500" fill="#eef1ea"/>
<path d="M0 400 C160 360 280 450 440 410 S690 350 800 380 V500 H0Z" fill="#cfe3f5"/>
<rect x="470" y="50" width="270" height="170" rx="18" fill="#d4ebcf"/>
<g stroke="#fff" stroke-width="18" stroke-linecap="round" fill="none">
<path d="M20 260 H780"/><path d="M300 20 V370"/><path d="M620 260 V350"/>
</g>
<g fill="#d8dce2">
<rect x="60" y="60" width="180" height="150" rx="8"/><rect x="340" y="60" width="100" height="160" rx="8"/>
<rect x="60" y="290" width="200" height="70" rx="8"/><rect x="340" y="290" width="240" height="70" rx="8"/>
</g>
</svg>
</div>
</div>
<script>
// 30 cafes in SVG units (viewBox 0 0 800 500). Many sit close together downtown.
const cafes = [
[310,240],[322,252],[334,238],[318,270],[340,262],[352,248],[296,262],[328,284],[360,272],[344,226],
[150,120],[170,140],[160,100],[190,130],[640,100],[660,120],[700,160],[520,180],
[420,320],[440,330],[460,318],[480,336],[500,322],[90,320],[120,340],[220,320],
[720,300],[740,320],[600,300],[560,90],
];
const RADIUS = 40; // markers closer than this many screen pixels are grouped
let zoom = 1;
const view = document.getElementById('view');
const map = document.getElementById('map');
const status = document.getElementById('status');
const on = document.getElementById('on');
function render() {
map.querySelectorAll('.m').forEach((el) => el.remove());
const w = map.offsetWidth, h = map.offsetHeight;
// screen position of every cafe at the current size
const pts = cafes.map(([x, y]) => ({ x: x / 800 * w, y: y / 500 * h }));
// Greedy grouping: take a marker, pull in every free marker within RADIUS
const groups = [];
const used = new Array(pts.length).fill(false);
pts.forEach((p, i) => {
if (used[i]) return;
const g = [i];
used[i] = true;
if (on.checked) {
pts.forEach((q, j) => {
if (!used[j] && Math.hypot(p.x - q.x, p.y - q.y) < RADIUS) { g.push(j); used[j] = true; }
});
}
groups.push(g);
});
groups.forEach((g) => {
// place the group at the average of its members, in percent
const cx = g.reduce((s, i) => s + cafes[i][0], 0) / g.length;
const cy = g.reduce((s, i) => s + cafes[i][1], 0) / g.length;
const b = document.createElement('button');
b.className = 'm ' + (g.length > 1 ? 'group' : 'one');
b.style.left = (cx / 800 * 100) + '%';
b.style.top = (cy / 500 * 100) + '%';
if (g.length > 1) {
b.textContent = g.length;
b.setAttribute('aria-label', g.length + ' cafes here, zoom in');
b.addEventListener('click', () => { zoomTo(zoom * 2, cx, cy); view.focus(); });
} else {
b.setAttribute('aria-label', 'Cafe');
}
map.append(b);
});
status.textContent = `Zoom ${zoom}x: ${cafes.length} cafes, ${groups.length} markers`;
}
// Change zoom and keep the point (x, y in SVG units) in the middle of the view
function zoomTo(z, x = 400, y = 250) {
zoom = Math.min(Math.max(z, 1), 4);
map.style.width = zoom * 100 + '%';
view.style.overflow = zoom > 1 ? 'auto' : 'hidden';
render();
view.scrollLeft = x / 800 * map.offsetWidth - view.clientWidth / 2;
view.scrollTop = y / 500 * map.offsetHeight - view.clientHeight / 2;
}
// At zoom 1 the view is as tall as the map; zoomed in, it keeps that height and scrolls
function sizeView() { view.style.height = (view.offsetWidth * 500 / 800) + 'px'; }
function centre() { // the SVG point in the middle of the view right now
return [(view.scrollLeft + view.clientWidth / 2) / map.offsetWidth * 800,
(view.scrollTop + view.clientHeight / 2) / map.offsetHeight * 500];
}
document.getElementById('in').addEventListener('click', () => zoomTo(zoom * 2, ...centre()));
document.getElementById('out').addEventListener('click', () => zoomTo(zoom / 2, ...centre()));
on.addEventListener('change', render);
// regroup whenever the map's width changes (window resize, phone rotation)
new ResizeObserver(() => { sizeView(); render(); }).observe(view);
</script>
</body>
</html>
On the 680 pixel wide test frame, the thirty cafes showed as 13 markers at zoom 1. On a 366 pixel frame they showed as 9, because the points sit closer together on a smaller map.
This greedy grouping is simple, and it does not look for the best possible groups. Two bubbles can end up side by side. For a map like this one that is acceptable; map libraries offer clustering built for much larger sets of points.
A finished example: map, list and filters
A map on its own is hard to scan, especially with a screen reader. This version adds a list of the same places next to the map, and filters by type.
Picking a place in the list opens its popup on the map, and Escape sends focus back to the list.
<!doctype html>
<html lang="en">
<head>
<meta charset="utf-8">
<meta name="viewport" content="width=device-width, initial-scale=1">
<title>Place finder: map, list and filters</title>
<style>
body { margin: 0; padding: 12px; font-family: system-ui, sans-serif; background: #f4f5f7; color: #1d2330; }
.filters { display: flex; flex-wrap: wrap; gap: 6px 12px; margin-bottom: 8px; font-size: 13px; }
.wrap { display: grid; grid-template-columns: minmax(0, 1fr) 170px; gap: 10px; max-width: 680px; }
@media (max-width: 520px) { .wrap { grid-template-columns: 1fr; } }
.map { position: relative; align-self: start; }
.map > svg { display: block; width: 100%; height: auto; border-radius: 10px; }
.pin {
position: absolute; width: 26px; height: 34px; padding: 0; border: 0; background: none; cursor: pointer;
transform: translate(-50%, -100%);
}
.pin svg { display: block; width: 100%; height: 100%; fill: var(--c); }
.pin[aria-expanded="true"] svg { fill: #111; }
.pin:focus-visible, .list button:focus-visible { outline: 3px solid #1d4ed8; outline-offset: 2px; border-radius: 6px; }
.popup {
position: absolute; z-index: 2; width: 180px; padding: 10px 12px; background: #fff;
border-radius: 10px; box-shadow: 0 8px 24px rgba(0, 0, 0, .2); font-size: 13px; line-height: 1.4;
}
.popup b { display: block; font-size: 14px; padding-right: 20px; }
.popup .x { position: absolute; right: 6px; top: 6px; border: 0; background: none; font-size: 16px; cursor: pointer; }
.list { list-style: none; margin: 0; padding: 0; display: grid; gap: 4px; align-content: start; }
@media (max-width: 520px) { .list { grid-template-columns: 1fr 1fr; } }
.list button {
width: 100%; text-align: left; font: inherit; font-size: 13px; padding: 6px 8px;
border: 1px solid #dfe3e8; border-radius: 6px; background: #fff; cursor: pointer;
}
.list button[aria-pressed="true"] { border-color: #111; background: #eef1f5; }
.dot { display: inline-block; width: 9px; height: 9px; border-radius: 50%; margin-right: 6px; background: var(--c); }
.cafe { --c: #d9480f; } .study { --c: #1d4ed8; } .green { --c: #2f9e44; }
</style>
</head>
<body>
<div class="filters" id="filters">
<label><input type="checkbox" value="cafe" checked> <span class="dot cafe"></span>Cafes</label>
<label><input type="checkbox" value="study" checked> <span class="dot study"></span>Study spaces</label>
<label><input type="checkbox" value="green" checked> <span class="dot green"></span>Green spaces</label>
</div>
<div class="wrap">
<div class="map" id="map">
<svg viewBox="0 0 800 500" role="img" aria-label="Campus map. The same places are listed next to it.">
<rect width="800" height="500" fill="#eef1ea"/>
<path d="M0 400 C160 360 280 450 440 410 S690 350 800 380 V500 H0Z" fill="#cfe3f5"/>
<rect x="470" y="50" width="270" height="170" rx="18" fill="#d4ebcf"/>
<g stroke="#fff" stroke-width="18" stroke-linecap="round" fill="none">
<path d="M20 260 H780"/><path d="M300 20 V370"/><path d="M620 260 V350"/>
</g>
<g fill="#d8dce2">
<rect x="60" y="60" width="180" height="150" rx="8"/><rect x="340" y="60" width="100" height="160" rx="8"/>
<rect x="60" y="290" width="200" height="70" rx="8"/><rect x="340" y="290" width="240" height="70" rx="8"/>
</g>
</svg>
</div>
<ul class="list" id="list" aria-label="Places"></ul>
</div>
<script>
// x, y in SVG units (viewBox 0 0 800 500). Sorted top to bottom so Tab reads the map in order.
const places = [
{ x: 605, y: 105, type: 'green', name: 'Park gate', text: 'Picnic tables, water fountain.' },
{ x: 390, y: 120, type: 'study', name: 'Library', text: 'Quiet floors 2 and 3.' },
{ x: 150, y: 140, type: 'cafe', name: 'Hall Coffee', text: 'Ground floor, main hall. From 8:00.' },
{ x: 700, y: 180, type: 'green', name: 'Rose garden', text: 'Benches in the shade.' },
{ x: 200, y: 180, type: 'study', name: 'Reading room', text: 'Open late on weekdays.' },
{ x: 460, y: 325, type: 'cafe', name: 'River Cafe', text: 'Seats by the water.' },
{ x: 160, y: 330, type: 'study', name: 'Lab commons', text: 'Group tables, whiteboards.' },
{ x: 690, y: 330, type: 'cafe', name: 'Dock Kiosk', text: 'Takeaway only.' },
].sort((a, b) => a.y - b.y || a.x - b.x);
const map = document.getElementById('map');
const list = document.getElementById('list');
const popup = document.createElement('div');
popup.className = 'popup';
popup.id = 'popup';
popup.innerHTML = '<button class="x" aria-label="Close">×</button><b></b><span></span>';
let current = null; // the open place
let opener = null; // the pin or list button that opened it, for Esc
const pinSvg = '<svg viewBox="0 0 24 32" aria-hidden="true"><path d="M12 0C5.4 0 0 5.4 0 12c0 9 12 20 12 20s12-11 12-20C24 5.4 18.6 0 12 0z"/><circle cx="12" cy="12" r="4.5" fill="#fff"/></svg>';
places.forEach((p) => {
p.pin = document.createElement('button');
p.pin.className = 'pin ' + p.type;
p.pin.style.left = (p.x / 800 * 100) + '%';
p.pin.style.top = (p.y / 500 * 100) + '%';
p.pin.innerHTML = pinSvg;
p.pin.setAttribute('aria-label', p.name);
p.pin.setAttribute('aria-expanded', 'false');
p.pin.addEventListener('click', () => (current === p ? close() : open(p)));
map.append(p.pin);
// the same place in the list: a second way in, easier to scan with a screen reader
const li = document.createElement('li');
p.item = document.createElement('button');
p.item.innerHTML = `<span class="dot ${p.type}"></span>${p.name}`;
p.item.setAttribute('aria-pressed', 'false');
p.item.addEventListener('click', () => (current === p ? close() : open(p)));
li.append(p.item);
list.append(li);
});
function open(p) {
close();
current = p;
opener = document.activeElement.closest('button') || p.pin;
popup.querySelector('b').textContent = p.name;
popup.querySelector('span').textContent = p.text;
p.pin.after(popup);
p.pin.setAttribute('aria-expanded', 'true');
p.item.setAttribute('aria-pressed', 'true');
place();
}
function close() {
if (!current) return;
popup.remove();
current.pin.setAttribute('aria-expanded', 'false');
current.item.setAttribute('aria-pressed', 'false');
current = null;
}
function place() {
const m = map.getBoundingClientRect(), r = current.pin.getBoundingClientRect();
const w = popup.offsetWidth, h = popup.offsetHeight;
const x = Math.max(4, Math.min(r.left + r.width / 2 - m.left - w / 2, m.width - w - 4));
let y = r.top - m.top - h - 6;
if (y < 4) y = r.bottom - m.top + 6;
popup.style.left = x + 'px';
popup.style.top = y + 'px';
}
// Filters hide both the pin and its list entry
document.getElementById('filters').addEventListener('change', () => {
const shown = [...document.querySelectorAll('#filters input:checked')].map((i) => i.value);
places.forEach((p) => {
const hide = !shown.includes(p.type);
p.pin.hidden = hide;
p.item.parentElement.hidden = hide;
if (hide && current === p) close();
});
});
// Closing from the keyboard puts focus back where the user was
popup.querySelector('.x').addEventListener('click', () => { close(); opener.focus(); });
document.addEventListener('keydown', (e) => {
if (e.key === 'Escape' && current) { close(); opener.focus(); }
});
map.addEventListener('click', (e) => { if (!e.target.closest('.pin, .popup')) close(); });
window.addEventListener('resize', () => { if (current) place(); });
</script>
</body>
</html>
| Piece | What it does | Where in the code |
|---|---|---|
| Places array | One object per place, sorted top to bottom | places |
| Pin buttons | Percent position, aria-label, aria-expanded | p.pin |
| List buttons | A second way to open each place | p.item |
| Filters | Hide pin and list entry together | change listener |
| Popup | One element, moved after the open pin | open(), place() |
If the map is a floor plan that already exists as a PDF or a drawing, export it to SVG first. Uploading a floor plan covers keeping its measurements readable.
When it does not work
| What you see | Cause | Fix |
|---|---|---|
| Markers drift away from their places on a phone | Positions in pixels | Use percent for left and top |
| All markers sit in the top-left corner | The wrapper is not positioned | position: relative on the wrapper |
| Markers sit slightly too low | A gap under the inline SVG makes the box taller than the map | display: block on the SVG |
| The pin hangs below the point | Only left and top are set |
Add translate(-50%, -100%) |
| The popup is cut off at the edge | It is centred on the pin without a limit | Clamp x between the map's edges |
| An open popup covers the next pin | Popups sit above the pins | Close on Escape or on a click on the map |
| Tab skips the popup | The popup is at the end of the page | Insert it right after the pin |
Share it as a link
A map is something people want to click, and a screenshot cannot open a popup. An .html file sent as an attachment may show up as code, or not open at all, on a phone. Opening an HTML file on a phone explains why.
To send the working map, paste the page into a NOS document and choose Create share link. HTML to link walks through it.
The page renders as written and its scripts run, so the people you send it to can open the pins and filter the list themselves. If you move a marker or add a place later, the same link shows the new version.