Folium is a Python library for making interactive maps, and m.save("map.html") exports one as a single HTML file. Open it in a browser, or paste it into a NOS document to share it as a link. Here "folium" means that Python library.
Try the smallest version first. This map is hand-written HTML of the same kind folium writes. Drag it, zoom it, and tap the dot.
<!doctype html>
<html lang="en">
<head>
<meta charset="utf-8">
<meta name="viewport" content="width=device-width, initial-scale=1">
<title>Single-file Leaflet map</title>
<!-- CSS first, then the script: the same order a folium export uses -->
<link rel="stylesheet" href="https://cdn.jsdelivr.net/npm/leaflet@1.9.3/dist/leaflet.css">
<style>
  html, body { height: 100%; margin: 0; font-family: system-ui, sans-serif; }
  body { display: flex; flex-direction: column; }
  #info { padding: 8px 12px; font-size: 14px; background: #f4f5f7; border-bottom: 1px solid #e1e4ea; }
  #map { flex: 1; min-height: 0; background: #e6edf3; }  /* the div needs a height */
</style>
</head>
<body>
<div id="info">Drag the map, scroll or pinch to zoom, tap the dot.</div>
<div id="map"></div>

<script src="https://cdn.jsdelivr.net/npm/leaflet@1.9.3/dist/leaflet.js"></script>
<script>
  // folium.Map(location=(45.5236, -122.6750), zoom_start=13) writes a call like this
  const map = L.map('map', { attributionControl: false }).setView([45.5236, -122.6750], 13);

  // Shapes are drawn by Leaflet in the page, so they need no image files
  L.polygon([[45.531, -122.690], [45.531, -122.664], [45.517, -122.664], [45.517, -122.690]],
    { color: '#15803d', weight: 2, fillOpacity: 0.15 }).addTo(map);

  L.circleMarker([45.5236, -122.6750], { radius: 11, color: '#1d4ed8', fillOpacity: 0.85 })
    .addTo(map)
    .bindPopup('<b>Hello</b><br>A popup, like folium popup=')
    .openPopup();

  const info = document.getElementById('info');
  map.on('moveend', () => {
    const c = map.getCenter();
    info.textContent = 'Zoom ' + map.getZoom() + ' - centre ' + c.lat.toFixed(4) + ', ' + c.lng.toFixed(4);
  });
</script>
</body>
</html>
It has no street pictures on purpose. The section on tiles below explains why.
Export the map from Python
Three lines of Python make a map, and one more writes the file.
import folium

m = folium.Map(location=(45.5236, -122.6750), zoom_start=13)
folium.Marker((45.5236, -122.6750), popup="Hello").add_to(m)
m.save("map.html")
location is latitude first, then longitude. zoom_start sets the first zoom level. save writes the HTML, encoded as UTF-8, to the file name you pass.
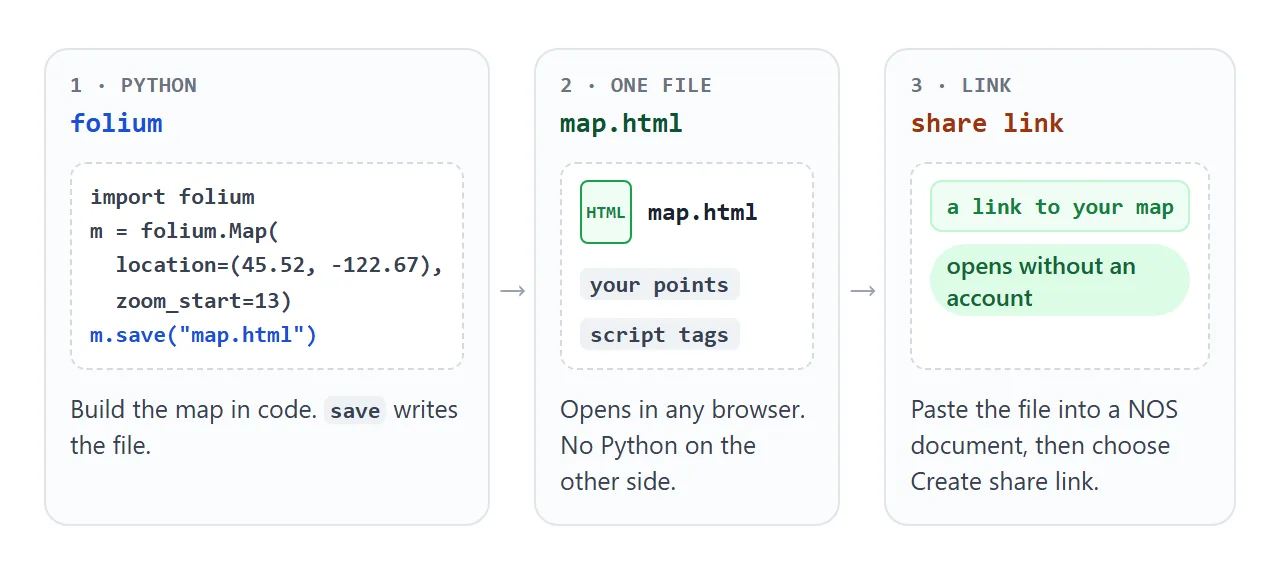
In a notebook, a cell that ends with m shows the map but writes nothing. Only save makes a file. The Jupyter notebook guide covers sharing the notebook itself.
What is inside the saved file
The file holds your map and your points. It does not hold the libraries. It refers to them by link: Leaflet and Bootstrap from cdn.jsdelivr.net, jQuery from code.jquery.com, and the pin script from cdnjs.cloudflare.com.
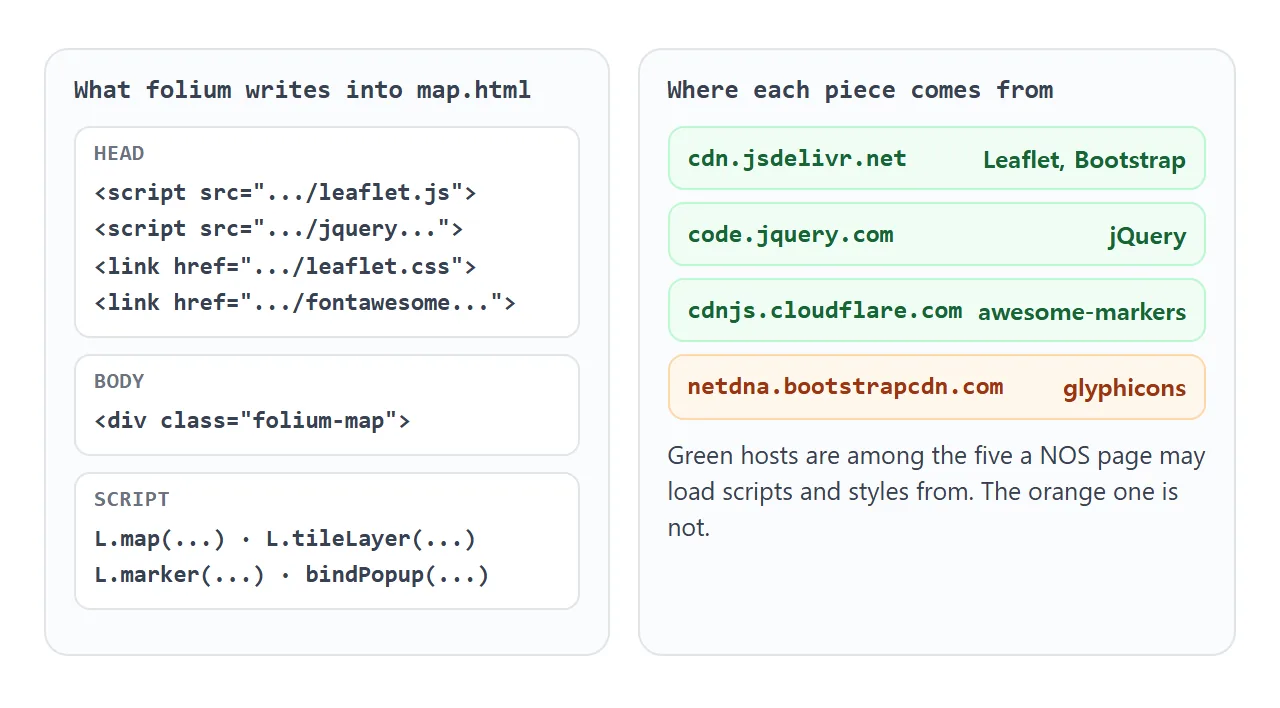
So the file draws nothing offline. Folium 0.20.0 links Leaflet 1.9.3, and the demos on this page link the same version.
The page also carries a viewport meta tag and sets html and body to full width and height. Its script sits after the closing body tag, and browsers still run it.
One stylesheet on folium's list comes from netdna.bootstrapcdn.com. NOS loads scripts and styles from five hosts: cdn.jsdelivr.net, cdnjs.cloudflare.com, cdn.tailwindcss.com, code.jquery.com and unpkg.com. That one is not on the list. It supplies the small icon glyph inside the default pin.
The same map in a few lines of HTML
Leaflet does the drawing, and the folium file is a wrapper around it. The hand-written version is short:
<link rel="stylesheet" href="https://cdn.jsdelivr.net/npm/leaflet@1.9.3/dist/leaflet.css">
<div id="map" style="height: 320px"></div>
<script src="https://cdn.jsdelivr.net/npm/leaflet@1.9.3/dist/leaflet.js"></script>
<script>
  const map = L.map('map').setView([45.5236, -122.6750], 13);
  L.circleMarker([45.5236, -122.6750]).addTo(map).bindPopup('Hello');
</script>
The stylesheet comes first, and your script comes after the Leaflet script. Put your code above the Leaflet script and the console reports L is not defined.
Writing it by hand pays off when you want to change one thing the Python call makes awkward. For markers without any map library, see map markers in HTML.
Tiles are pictures
A normal folium map draws its streets from tiles: small image files fetched from a tile server to fill the map. The default tileset is OpenStreetMap. Opening a folium-style page in a test made image requests to tile.openstreetmap.org.
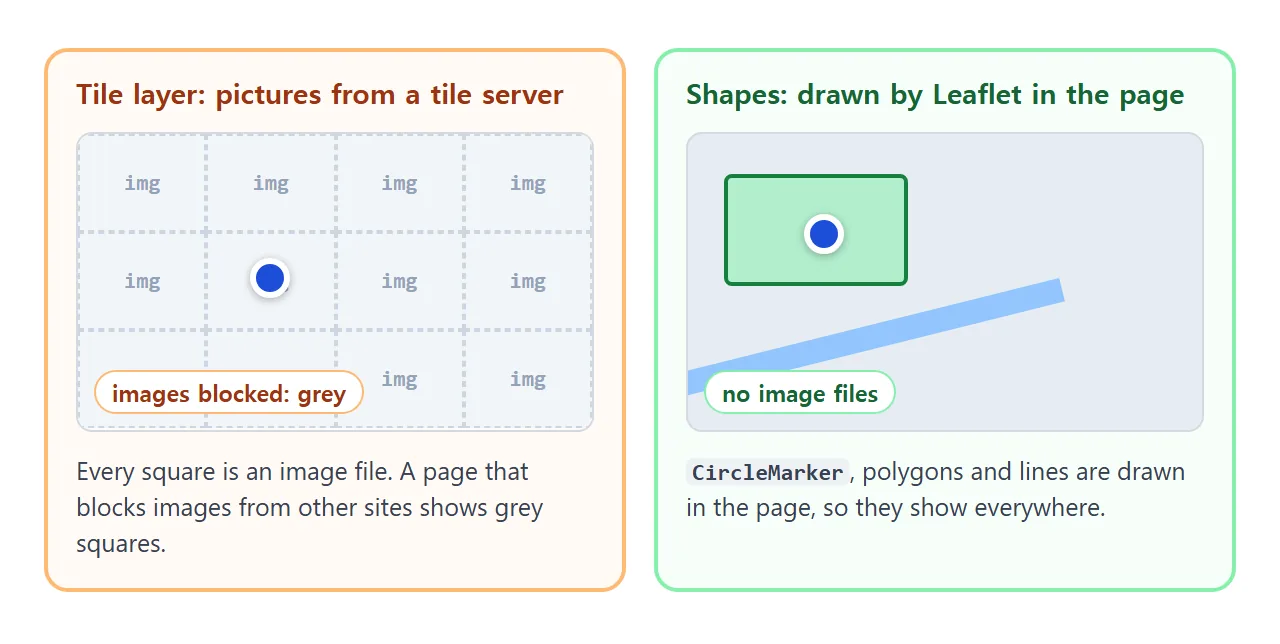
A page that blocks images from other sites, as shared NOS pages do, leaves grey where the tiles would be. Everything Leaflet draws itself still shows.
The default pin is a picture too: its stylesheet points at a file named markers-soft.png. Do not count on it showing in such a page.
Folium has a way out. Pass None as the tiles and the map is made without tiles. A CircleMarker is drawn by the page, with its radius in pixels.
m = folium.Map(location=(45.5236, -122.6750), zoom_start=13, tiles=None)
folium.CircleMarker((45.5236, -122.6750), radius=10, popup="Hello").add_to(m)
When you do keep tiles, keep the attribution. The OpenStreetMap tile policy asks you to show the licence attribution clearly on the map.
The map div needs a height
Leaflet draws into a div, and that div needs a height. Its quick start says to make sure the container has a defined height.
A folium page sets html and body to full height. Copy only the map div and script into another page and the div can collapse.
<!doctype html>
<html lang="en">
<head>
<meta charset="utf-8">
<meta name="viewport" content="width=device-width, initial-scale=1">
<title>Map container height</title>
<link rel="stylesheet" href="https://cdn.jsdelivr.net/npm/leaflet@1.9.3/dist/leaflet.css">
<style>
  body { margin: 0; padding: 12px; font-family: system-ui, sans-serif; background: #fff; color: #1d2330; }
  h2 { font-size: 14px; margin: 0 0 6px; }
  .box { border: 2px solid; border-radius: 8px; margin-bottom: 12px; overflow: hidden; }
  .bad { border-color: #ea580c; }
  .good { border-color: #16a34a; }
  .box h2 { padding: 8px 10px; margin: 0; background: #f8fafc; }
  .map { background: #e6edf3; }
  #bad { }               /* no height: the div collapses to 0 */
  #good { height: 110px; }
  button { font: inherit; padding: 6px 12px; border-radius: 8px; border: 1px solid #94a3b8; background: #fff; cursor: pointer; }
  #note { font-size: 13px; margin-left: 8px; }
</style>
</head>
<body>
<div class="box bad">
  <h2>Without a height: <span id="badH"></span></h2>
  <div id="bad" class="map"></div>
</div>
<div class="box good">
  <h2>With height: 110px: <span id="goodH"></span></h2>
  <div id="good" class="map"></div>
</div>
<button id="fix" type="button">Give the first map a height</button><span id="note"></span>

<script src="https://cdn.jsdelivr.net/npm/leaflet@1.9.3/dist/leaflet.js"></script>
<script>
  function make(id) {
    const m = L.map(id, { attributionControl: false }).setView([45.5236, -122.675], 13);
    L.circleMarker([45.5236, -122.675], { radius: 10 }).addTo(m);
    return m;
  }
  const badMap = make('bad');    // no error is raised, the map is just 0 px tall
  const goodMap = make('good');

  function report() {
    document.getElementById('badH').textContent = document.getElementById('bad').offsetHeight + ' px tall';
    document.getElementById('goodH').textContent = document.getElementById('good').offsetHeight + ' px tall';
  }
  report();

  document.getElementById('fix').addEventListener('click', () => {
    document.getElementById('bad').style.height = '110px';
    badMap.invalidateSize();  // tell Leaflet the container size changed
    report();
    document.getElementById('note').textContent = 'Fixed.';
  });
</script>
</body>
</html>
No error appears when a map is 0 px tall. It is simply invisible. If you change the size after the map was drawn, call invalidateSize() so Leaflet checks the container again.
A finished page: points from a list
Real maps come from data. In this page each row of a list becomes a circle marker with a popup, and the map zooms to fit them all.
<!doctype html>
<html lang="en">
<head>
<meta charset="utf-8">
<meta name="viewport" content="width=device-width, initial-scale=1">
<title>Places map</title>
<link rel="stylesheet" href="https://cdn.jsdelivr.net/npm/leaflet@1.9.3/dist/leaflet.css">
<style>
  body { margin: 0; padding: 10px; font-family: system-ui, sans-serif; color: #1d2330; background: #fff; }
  .filters { display: flex; flex-wrap: wrap; gap: 14px; margin-bottom: 8px; font-size: 14px; }
  .filters label { display: inline-flex; align-items: center; gap: 6px; cursor: pointer; }
  .dot { width: 12px; height: 12px; border-radius: 50%; display: inline-block; }
  #map { height: 300px; border-radius: 10px; background: #e6edf3; border: 1px solid #cbd5e1; }
  #list { display: flex; flex-wrap: wrap; gap: 6px; margin-top: 8px; padding: 0; list-style: none; }
  #list button { font: inherit; font-size: 13px; padding: 5px 10px; border-radius: 999px; border: 1px solid #cbd5e1; background: #fff; cursor: pointer; }
  #list button:hover { background: #f1f5f9; }
  #count { font-size: 13px; color: #475569; margin-top: 6px; }
</style>
</head>
<body>
<div class="filters" id="filters"></div>
<div id="map"></div>
<ul id="list"></ul>
<div id="count"></div>

<script src="https://cdn.jsdelivr.net/npm/leaflet@1.9.3/dist/leaflet.js"></script>
<script>
  // Sample data: one row per place, like a pandas DataFrame
  const places = [
    { name: 'Corner Cafe',   type: 'Cafe', ll: [45.5231, -122.6765] },
    { name: 'Bridge Coffee', type: 'Cafe', ll: [45.5189, -122.6682] },
    { name: 'Late Bean',     type: 'Cafe', ll: [45.5274, -122.6841] },
    { name: 'Elm Park',      type: 'Park', ll: [45.5261, -122.6702] },
    { name: 'River Green',   type: 'Park', ll: [45.5205, -122.6805] },
    { name: 'Book Nook',     type: 'Shop', ll: [45.5242, -122.6893] },
    { name: 'Bike Barn',     type: 'Shop', ll: [45.5178, -122.6738] },
    { name: 'Toy Box',       type: 'Shop', ll: [45.5296, -122.6746] }
  ];
  const colors = { Cafe: '#c2410c', Park: '#15803d', Shop: '#1d4ed8' };

  const map = L.map('map', { attributionControl: false });

  // Background context drawn as shapes: a river and two green areas
  L.polyline([[45.5330, -122.6900], [45.5240, -122.6780], [45.5190, -122.6700], [45.5150, -122.6640]],
    { color: '#93c5fd', weight: 10, opacity: 0.8 }).addTo(map);
  L.polygon([[45.5275, -122.6730], [45.5275, -122.6675], [45.5247, -122.6675], [45.5247, -122.6730]],
    { stroke: false, fillColor: '#86efac', fillOpacity: 0.5 }).addTo(map);
  L.polygon([[45.5222, -122.6830], [45.5222, -122.6780], [45.5188, -122.6780], [45.5188, -122.6830]],
    { stroke: false, fillColor: '#86efac', fillOpacity: 0.5 }).addTo(map);

  const list = document.getElementById('list');
  const box = document.getElementById('filters');
  const count = document.getElementById('count');
  const shown = { Cafe: true, Park: true, Shop: true };

  places.forEach((p) => {
    p.marker = L.circleMarker(p.ll, {
      radius: 10, color: '#fff', weight: 2, fillColor: colors[p.type], fillOpacity: 0.95
    }).bindPopup('<b>' + p.name + '</b><br>' + p.type);
    const li = document.createElement('li');
    const b = document.createElement('button');
    b.type = 'button';
    b.textContent = p.name;
    b.addEventListener('click', () => {
      map.flyTo(p.ll, 15, { duration: 0.6 });
      p.marker.openPopup();
    });
    li.appendChild(b);
    list.appendChild(li);
    p.li = li;
  });

  Object.keys(colors).forEach((type) => {
    const label = document.createElement('label');
    const cb = document.createElement('input');
    cb.type = 'checkbox';
    cb.checked = true;
    cb.addEventListener('change', () => { shown[type] = cb.checked; refresh(true); });
    const dot = document.createElement('span');
    dot.className = 'dot';
    dot.style.background = colors[type];
    label.append(cb, dot, type);
    box.appendChild(label);
  });

  function refresh(refit) {
    const visible = [];
    places.forEach((p) => {
      const on = shown[p.type];
      p.li.hidden = !on;
      if (on) { p.marker.addTo(map); visible.push(p.marker); } else { p.marker.remove(); }
    });
    count.textContent = visible.length + ' of ' + places.length + ' places shown';
    if (refit && visible.length) map.fitBounds(L.featureGroup(visible).getBounds(), { padding: [30, 30] });
  }

  map.fitBounds(L.latLngBounds(places.map((p) => p.ll)), { padding: [30, 30] });
  refresh(false);
</script>
</body>
</html>
- Data: one object per place, like the rows you would loop over in Python.
- Markers: a
circleMarkerper row, coloured by type, withbindPopup. - Fit:
fitBoundszooms to the places that are shown. - Controls: the checkboxes and name buttons are plain HTML added around the map.
The Python version of the loop is short:
for name, lat, lng in places:
    folium.CircleMarker((lat, lng), radius=9, popup=name).add_to(m)
When it does not work
| What you see | Cause | Fix |
|---|---|---|
| Blank page, nothing draws | Libraries are linked from CDNs and the device is offline | Open it with a connection |
| Grey background, markers show | Tile images are blocked | tiles=None, shapes for context |
| Pin or its icon is missing | The default pin is an image plus an icon font | Use CircleMarker |
| Map area is empty | The map div has no height | Give the div a height |
| Map opens in the wrong place | Longitude and latitude swapped | Latitude first |
| Notebook shows a map, no file | Display is not saving | m.save("map.html") |
L is not defined |
Your script runs before Leaflet loads | Put it after the Leaflet script |
| Phone shows code or nothing | An HTML attachment may not open | Send a link |
Share it as a link
An exported map is made to be dragged and zoomed, and a screenshot cannot do either. Sent as an attachment, the .html file may open as plain code, or not at all, on a phone. Opening an HTML file on a phone explains why.
For another export that goes the same way, see sharing a Plotly export.
To send the working map, paste the page into a NOS document and choose Create share link. HTML to link walks through it.
The page renders as written and its scripts run, so people can drag and zoom the map themselves. Anyone with the link can open it without an account. If you change the code later, the same link shows the new version.