SVG in HTML means writing a drawing directly into the page as an <svg> element, so the browser draws it from markup rather than displaying a picture file.
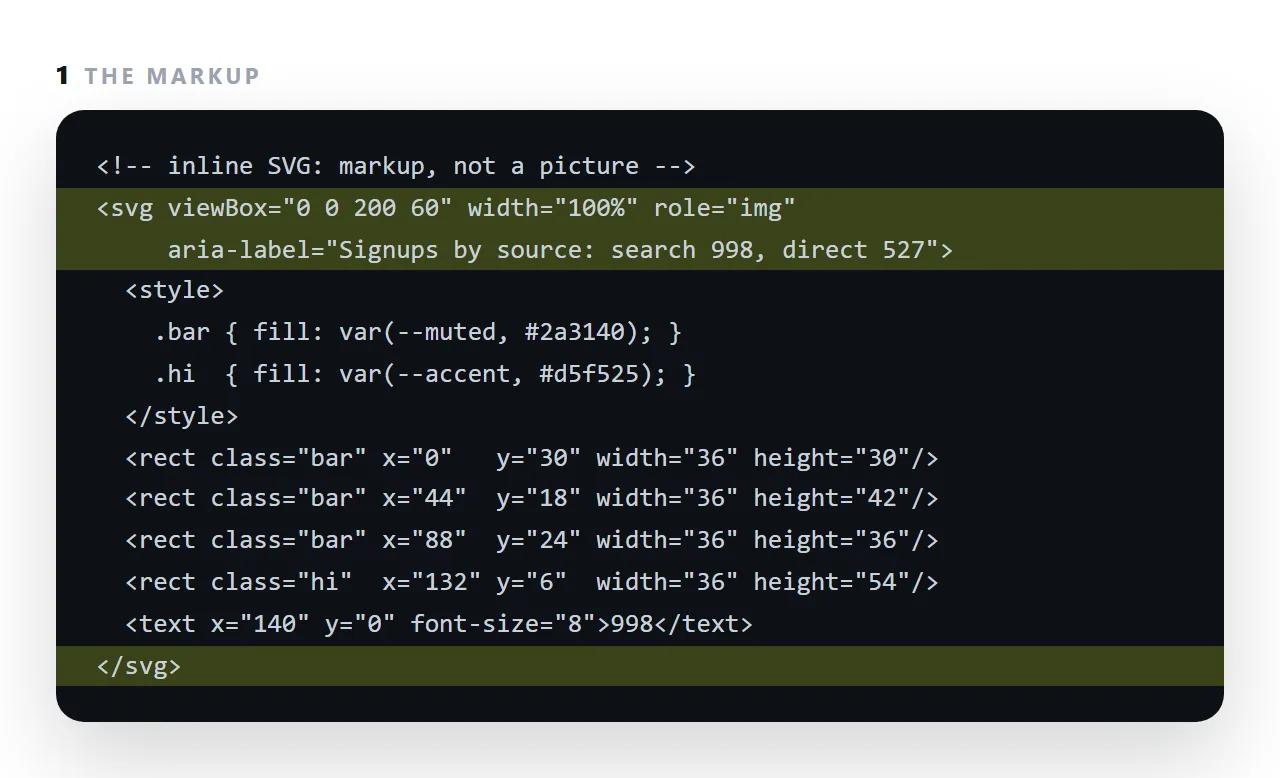
Every diagram on this site is inline SVG for four reasons: it stays sharp at any zoom, its colours can come from CSS variables and so follow dark mode, its text is text for screen readers and search, and it is embedded by definition, so it cannot go missing when the file is sent.
This guide covers why inline for diagrams, why viewBox is the attribute that matters, labelling, and when a raster image is still right.
<svg viewBox="0 0 100 100" xmlns="http://www.w3.org/2000/svg">
  <circle cx="50" cy="50" r="40" fill="none" stroke="currentColor" stroke-width="8"/>
</svg>
That is a ring. It is text, it is in your document, and it will be sharp on any screen at any zoom.
Why inline SVG in HTML for diagrams
| Inline SVG | PNG file | Base64 PNG | |
|---|---|---|---|
| Extra request | No | Yes | No |
| Sharp when zoomed | Yes | No | No |
| Colours from CSS | Yes | No | No |
| Follows dark mode | Yes | No | No |
| Size for a diagram | Small | Medium | Large |
| Text inside is searchable | Yes | No | No |
| Good for photographs | No | Yes | Acceptable |
The third and fourth rows are the ones that matter most in practice. A PNG diagram stays light-themed when the page goes dark, which looks like a mistake. An SVG whose strokes use CSS variables simply follows.
Every diagram on this site is inline SVG for that reason.
viewBox is the important attribute
<!-- scales to its container -->
<svg viewBox="0 0 720 200" xmlns="http://www.w3.org/2000/svg">

<!-- locked to one size -->
<svg width="720" height="200">
viewBox="0 0 720 200" sets an internal coordinate space 720 by 200. Everything inside is drawn in those units, and the whole thing scales to fit its container — so one piece of markup works at 360px and at 1400px.
Adding fixed width and height attributes defeats that. Size it with CSS instead:
svg { display: block; width: 100%; height: auto; }
Colours from CSS
<svg viewBox="0 0 200 40">
  <rect width="140" height="20" fill="var(--accent)"/>
  <line x1="0" y1="34" x2="200" y2="34" stroke="var(--line)" stroke-width="1.5"/>
</svg>
var() works inside SVG attributes. So does currentColor, which takes the element's text colour — useful for icons that should match surrounding text without any extra rules.
Writing a diagram by hand
Five elements cover most of it:
<svg viewBox="0 0 400 120" xmlns="http://www.w3.org/2000/svg">
  <!-- box -->
  <rect x="10" y="30" width="150" height="60" rx="10"
        fill="var(--bg-hover)" stroke="var(--line)" stroke-width="1.5"/>

  <!-- centred label -->
  <text x="85" y="66" text-anchor="middle" font-size="14" fill="var(--fg)">Source</text>

  <!-- arrow -->
  <defs>
    <marker id="ah" viewBox="0 0 10 10" refX="9" refY="5"
            markerWidth="7" markerHeight="7" orient="auto">
      <path d="M0 0 L10 5 L0 10 z" fill="var(--line)"/>
    </marker>
  </defs>
  <line x1="165" y1="60" x2="230" y2="60" stroke="var(--line)"
        stroke-width="1.5" marker-end="url(#ah)"/>
</svg>
Two details that catch people. text-anchor="middle" centres text on its x coordinate — without it, x is the left edge and every label sits off to one side. And the y of a text element is its baseline, not its top, so vertical centring is roughly middle + font-size / 3.
Accessibility
<figure role="group" aria-label="Signups by source: search 998, direct 527, referrals 176">
  <svg viewBox="0 0 720 160" aria-hidden="true">…</svg>
  <figcaption>Signups by source, week of 7 Sep. Total 2,119.</figcaption>
</figure>
The label carries the actual values, because a screen reader can do nothing with the shapes. Mark the SVG itself aria-hidden so its contents are not read out as a stream of coordinates.
The id collision trap
Markers, gradients and clip paths are referenced by id, and ids are global to the page. Two SVGs both defining #ah means the second silently uses the first one's definition — usually invisible, occasionally baffling. Prefix ids per diagram if you have several on a page.
When to reach for which
| Content | Use | Why |
|---|---|---|
| Diagram, flow, chart | Inline SVG | Scales, follows CSS colours, no request |
| Icon | Inline SVG | Same, and currentColor matches surrounding text |
| Logo | Inline SVG, or a file if reused across pages | Sharp at every size |
| Screenshot | PNG or WebP | Pixels, not shapes |
| Photograph | WebP or JPEG | Same |
| Anything needing dark mode | Inline SVG | A fixed image cannot follow |
That last row is the decisive one in practice. A PNG diagram stays light-themed while the page goes dark, and there is no fix short of shipping two images — see dark mode CSS.
Three traps
id collisions. Markers, gradients and clip paths are referenced by id, and ids are global to the page. Two diagrams both defining #arrow means the second silently uses the first one's definition. Prefix per diagram.
Text baselines. The y of a <text> element is its baseline, not its top. Vertical centring is roughly middle + font-size / 3, which is why hand-written labels often sit slightly high.
Fixed dimensions. width and height attributes lock the SVG to one size and defeat the viewBox. Size it in CSS instead, and add max-width: 100% so it cannot overflow on a phone — the same rule that prevents most mobile overflow.
Inline, as an image, or as a data URI
The same drawing can arrive three ways. Inline in the HTML, it can be styled by the page's CSS and read by a screen reader, and it is part of the file.
In an <img src="chart.svg">, it is a separate file that can be cached and reused across pages, but the page's CSS cannot reach inside it and it goes missing if the file does not travel.
As a data URI in an img, it travels with the page but is still sealed off from the page's styles.
For a diagram in a document that will be sent, inline wins; for an icon used on fifty pages of a site, a file wins.
Keeping inline SVG small
Drawing tools export SVG with editor metadata, absolute coordinates to six decimal places, and a class per shape. Run the export through an optimiser and it usually shrinks by more than half with no visible change. Then check the result has a viewBox and no width and height attributes, because optimisers preserve whatever the tool wrote.
Using inline SVG: 4 steps
- Draw it with a
viewBoxand no fixed width or height attributes. The viewBox defines the drawing's own coordinates; the element then scales to whatever container it sits in. - Take colours from CSS variables.
fill: var(--accent). The drawing follows the page's palette and its dark mode. - Label it.
role="img"and anaria-labelthat states the values, or a<title>element inside the svg. - Keep it inline for diagrams and charts; use an image for photographs. SVG is shapes and text. A photograph is pixels and belongs in an
<img>, at a full address or embedded.