D3 (also written D3.js) is a JavaScript library for drawing data with SVG. In a single HTML file you need an element to draw into, one script tag that loads D3 from a CDN, and your code below it. Nothing to install, no build step.
Here is a whole bar chart. Change a number in data and the bar follows.
<!doctype html>
<html lang="en">
<head>
<meta charset="utf-8">
<meta name="viewport" content="width=device-width, initial-scale=1">
<title>D3 bar chart</title>
<style>
  body { margin: 0; padding: 16px; font-family: system-ui, sans-serif; background: #fff; }
  #chart { max-width: 640px; margin: 0 auto; }
  svg { width: 100%; height: auto; display: block; }  /* scales with the page */
  .bar { fill: #2563eb; }
  svg text { font-size: 13px; }  /* axis labels: the default 10px shrinks with the svg */
</style>
</head>
<body>
<div id="chart"></div>

<!-- 1. load D3 (pinned version). It defines a global called d3 -->
<script src="https://cdn.jsdelivr.net/npm/d3@7.9.0/dist/d3.min.js"></script>

<!-- 2. your code, after the D3 tag and after #chart -->
<script>
  const data = [
    { day: 'Mon', orders: 12 }, { day: 'Tue', orders: 19 }, { day: 'Wed', orders: 7 },
    { day: 'Thu', orders: 15 }, { day: 'Fri', orders: 22 }
  ];
  const width = 480, height = 280;
  const m = { top: 16, right: 12, bottom: 28, left: 36 };  // room for the axes

  // scales turn data values into pixel positions
  const x = d3.scaleBand()
    .domain(data.map(d => d.day))
    .range([m.left, width - m.right])
    .padding(0.2);
  const y = d3.scaleLinear()
    .domain([0, d3.max(data, d => d.orders)]).nice()
    .range([height - m.bottom, m.top]);  // flipped: SVG y grows downward

  const svg = d3.select('#chart').append('svg')
    .attr('viewBox', [0, 0, width, height]);

  // one rect per data item
  svg.selectAll('rect')
    .data(data)
    .join('rect')
      .attr('class', 'bar')
      .attr('x', d => x(d.day))
      .attr('y', d => y(d.orders))
      .attr('width', x.bandwidth())
      .attr('height', d => y(0) - y(d.orders));

  svg.append('g').attr('transform', `translate(0,${height - m.bottom})`).call(d3.axisBottom(x));
  svg.append('g').attr('transform', `translate(${m.left},0)`).call(d3.axisLeft(y));
</script>
</body>
</html>
D3 does not take a config and return a chart. Its docs call it a low-level toolbox: you build the chart from scales, axes and shapes, and D3 creates the SVG elements.
The D3 website says it is released under the ISC License.
The smallest working file
Copy this into an empty .html file and open it in a browser:
<!doctype html>
<meta charset="utf-8">
<div id="chart"></div>

<script src="https://cdn.jsdelivr.net/npm/d3@7.9.0/dist/d3.min.js"></script>
<script>
  const data = [12, 19, 7];
  d3.select('#chart').append('svg')
      .attr('width', 300).attr('height', 120)
    .selectAll('rect')
    .data(data)
    .join('rect')
      .attr('x', (d, i) => i * 100)
      .attr('y', d => 120 - d * 5)
      .attr('width', 80)
      .attr('height', d => d * 5);
</script>
- The div is where the chart goes.
d3.select('#chart')finds it, the same wayquerySelectordoes. - The first script tag loads the UMD build of D3. It puts one global,
d3, on the page. - The second script tag appends an
<svg>, thendata()andjoin()create one<rect>per number.
Each .attr() can take a function. D3 calls it once per element with that element's data item, d, and its position, i.
Script tag or ES module
The D3 getting-started page shows both. It recommends the ES module bundle from a CDN, and also offers the UMD file for a plain script tag.
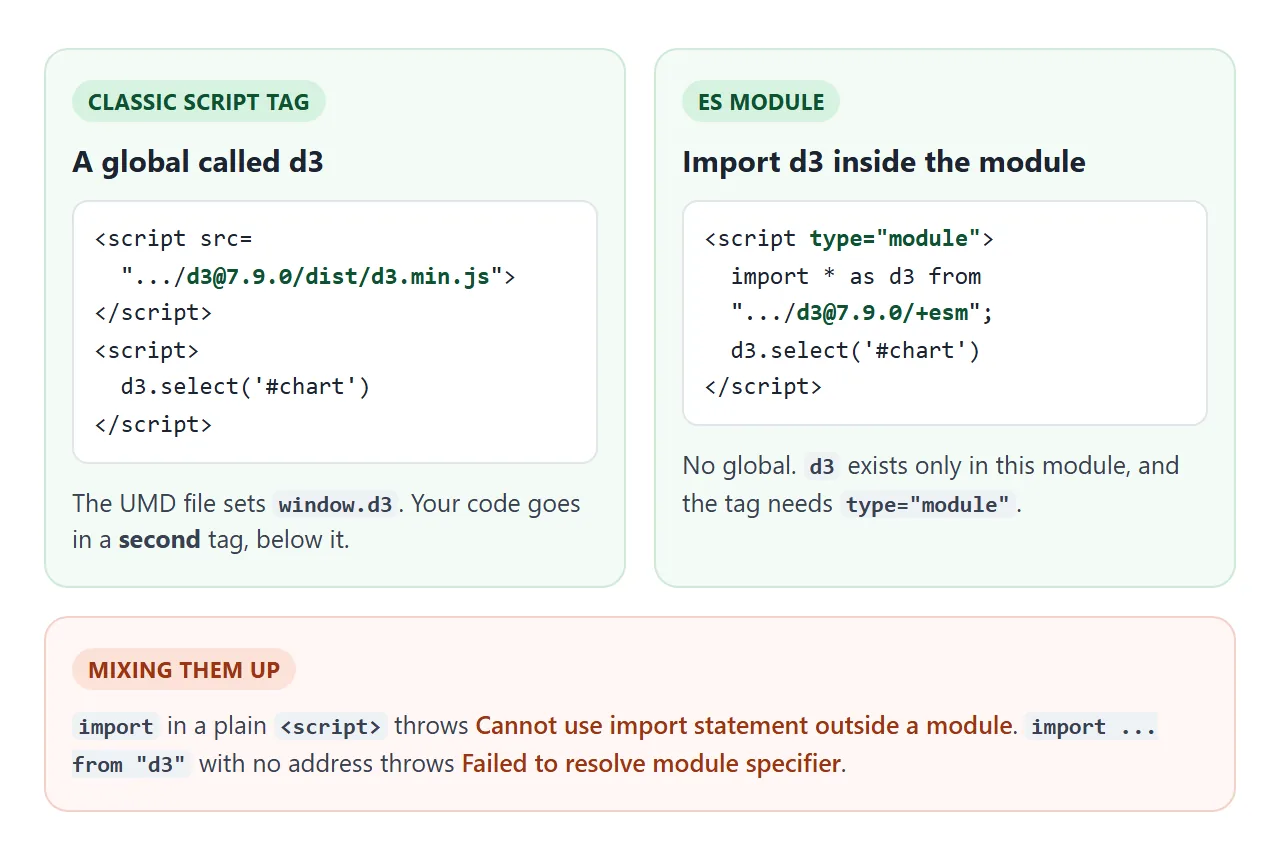
The module form looks like this:
<script type="module">
  import * as d3 from 'https://cdn.jsdelivr.net/npm/d3@7.9.0/+esm';
  d3.select('#chart').append('svg');
</script>
Both work in a single file. The difference is scope. With the module, d3 exists only inside that <script type="module">, so other scripts on the page cannot use it.
| Script tag (UMD) | ES module | |
|---|---|---|
| Address ends in | /dist/d3.min.js |
/+esm |
How your code gets d3 |
Global variable | import * as d3 |
| Your code goes in | A second plain <script> |
The same type="module" tag |
| Typical error | d3 is not defined (code above the tag) |
"Cannot use import statement outside a module" (no type="module") |
Pin the version either way. The docs use d3@7, which follows the newest 7.x release. On 1 October 2026 the latest version on npm is 7.9.0. The same file also loads from cdnjs and unpkg:
<script src="https://cdnjs.cloudflare.com/ajax/libs/d3/7.9.0/d3.min.js"></script>
<script src="https://unpkg.com/d3@7.9.0/dist/d3.min.js"></script>
In a project with a bundler, you install the package and import it. The D3 docs give:
// npm install d3
import * as d3 from 'd3';
That bare 'd3' only works through a bundler or an import map. In a plain HTML file the browser does not know where d3 lives and throws "Failed to resolve module specifier". For a single file, use the full CDN address.
Scales: turning values into pixels
A scale is a function. You give it the range of your data, the domain, and the range of pixels, the range. Then y(15) returns the pixel position for 15.
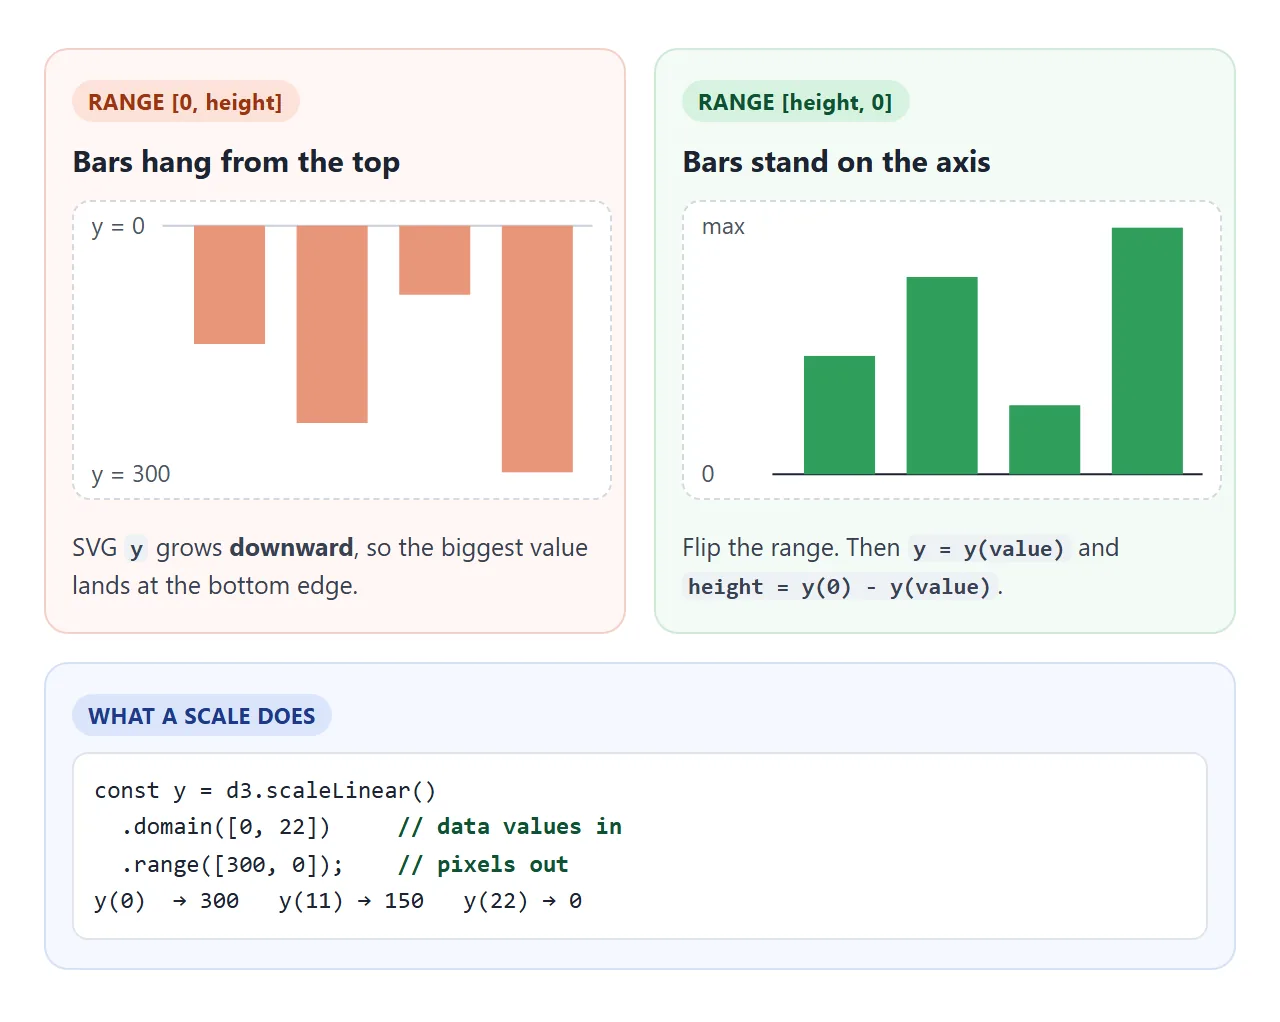
The usual surprise is upside-down bars. In SVG, y = 0 is the top edge and larger values go down. Write the y range as [height, 0]. Then each bar's top is y(value) and its height is y(0) - y(value).
For bars, d3.scaleBand() splits the width into equal slots, one per category, and x.bandwidth() gives the width of each slot. d3.axisBottom(x) and d3.axisLeft(y) draw axes from the same scales.
The first example sets a viewBox on the svg instead of a fixed width and height. Add one CSS rule and the drawing scales to its container:
svg { width: 100%; height: auto; display: block; }
Text scales with it. The axis labels D3 draws at 10px look smaller on a phone, so the examples set svg text { font-size: 13px; }. SVG in HTML covers viewBox in more detail.
Changing the data: the join
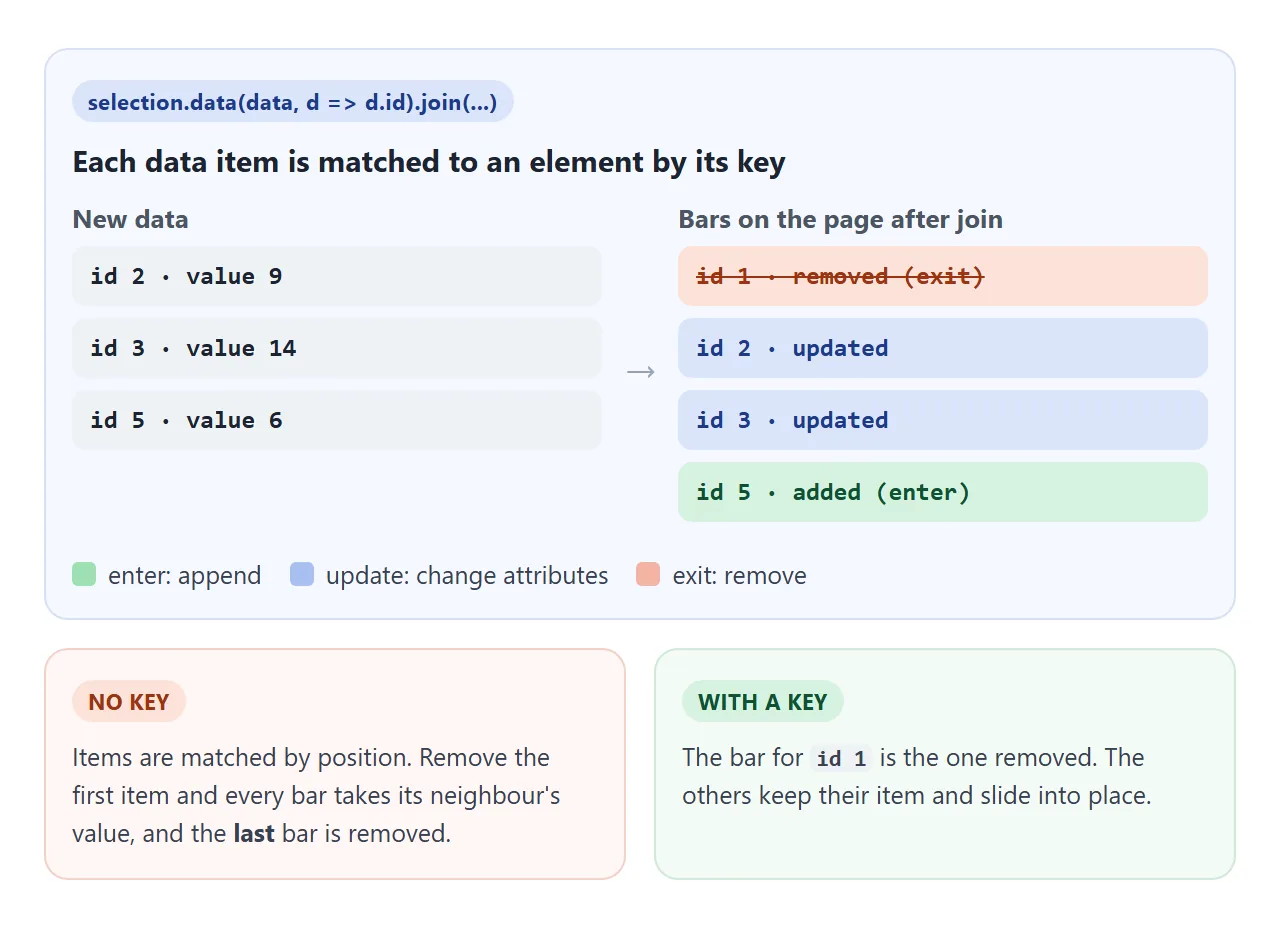
join() compares the new data with the elements already on the page. It appends elements for new items, updates the ones that stay, and removes the extras.
<!doctype html>
<html lang="en">
<head>
<meta charset="utf-8">
<meta name="viewport" content="width=device-width, initial-scale=1">
<title>D3 data join</title>
<style>
  body { margin: 0; padding: 14px; font-family: system-ui, sans-serif; background: #fff; color: #1d2330; }
  .bar { display: flex; flex-wrap: wrap; gap: 6px; margin-bottom: 10px; }
  button { padding: 7px 12px; font: inherit; font-size: 14px; border: 1px solid #c9ced6; border-radius: 99px; background: #fff; color: #1d2330; cursor: pointer; }
  #status { font-size: 14px; color: #4b5563; margin: 0 0 6px; }
  #chart { max-width: 640px; }
  svg { width: 100%; height: auto; display: block; }
  rect { fill: #0f766e; }
  text.label { font-size: 15px; fill: #fff; text-anchor: middle; }
</style>
</head>
<body>
<div class="bar">
  <button id="add">Add a bar</button>
  <button id="remove">Remove first</button>
  <button id="shuffle">New values</button>
  <button id="sort">Sort</button>
</div>
<p id="status"></p>
<div id="chart"></div>

<!-- ES module version: D3's docs recommend this form -->
<script type="module">
  import * as d3 from 'https://cdn.jsdelivr.net/npm/d3@7.9.0/+esm';

  const width = 480, height = 260;
  let nextId = 0;
  const item = () => ({ id: nextId++, value: Math.round(5 + Math.random() * 25) });
  let data = d3.range(5).map(item);

  const svg = d3.select('#chart').append('svg').attr('viewBox', [0, 0, width, height]);
  const x = d3.scaleBand().range([0, width]).padding(0.15);
  const y = d3.scaleLinear().domain([0, 30]).range([height, 0]);

  function draw() {
    x.domain(data.map(d => d.id));
    const t = svg.transition().duration(500);

    // the key (d => d.id) makes each bar follow its own item
    svg.selectAll('g.item')
      .data(data, d => d.id)
      .join(
        enter => {
          const g = enter.append('g').attr('class', 'item')
            .attr('transform', d => `translate(${x(d.id)},0)`);
          g.append('rect').attr('y', height).attr('height', 0);  // grows up from the bottom
          g.append('text').attr('class', 'label');
          return g;
        },
        update => update,
        exit => exit.transition(t).style('opacity', 0).remove()
      )
      .call(g => g.transition(t).attr('transform', d => `translate(${x(d.id)},0)`))
      .call(g => g.select('rect').transition(t)
        .attr('width', x.bandwidth())
        .attr('y', d => y(d.value))
        .attr('height', d => height - y(d.value)))
      .call(g => g.select('text')
        .attr('x', x.bandwidth() / 2)
        .attr('y', d => y(d.value) + 18)
        .text(d => d.value));

    document.getElementById('status').textContent = `${data.length} bars`;
  }

  document.getElementById('add').addEventListener('click', () => { data.push(item()); draw(); });
  document.getElementById('remove').addEventListener('click', () => { data.shift(); draw(); });
  document.getElementById('shuffle').addEventListener('click', () => {
    data = data.map(d => ({ id: d.id, value: item().value })); draw();
  });
  document.getElementById('sort').addEventListener('click', () => {
    data = data.slice().sort((a, b) => a.value - b.value); draw();
  });
  draw();
</script>
</body>
</html>
Pass a key function as the second argument to data(), such as d => d.id. Without one, D3 matches by position. Remove the first item and every bar takes its neighbour's value, then the last bar is removed.
| Part of the join | When it runs | Typical code |
|---|---|---|
| enter | A data item has no element yet | Append the shape, start it at zero height |
| update | Item and element both exist | Move and resize it |
| exit | An element has no data item left | Fade it out and remove() |
Wrap the drawing in a function and call it whenever the data changes. A transition such as .transition().duration(500) animates the change.
A finished example: a line chart from CSV
This one reads CSV from the text box, draws a line with d3.line() and shows the value under the pointer. Edit the numbers and press Draw.
<!doctype html>
<html lang="en">
<head>
<meta charset="utf-8">
<meta name="viewport" content="width=device-width, initial-scale=1">
<title>D3 line chart from CSV</title>
<style>
  body { margin: 0; padding: 14px; font-family: system-ui, sans-serif; background: #eef0f3; color: #1d2330; }
  .card { background: #fff; border-radius: 12px; padding: 12px; max-width: 680px; margin: 0 auto; }
  h1 { font-size: 17px; margin: 0 0 8px; }
  #chart { position: relative; }
  svg { width: 100%; height: auto; display: block; touch-action: none; }
  svg text { font-size: 13px; }
  .line { fill: none; stroke: #2563eb; stroke-width: 2.5; }
  #tip { position: absolute; pointer-events: none; background: #1d2330; color: #fff; font-size: 13px;
         padding: 4px 8px; border-radius: 6px; white-space: nowrap; display: none; }
  form { margin-top: 10px; }
  label { font-size: 14px; color: #4b5563; }
  textarea { box-sizing: border-box; width: 100%; height: 120px; margin-top: 4px; font: 13px ui-monospace, Consolas, monospace; border: 1px solid #c9ced6; border-radius: 8px; padding: 8px; }
  button { margin-top: 6px; padding: 7px 14px; font: inherit; font-size: 14px; border: 0; border-radius: 99px; background: #2563eb; color: #fff; cursor: pointer; }
  #msg { font-size: 14px; color: #4b5563; margin-left: 8px; }
</style>
</head>
<body>
<div class="card">
  <h1>Visitors per day</h1>
  <div id="chart"><div id="tip"></div></div>
  <form id="form">
    <label for="csv">Data (CSV, edit and press Draw)</label>
    <textarea id="csv">date,visitors
2026-09-01,120
2026-09-02,150
2026-09-03,90
2026-09-04,180
2026-09-05,210
2026-09-06,170
2026-09-07,240</textarea>
    <button>Draw</button><span id="msg"></span>
  </form>
</div>

<script src="https://cdn.jsdelivr.net/npm/d3@7.9.0/dist/d3.min.js"></script>
<script>
  const width = 480, height = 260;
  const m = { top: 14, right: 28, bottom: 28, left: 40 };
  const svg = d3.select('#chart').append('svg').attr('viewBox', [0, 0, width, height]);
  const xAxis = svg.append('g').attr('transform', `translate(0,${height - m.bottom})`);
  const yAxis = svg.append('g').attr('transform', `translate(${m.left},0)`);
  const path = svg.append('path').attr('class', 'line');
  const dot = svg.append('circle').attr('r', 5).attr('fill', '#2563eb').style('display', 'none');
  const tip = d3.select('#tip');
  let data = [], x, y;  // filled in by draw()

  function draw(text) {
    // autoType turns "120" into 120 and "2026-09-01" into a Date
    const rows = d3.csvParse(text.trim(), d3.autoType)
      .filter(d => d.date instanceof Date && typeof d.visitors === 'number');
    if (rows.length < 2) return 'Need at least two rows of date,visitors';
    data = rows.sort((a, b) => a.date - b.date);

    x = d3.scaleUtc(d3.extent(data, d => d.date), [m.left, width - m.right]);
    y = d3.scaleLinear([0, d3.max(data, d => d.visitors)], [height - m.bottom, m.top]).nice();
    xAxis.call(d3.axisBottom(x).ticks(5));
    yAxis.call(d3.axisLeft(y).ticks(5));
    path.datum(data).attr('d', d3.line(d => x(d.date), d => y(d.visitors)));
    return `${data.length} points`;
  }

  // hover, or tap on a phone: find the nearest date and show its value
  const bisect = d3.bisector(d => d.date).center;
  svg.on('pointerdown pointermove', (event) => {
    const [px] = d3.pointer(event);          // pointer position in viewBox units
    const d = data[bisect(data, x.invert(px))];
    dot.style('display', null).attr('cx', x(d.date)).attr('cy', y(d.visitors));
    const k = svg.node().clientWidth / width; // viewBox units -> CSS pixels
    tip.style('display', 'block')
      .style('left', Math.min(x(d.date) * k + 8, svg.node().clientWidth - 110) + 'px')
      .style('top', Math.max(0, y(d.visitors) * k - 30) + 'px')
      .text(`${d3.utcFormat('%b %d')(d.date)}: ${d.visitors}`);
  });
  // a finger also fires pointerleave when it lifts, so only a mouse hides the tooltip
  svg.on('pointerleave', (event) => {
    if (event.pointerType === 'mouse') { dot.style('display', 'none'); tip.style('display', 'none'); }
  });

  // the form only redraws the page; nothing is sent anywhere
  document.getElementById('form').addEventListener('submit', (e) => {
    e.preventDefault();
    document.getElementById('msg').textContent = draw(document.getElementById('csv').value);
  });
  document.getElementById('msg').textContent = draw(document.getElementById('csv').value);
</script>
</body>
</html>
- Parse with types:
d3.csvParse(text, d3.autoType)turns "120" into a number and "2026-09-01" into a Date. WithoutautoType, every value stays a string. - Nearest point:
d3.pointer(event)gives the pointer position inside the svg, andd3.bisectorfinds the closest date. - Phones: a finger fires
pointerleavewhen it lifts, so only a mouse hides the tooltip.
The data sits in the page. Loading it with d3.csv('data.csv') uses fetch. From a file opened by double-click, Chrome refuses it: "URL scheme "file" is not supported". An HTML table from CSV shows other ways to bring CSV into a page.
When it does not work
| What you see | Cause | Fix |
|---|---|---|
d3 is not defined |
Your code runs above the D3 tag, or the address is wrong | Put the D3 tag first and check the address |
| "Cannot use import statement outside a module" | import in a plain <script> |
Add type="module" |
| "Failed to resolve module specifier" | import ... from 'd3' without a bundler |
Import from the full +esm address |
| Blank page, no error | d3.select ran before the element existed, or the id is wrong |
Put the scripts at the end of the body and match the id |
| Bars hang from the top | y range written [0, height] |
Use [height, 0] |
| Axis or max value is wrong | CSV values are strings, so "90" counts as bigger than "240" | Parse with d3.autoType or +d.value |
d3.event is undefined |
Code written for D3 5 or older | Use the event argument of the listener |
d3.csv() fails |
The page was opened from a file, or the data is on another site | Put the data in the page |
Share it as a link
A D3 chart is easier to show than to describe. A screenshot loses the hover and the buttons, and an .html attachment may open as plain code, or not at all, on a phone.
To send the working version, paste the page into a NOS document and choose Create share link. HTML to link walks through it.
The page renders as written, its scripts run and D3 loads from jsDelivr, so the people you send it to can hover the line and press the buttons themselves. Anyone with the link can open it without an account.
Keep the data inside the page. Fetching it from another site is blocked in NOS, so a d3.csv() call to an outside address will fail.
If you change the code later, the same link shows the new version. Sharing an interactive chart covers more ways to send one.