The word "parcel" has two meanings on the web. In a search like "parcel viewer VT html5" it means a parcel viewer, a map of property lots that you click for details. Parcel is also a JavaScript build tool, covered near the end.
A viewer fits in one HTML file: outlines, a little maths and a click handler.
Try it first. These five parcels are made up. Click one.
<!doctype html>
<html lang="en">
<head>
<meta charset="utf-8">
<meta name="viewport" content="width=device-width, initial-scale=1">
<title>Parcel map in SVG</title>
<style>
  body { margin: 0; padding: 12px; font-family: system-ui, sans-serif; background: #f4f5f7; color: #1d2330; }
  svg { display: block; width: 100%; max-width: 440px; background: #fff; border: 1px solid #d9dde4; border-radius: 10px; }
  polygon { fill: #cfe8d5; stroke: #2f6f46; stroke-width: 2; cursor: pointer; }
  polygon:hover { fill: #b5dcbf; }
  polygon.picked { fill: #f6c58b; stroke: #b45309; }
  #info { margin: 10px 0 0; min-height: 2.6em; font-size: 15px; line-height: 1.4; }
</style>
</head>
<body>
<svg id="map" role="img" aria-label="Map of five sample parcels"></svg>
<p id="info">Click a parcel.</p>

<script>
  // Made-up parcels. GeoJSON order is [longitude, latitude]; each ring ends where it starts.
  const parcels = { type: 'FeatureCollection', features: [
    { type: 'Feature', properties: { id: 'A-101', use: 'Pasture' },   geometry: { type: 'Polygon', coordinates: [[[-72.500, 44.000], [-72.498, 44.000], [-72.498, 44.002], [-72.500, 44.002], [-72.500, 44.000]]] } },
    { type: 'Feature', properties: { id: 'A-102', use: 'Woodland' },  geometry: { type: 'Polygon', coordinates: [[[-72.498, 44.000], [-72.495, 44.000], [-72.495, 44.0015], [-72.498, 44.002], [-72.498, 44.000]]] } },
    { type: 'Feature', properties: { id: 'A-103', use: 'Hayfield' },  geometry: { type: 'Polygon', coordinates: [[[-72.498, 44.002], [-72.495, 44.0015], [-72.495, 44.003], [-72.498, 44.003], [-72.498, 44.002]]] } },
    { type: 'Feature', properties: { id: 'B-201', use: 'Orchard' },   geometry: { type: 'Polygon', coordinates: [[[-72.500, 44.002], [-72.498, 44.002], [-72.498, 44.003], [-72.499, 44.0035], [-72.500, 44.003], [-72.500, 44.002]]] } },
    { type: 'Feature', properties: { id: 'B-202', use: 'Residential' }, geometry: { type: 'Polygon', coordinates: [[[-72.495, 44.000], [-72.493, 44.0005], [-72.493, 44.003], [-72.495, 44.003], [-72.495, 44.000]]] } }
  ] };

  const svg = document.getElementById('map');
  const info = document.getElementById('info');
  const NS = 'http://www.w3.org/2000/svg';

  // Flat-map approximation in metres: a degree of longitude shrinks by cos(latitude).
  const R = 6371000, RAD = Math.PI / 180;
  const all = parcels.features.flatMap(f => f.geometry.coordinates[0]);
  const minLon = Math.min(...all.map(p => p[0])), maxLat = Math.max(...all.map(p => p[1]));
  const cosLat = Math.cos(maxLat * RAD);
  const toXY = ([lon, lat]) => [
    (lon - minLon) * RAD * R * cosLat,  // east, in metres
    (maxLat - lat) * RAD * R            // flipped: SVG y grows downward, latitude grows upward
  ];

  const pts = parcels.features.map(f => f.geometry.coordinates[0].map(toXY));
  const width = Math.max(...pts.flat().map(p => p[0]));
  const height = Math.max(...pts.flat().map(p => p[1]));
  const pad = 20;
  svg.setAttribute('viewBox', `${-pad} ${-pad} ${width + 2 * pad} ${height + 2 * pad}`);  // the viewBox does the fitting

  parcels.features.forEach((f, i) => {
    const poly = document.createElementNS(NS, 'polygon');  // SVG elements need the SVG namespace
    poly.setAttribute('points', pts[i].map(p => p.join(',')).join(' '));
    poly.addEventListener('click', () => {
      svg.querySelectorAll('polygon').forEach(p => p.classList.remove('picked'));
      poly.classList.add('picked');
      info.textContent = `${f.properties.id} - ${f.properties.use}`;
    });
    svg.appendChild(poly);
  });
</script>
</body>
</html>
The page uses plain SVG, with no library and no map tiles, so it runs anywhere an HTML file does.
How it works: GeoJSON in, clickable SVG out
Every parcel viewer, big or small, does the same four things.
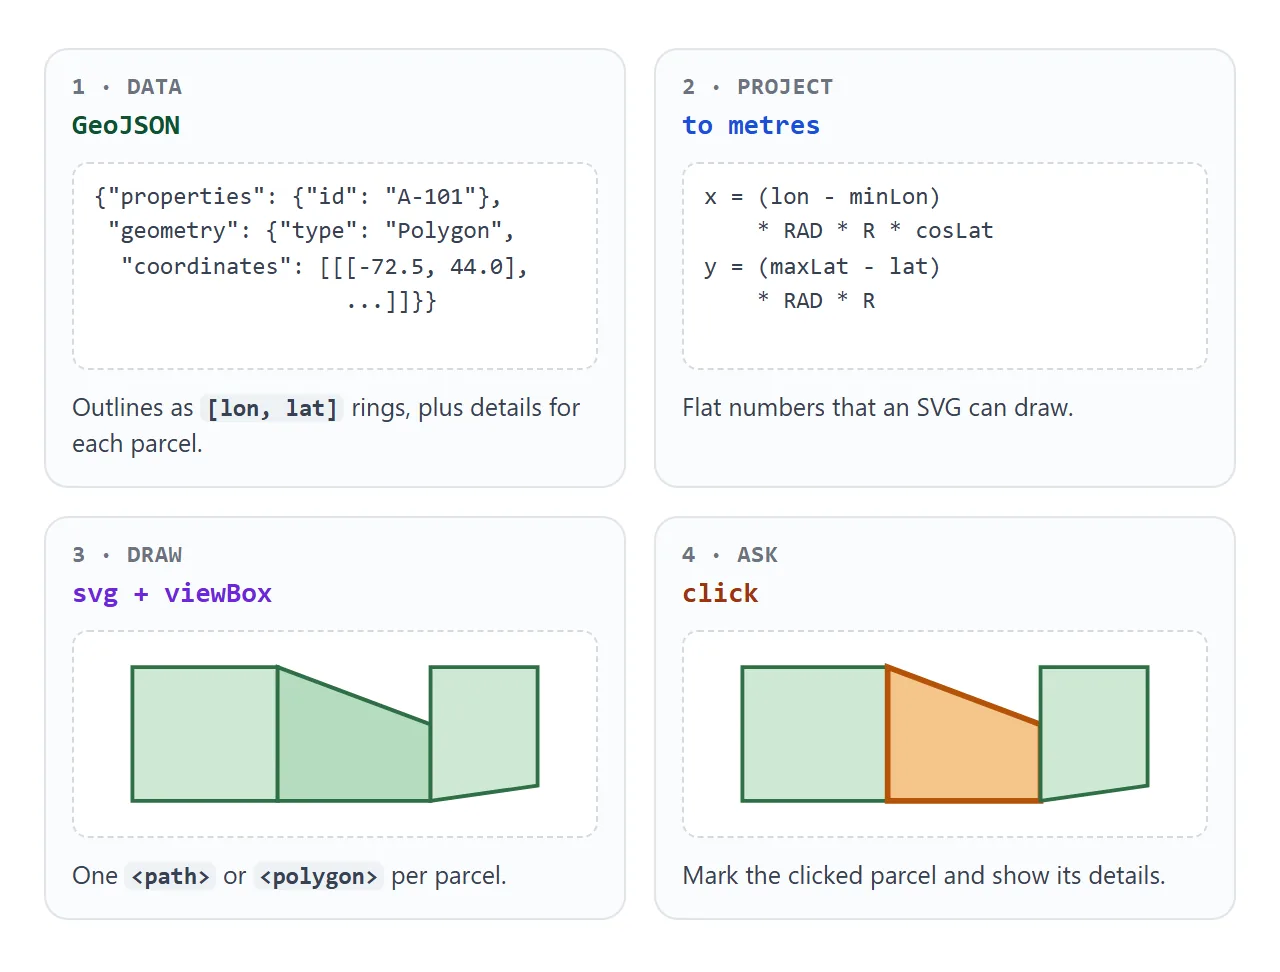
- Data. Outlines as GeoJSON, a JSON-based format for geographic features. A FeatureCollection holds Feature objects. Each one has a geometry and a properties object for details such as an ID.
- Project. Turn longitude and latitude into flat x and y numbers.
- Draw. Put one SVG shape per parcel inside an
<svg>that has aviewBox. - Ask. On click, mark the shape and show its properties.
In GeoJSON a position is longitude first, then latitude. A polygon is a ring of positions in which the first and last position are identical. Here is one parcel:
{ "type": "Feature",
  "properties": { "id": "A-101", "use": "Pasture" },
  "geometry": { "type": "Polygon",
    "coordinates": [[[-72.500, 44.000], [-72.498, 44.000],
                     [-72.498, 44.002], [-72.500, 44.002],
                     [-72.500, 44.000]]] } }
The Vermont Center for Geographic Information runs the Vermont Parcel Viewer, where you can search by SPAN or address. Its parcel program lists downloads such as KML. A viewer that reads GeoJSON needs the data in that format, so check what the publisher offers.
From longitude and latitude to the screen
Two things go wrong if you use longitude and latitude directly as x and y.
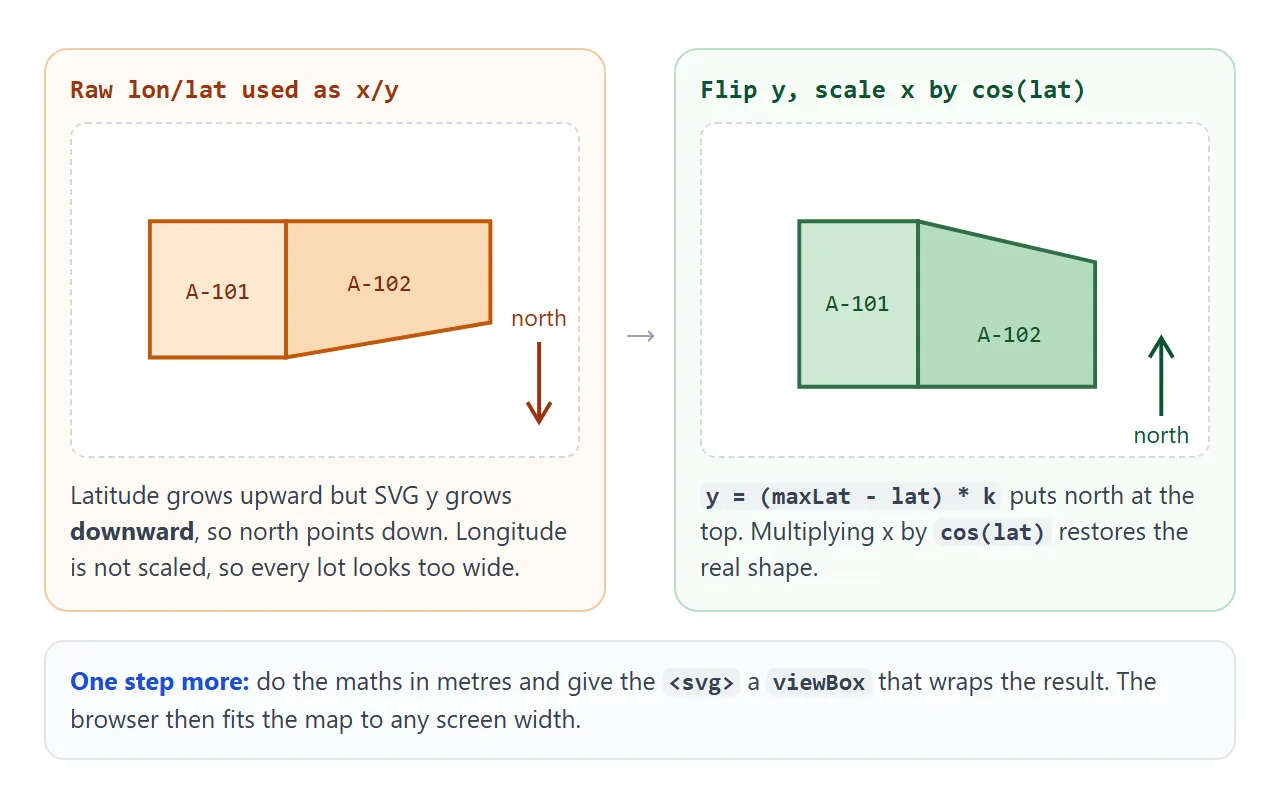
First, the SVG y axis points down, while latitude grows upward. Subtract each latitude from the largest one and north ends up at the top.
Second, a degree of latitude stays fairly constant, but a degree of longitude shrinks toward the poles. Multiplying the east-west distance by the cosine of the latitude fixes the shape. This code does both, in metres:
const R = 6371000, RAD = Math.PI / 180;  // Earth radius in metres, degrees to radians
const toXY = ([lon, lat]) => [
  (lon - minLon) * RAD * R * cosLat,     // east, in metres
  (maxLat - lat) * RAD * R               // flipped for SVG
];
The radius is the mean radius of the Earth, so this is a flat-map approximation. It is fine for a picture, not for legal boundaries.
Because the numbers are metres, the viewBox can simply wrap the data plus a margin. The browser then scales the map to any screen width. SVG in HTML explains viewBox further.
Add pan and zoom with Leaflet
The SVG map cannot pan, and zoom would be your own code. Leaflet is a JavaScript map library under the BSD 2-Clause licence that adds both. It reads the same GeoJSON, so the data does not change.
<!doctype html>
<html lang="en">
<head>
<meta charset="utf-8">
<meta name="viewport" content="width=device-width, initial-scale=1">
<title>Parcels with Leaflet</title>
<link rel="stylesheet" href="https://unpkg.com/leaflet@1.9.4/dist/leaflet.css">
<style>
  body { margin: 0; padding: 12px; font-family: system-ui, sans-serif; background: #f4f5f7; color: #1d2330; }
  #map { height: 290px; border: 1px solid #d9dde4; border-radius: 10px; background: #fff; }  /* Leaflet needs a height */
  #info { margin: 10px 0 0; min-height: 2.6em; font-size: 15px; line-height: 1.4; }
</style>
</head>
<body>
<div id="map"></div>
<p id="info">Click a parcel. Drag to pan, scroll or pinch to zoom.</p>

<script src="https://unpkg.com/leaflet@1.9.4/dist/leaflet.js"></script>
<script>
  // Same made-up parcels as the SVG example, still [longitude, latitude].
  const parcels = { type: 'FeatureCollection', features: [
    { type: 'Feature', properties: { id: 'A-101', use: 'Pasture' },   geometry: { type: 'Polygon', coordinates: [[[-72.500, 44.000], [-72.498, 44.000], [-72.498, 44.002], [-72.500, 44.002], [-72.500, 44.000]]] } },
    { type: 'Feature', properties: { id: 'A-102', use: 'Woodland' },  geometry: { type: 'Polygon', coordinates: [[[-72.498, 44.000], [-72.495, 44.000], [-72.495, 44.0015], [-72.498, 44.002], [-72.498, 44.000]]] } },
    { type: 'Feature', properties: { id: 'A-103', use: 'Hayfield' },  geometry: { type: 'Polygon', coordinates: [[[-72.498, 44.002], [-72.495, 44.0015], [-72.495, 44.003], [-72.498, 44.003], [-72.498, 44.002]]] } },
    { type: 'Feature', properties: { id: 'B-201', use: 'Orchard' },   geometry: { type: 'Polygon', coordinates: [[[-72.500, 44.002], [-72.498, 44.002], [-72.498, 44.003], [-72.499, 44.0035], [-72.500, 44.003], [-72.500, 44.002]]] } },
    { type: 'Feature', properties: { id: 'B-202', use: 'Residential' }, geometry: { type: 'Polygon', coordinates: [[[-72.495, 44.000], [-72.493, 44.0005], [-72.493, 44.003], [-72.495, 44.003], [-72.495, 44.000]]] } }
  ] };

  const base = { color: '#2f6f46', weight: 2, fillColor: '#cfe8d5', fillOpacity: 0.9 };
  const picked = { color: '#b45309', weight: 3, fillColor: '#f6c58b', fillOpacity: 0.95 };
  const info = document.getElementById('info');

  // No tile layer: tiles are images from a tile server, and this page loads no outside images.
  const map = L.map('map');
  const layer = L.geoJSON(parcels, {
    style: base,
    onEachFeature: (feature, polygon) => {
      polygon.on('click', () => {
        layer.setStyle(base);
        polygon.setStyle(picked);
        info.textContent = `${feature.properties.id} - ${feature.properties.use}`;
      });
    }
  }).addTo(map);
  map.fitBounds(layer.getBounds(), { padding: [16, 16] });
  info.textContent += ` (Leaflet ${L.version})`;
</script>
</body>
</html>
The page loads Leaflet 1.9.4 from unpkg with the version in the address, so the page keeps using that exact release. L.geoJSON draws the data, fitBounds frames it and each polygon gets a click listener.
Maps often sit on tile images from a tile server. This demo adds no tile layer, because NOS blocks images from other sites, so the parcels sit on a plain background. Leaflet's quick start shows how to add one on a page hosted elsewhere.
| Plain SVG | Leaflet | |
|---|---|---|
| Extra files | None | One script and one stylesheet from unpkg |
| Pan and zoom | You write it | Built in |
| Background map | None | Optional tile layer |
| Best for | A fixed picture you click | A map people move around |
For pins and popups instead of outlines, see map markers in HTML.
A finished viewer with search and your own data
This version adds a search box, a details panel with an approximate area, zoom to the selected parcel, and a box where you paste your own GeoJSON.
<!doctype html>
<html lang="en">
<head>
<meta charset="utf-8">
<meta name="viewport" content="width=device-width, initial-scale=1">
<title>Parcel viewer</title>
<style>
  * { box-sizing: border-box; }
  body { margin: 0; padding: 12px; font-family: system-ui, sans-serif; background: #f4f5f7; color: #1d2330; font-size: 15px; }
  h1 { font-size: 17px; margin: 0 0 10px; }
  .layout { display: grid; gap: 12px; grid-template-columns: 1fr; }
  @media (min-width: 640px) { .layout { grid-template-columns: 1.3fr 1fr; } }
  svg { display: block; width: 100%; aspect-ratio: 4 / 3; background: #fff; border: 1px solid #d9dde4; border-radius: 10px; }
  path { fill: #cfe8d5; stroke: #2f6f46; stroke-width: 2; vector-effect: non-scaling-stroke; cursor: pointer; }  /* stroke keeps its width when zoomed */
  path:hover { fill: #b5dcbf; }
  path.picked { fill: #f6c58b; stroke: #b45309; }
  path.dim { fill: #eef0f3; stroke: #b9c0cc; }
  label { display: block; font-weight: 600; margin-bottom: 4px; }
  input[type=search], textarea { width: 100%; font: inherit; padding: 8px 10px; border: 1px solid #b9c0cc; border-radius: 8px; background: #fff; }
  textarea { font: 12.5px/1.4 ui-monospace, Consolas, monospace; height: 120px; }
  .chips { display: flex; flex-wrap: wrap; gap: 6px; margin: 10px 0; }
  button { font: inherit; padding: 7px 12px; border: 1px solid #b9c0cc; border-radius: 8px; background: #fff; cursor: pointer; }
  button[aria-pressed=true] { background: #f6c58b; border-color: #b45309; }
  button.go { background: #1d4ed8; border-color: #1d4ed8; color: #fff; }
  .chips button[hidden] { display: none; }
  dl { margin: 0 0 10px; display: grid; grid-template-columns: auto 1fr; gap: 4px 12px; }
  dt { color: #5b6473; }
  dd { margin: 0; overflow-wrap: anywhere; }
  .row { display: flex; gap: 8px; flex-wrap: wrap; }
  #own { margin-top: 12px; padding-top: 10px; border-top: 1px solid #d9dde4; }
  #msg { min-height: 1.4em; margin: 6px 0 0; color: #9a3412; font-size: 14px; }
</style>
</head>
<body>
<h1>Parcel viewer</h1>
<div class="layout">
  <svg id="map" role="img" aria-label="Parcel map"></svg>
  <div>
    <label for="q">Find a parcel</label>
    <input id="q" type="search" placeholder="Type an ID or a use, e.g. A- or hay" autocomplete="off">
    <div class="chips" id="chips"></div>
    <dl id="details"></dl>
    <div class="row">
      <button id="zoom" type="button">Zoom to parcel</button>
      <button id="all" type="button">Show all</button>
    </div>
  </div>
</div>

<div id="own">
  <label for="json">Your own GeoJSON (Polygon or MultiPolygon, longitude first)</label>
  <textarea id="json" spellcheck="false">{"type":"FeatureCollection","features":[
 {"type":"Feature","properties":{"id":"C-1","use":"Garden"},"geometry":{"type":"Polygon","coordinates":[[[-73.001,44.500],[-73.000,44.500],[-73.000,44.501],[-73.001,44.501],[-73.001,44.500]]]}},
 {"type":"Feature","properties":{"id":"C-2","use":"Lot"},"geometry":{"type":"Polygon","coordinates":[[[-73.000,44.500],[-72.9985,44.5005],[-73.000,44.501],[-73.000,44.500]]]}}
]}</textarea>
  <div class="row" style="margin-top:8px">
    <button id="draw" class="go" type="button">Draw it</button>
    <button id="sample" type="button">Back to the sample</button>
  </div>
  <p id="msg" role="status"></p>
</div>

<script>
  const SAMPLE = { type: 'FeatureCollection', features: [
    { type: 'Feature', properties: { id: 'A-101', use: 'Pasture' },   geometry: { type: 'Polygon', coordinates: [[[-72.500, 44.000], [-72.498, 44.000], [-72.498, 44.002], [-72.500, 44.002], [-72.500, 44.000]]] } },
    { type: 'Feature', properties: { id: 'A-102', use: 'Woodland' },  geometry: { type: 'Polygon', coordinates: [[[-72.498, 44.000], [-72.495, 44.000], [-72.495, 44.0015], [-72.498, 44.002], [-72.498, 44.000]]] } },
    { type: 'Feature', properties: { id: 'A-103', use: 'Hayfield' },  geometry: { type: 'Polygon', coordinates: [[[-72.498, 44.002], [-72.495, 44.0015], [-72.495, 44.003], [-72.498, 44.003], [-72.498, 44.002]]] } },
    { type: 'Feature', properties: { id: 'B-201', use: 'Orchard' },   geometry: { type: 'Polygon', coordinates: [[[-72.500, 44.002], [-72.498, 44.002], [-72.498, 44.003], [-72.499, 44.0035], [-72.500, 44.003], [-72.500, 44.002]]] } },
    { type: 'Feature', properties: { id: 'B-202', use: 'Residential' }, geometry: { type: 'Polygon', coordinates: [[[-72.495, 44.000], [-72.493, 44.0005], [-72.493, 44.003], [-72.495, 44.003], [-72.495, 44.000]]] } }
  ] };

  const $ = (id) => document.getElementById(id);
  const NS = 'http://www.w3.org/2000/svg';
  const R = 6371000, RAD = Math.PI / 180, ACRE = 4046.873;  // sphere radius (m), degrees to radians, square metres per acre
  let parcels = [], full = [0, 0, 1, 1], current = -1;

  // Accept a FeatureCollection, a Feature or a bare geometry; keep each polygon's outer ring.
  function readGeoJSON(data) {
    const feats = data.type === 'FeatureCollection' ? data.features
                : data.type === 'Feature' ? [data]
                : [{ type: 'Feature', properties: {}, geometry: data }];
    const out = [];
    for (const f of feats) {
      const g = f.geometry || {};
      const polys = g.type === 'Polygon' ? [g.coordinates] : g.type === 'MultiPolygon' ? g.coordinates : [];
      if (polys.length) out.push({ props: f.properties || {}, rings: polys.map(p => p[0]) });
    }
    if (!out.length) throw new Error('No Polygon or MultiPolygon found.');
    return out;
  }

  function load(data) {
    const list = readGeoJSON(data);
    const all = list.flatMap(p => p.rings.flat());
    const minLon = Math.min(...all.map(c => c[0])), maxLat = Math.max(...all.map(c => c[1])), minLat = Math.min(...all.map(c => c[1]));
    const cosLat = Math.cos(((maxLat + minLat) / 2) * RAD);
    const toXY = ([lon, lat]) => [(lon - minLon) * RAD * R * cosLat, (maxLat - lat) * RAD * R];  // metres, y flipped for SVG

    parcels = list.map((p, i) => {
      const rings = p.rings.map(r => r.map(toXY));
      const m2 = rings.reduce((sum, r) => sum + Math.abs(r.reduce((s, c, k) => { const n = r[(k + 1) % r.length]; return s + c[0] * n[1] - n[0] * c[1]; }, 0)) / 2, 0);
      const xs = rings.flat().map(c => c[0]), ys = rings.flat().map(c => c[1]);
      return {
        id: String(p.props.id ?? p.props.name ?? 'Parcel ' + (i + 1)), props: p.props, acres: m2 / ACRE,
        box: [Math.min(...xs), Math.min(...ys), Math.max(...xs), Math.max(...ys)],
        d: rings.map(r => 'M' + r.map(c => c[0].toFixed(1) + ',' + c[1].toFixed(1)).join('L') + 'Z').join('')
      };
    });
    const b = parcels.map(p => p.box);
    const pad = 0.06 * Math.max(Math.max(...b.map(x => x[2])) - Math.min(...b.map(x => x[0])), Math.max(...b.map(x => x[3])) - Math.min(...b.map(x => x[1])));
    full = [Math.min(...b.map(x => x[0])) - pad, Math.min(...b.map(x => x[1])) - pad, Math.max(...b.map(x => x[2])) + pad, Math.max(...b.map(x => x[3])) + pad];
    draw();
  }

  function setView(box) { $('map').setAttribute('viewBox', `${box[0]} ${box[1]} ${box[2] - box[0]} ${box[3] - box[1]}`); }

  function draw() {
    const svg = $('map'), chips = $('chips');
    svg.replaceChildren(); chips.replaceChildren(); current = -1;
    parcels.forEach((p, i) => {
      const path = document.createElementNS(NS, 'path');
      path.setAttribute('d', p.d);
      path.addEventListener('click', () => select(i));
      svg.appendChild(path);
      const chip = document.createElement('button');
      chip.type = 'button'; chip.textContent = p.id; chip.setAttribute('aria-pressed', 'false');
      chip.addEventListener('click', () => select(i));
      chips.appendChild(chip);
    });
    setView(full); $('q').value = ''; show();
  }

  function select(i) {
    current = i;
    [...$('map').children].forEach((el, k) => el.classList.toggle('picked', k === i));
    [...$('chips').children].forEach((el, k) => el.setAttribute('aria-pressed', String(k === i)));
    show();
  }

  function show() {
    const dl = $('details'); dl.replaceChildren();
    const p = parcels[current];
    const rows = p ? [...Object.entries(p.props), ['area (approx.)', p.acres.toFixed(2) + ' acres']] : [['', 'Pick a parcel on the map or in the list.']];
    for (const [k, v] of rows) {  // textContent only: pasted data is never parsed as HTML
      const dt = document.createElement('dt'), dd = document.createElement('dd');
      dt.textContent = k; dd.textContent = String(v); dl.append(dt, dd);
    }
  }

  function filter() {
    const q = $('q').value.trim().toLowerCase();
    parcels.forEach((p, i) => {
      const hit = !q || (p.id + ' ' + Object.values(p.props).join(' ')).toLowerCase().includes(q);
      $('chips').children[i].hidden = !hit;
      $('map').children[i].classList.toggle('dim', !hit);
    });
  }

  $('q').addEventListener('input', filter);
  $('q').addEventListener('keydown', (e) => {
    if (e.key !== 'Enter') return;
    const first = [...$('chips').children].findIndex(c => !c.hidden);
    if (first >= 0) select(first);
  });
  $('zoom').addEventListener('click', () => {
    if (current < 0) return;
    const [x0, y0, x1, y1] = parcels[current].box, pad = 0.25 * Math.max(x1 - x0, y1 - y0);
    setView([x0 - pad, y0 - pad, x1 + pad, y1 + pad]);
  });
  $('all').addEventListener('click', () => setView(full));
  $('draw').addEventListener('click', () => {
    try { load(JSON.parse($('json').value)); $('msg').textContent = ''; }
    catch (err) { $('msg').textContent = err.message; }  // invalid JSON or no polygons: keep the current map
  });
  $('sample').addEventListener('click', () => { load(SAMPLE); $('msg').textContent = ''; });

  load(SAMPLE);
</script>
</body>
</html>
- Search: typing filters the list and fades the other parcels. Enter selects the first match.
- Area: the shoelace formula on the metre coordinates, divided by 4,046.873 square metres per acre.
- Zoom: only the
viewBoxchanges.vector-effect: non-scaling-strokekeeps outlines the same thickness. - Your data: it reads Polygon and MultiPolygon, outer rings only. Invalid JSON shows a message and keeps the current map.
- Safety: property values go in with
textContent, so pasted data is never run as HTML.
The data has to be inside the page. A page shared through NOS cannot fetch from other sites, and elsewhere the other server must allow it, as explained in CORS.
Parcel, the build tool: do you need it?
Parcel is a build tool that describes itself as zero configuration for the web. It starts from an HTML file, follows the scripts, stylesheets and images that the file references, and writes the result to a dist folder by default.
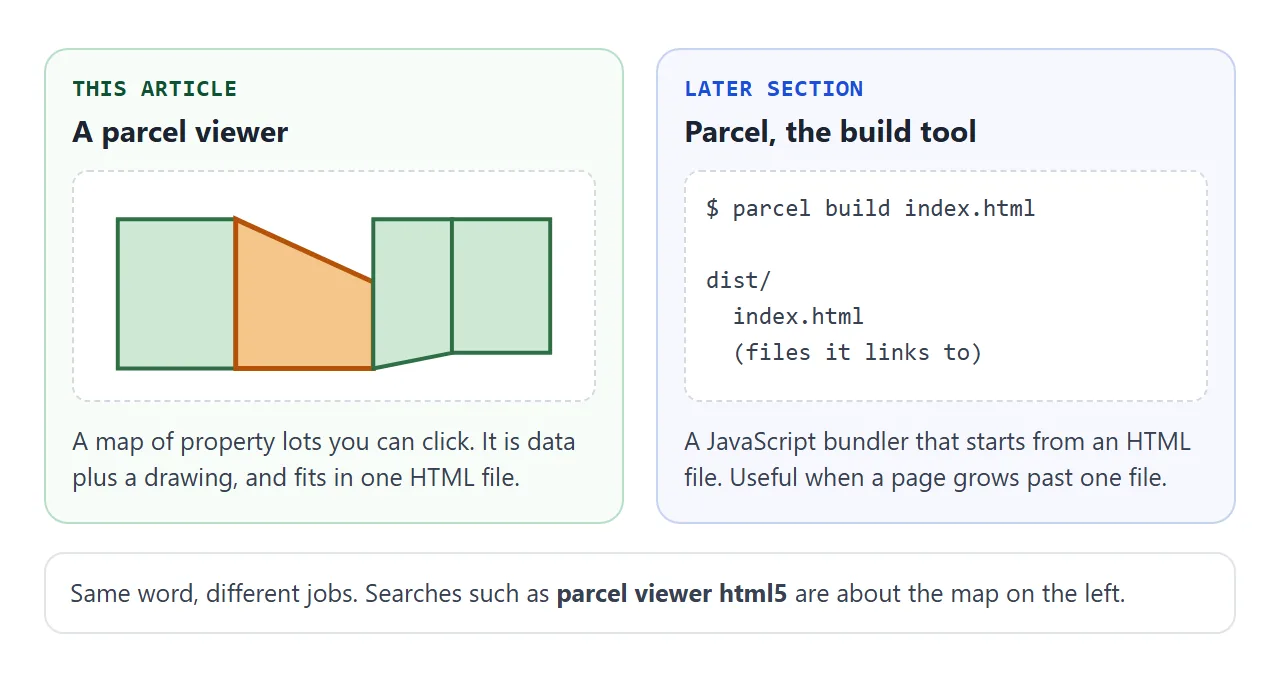
The Parcel documentation shows these commands. The first installs it, the second starts a development server (port 1234 unless you change it), and the third makes a one-time production build:
yarn add parcel
parcel index.html
parcel build index.html
Parcel is open source under the MIT licence. You do not need it for the viewer above, because everything is in one file. It starts to pay off when a page grows to need npm packages, TypeScript or many files.
Its output is a folder, and the references in the HTML are rewritten to point at the output files. To get back to one page, paste the built CSS and JavaScript into the HTML, or load libraries from a CDN as the Leaflet demo does.
When it does not work
| What you see | Cause | Fix |
|---|---|---|
| The map is upside down | SVG y grows downward | Use maxLat minus lat |
| Lots look too wide | Longitude not scaled | Multiply x by cos(lat) |
| Everything lands in one spot | Latitude and longitude swapped | GeoJSON is longitude first |
| Nothing draws, console shows SyntaxError | Invalid JSON, such as a trailing comma | Fix the JSON, then parse again |
| Shapes made in JavaScript do not show | Created with createElement | Use createElementNS with the SVG namespace |
| Outlines get thick when zoomed | Stroke scales with the viewBox | vector-effect: non-scaling-stroke |
| The Leaflet map is an empty strip | The container has no height | Set a height on the div in CSS |
| Tiles are missing in a shared page | Tile images come from other sites | Draw the parcels without tiles |
| parcel build gives a folder | Parcel writes output files to dist | Paste CSS and JS into the HTML |
Share it as a link
A parcel map is for clicking, and a screenshot cannot be clicked. An .html attachment may open as plain code on a phone, which opening an HTML file on a phone explains.
To send it, paste the page into a NOS document and choose Create share link. HTML to link walks through it. The page renders as written and its scripts run, so the people you send it to can click parcels, search and zoom themselves.
Anyone with the link can open it without an account. If you change the code later, the same link shows the new version. Leaflet loads from unpkg, which NOS allows. Keep the parcel data inside the page.