OpenLayers is a JavaScript library for putting an interactive map in a web page. It is a code library, not a hosted map service. In plain HTML you load it with two CDN tags. In React you install the ol package.
Start with the plain file, because the React version is the same code in a different wrapper. This map has a grid, one point and zoom buttons, and it draws no image files.
<!doctype html>
<html lang="en">
<head>
<meta charset="utf-8">
<meta name="viewport" content="width=device-width, initial-scale=1">
<title>OpenLayers: smallest map</title>
<link rel="stylesheet" href="https://cdn.jsdelivr.net/npm/ol@10.10.0/ol.css">
<script src="https://cdn.jsdelivr.net/npm/ol@10.10.0/dist/ol.js"></script>
<style>
  html, body { margin: 0; height: 100%; font-family: system-ui, sans-serif; }
  /* the map box needs a real height, or the map is 0px tall */
  #map { width: 100%; height: 100%; background: #eaf3fb; }
</style>
</head>
<body>
<div id="map"></div>

<script>
  // One point, given as [longitude, latitude]
  const seoul = new ol.Feature(new ol.geom.Point(ol.proj.fromLonLat([126.98, 37.57])));

  const map = new ol.Map({
    target: 'map',
    layers: [
      new ol.layer.Graticule({ showLabels: true }),  // lat/lon grid, no image files
      new ol.layer.Vector({ source: new ol.source.Vector({ features: [seoul] }) })
    ],
    view: new ol.View({
      center: ol.proj.fromLonLat([126.98, 37.57]),   // lon/lat -> map coordinates
      zoom: 6
    })
  });
</script>
</body>
</html>
The two tags you need
The OpenLayers download page gives the hosted build as one stylesheet and one script, both pinned to a version number. Put them in the <head>:
<link rel="stylesheet" href="https://cdn.jsdelivr.net/npm/ol@10.10.0/ol.css">
<script src="https://cdn.jsdelivr.net/npm/ol@10.10.0/dist/ol.js"></script>
Pinning the version (10.10.0 here) means a later release cannot change your page. The script defines one global, ol, so classes appear as ol.Map, ol.View and ol.layer.Vector.
The same download page marks the hosted build as not for production and recommends the npm package for that.
The stylesheet matters. Without it, the zoom buttons sit in the normal page flow instead of floating over the map.
Map, View, Layer, Source
Four terms are enough to start. The Map is the core object. It needs a View, one or more layers and a target container. The View holds the center and zoom. A layer is a stack level, and its source supplies the data.
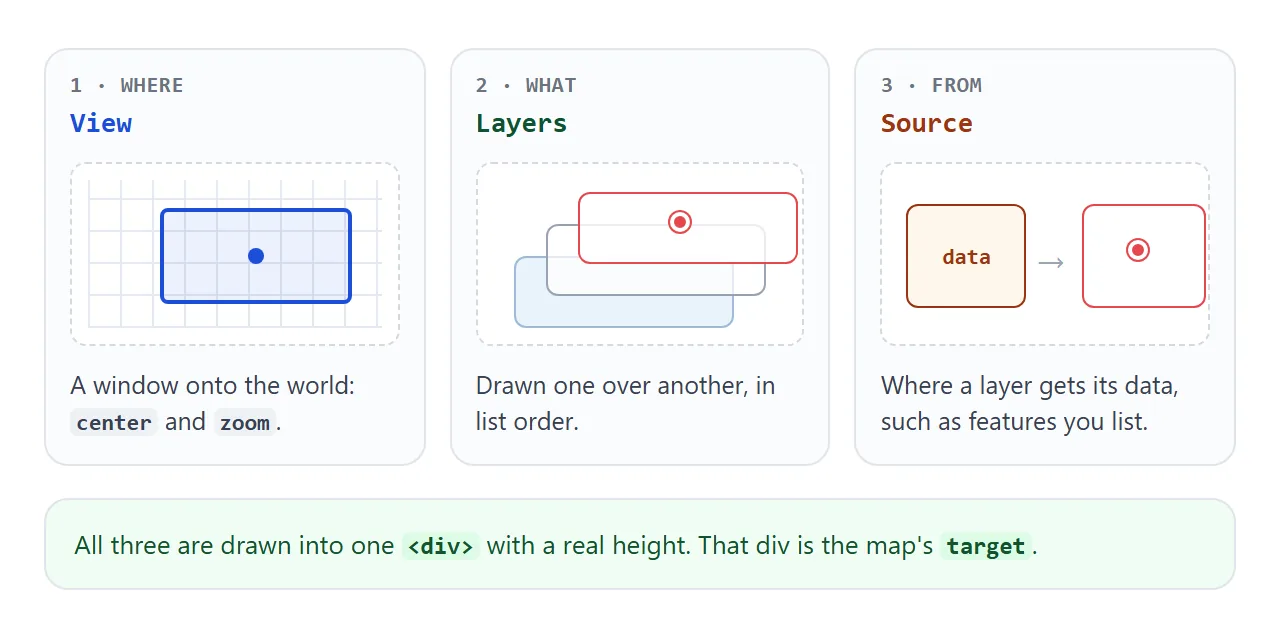
The four layer types are Tile, Image, Vector and VectorTile. This guide uses Vector layers, which draw the features held in a vector source, such as points and lines.
Longitude and latitude are not the map's coordinates
The map works in meters. Its default projection is Spherical Mercator (EPSG:3857). The numbers you copy from a map site are degrees, so they need converting.
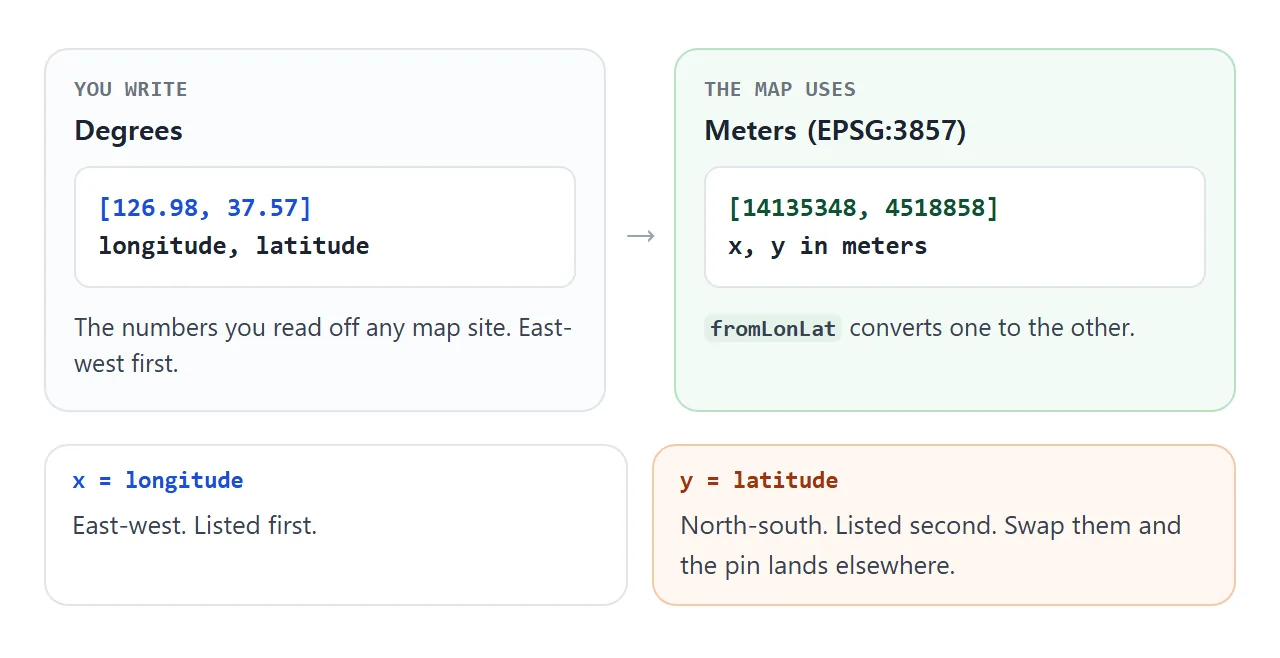
// [longitude, latitude] -> map coordinates
const center = ol.proj.fromLonLat([126.98, 37.57]);
// and back, for showing a clicked spot to a person
const [lon, lat] = ol.proj.toLonLat(center);
Keep longitude first, as GeoJSON does. If a pin shows up far from where you expect, check the order before anything else.
Make the pins respond
A map you can only look at is half done. Clicks give you a pixel and a map coordinate, and forEachFeatureAtPixel tells you which feature is under that pixel. A pointermove listener can switch the cursor to a hand over a pin.
<!doctype html>
<html lang="en">
<head>
<meta charset="utf-8">
<meta name="viewport" content="width=device-width, initial-scale=1">
<title>OpenLayers: click a marker</title>
<link rel="stylesheet" href="https://cdn.jsdelivr.net/npm/ol@10.10.0/ol.css">
<script src="https://cdn.jsdelivr.net/npm/ol@10.10.0/dist/ol.js"></script>
<style>
  body { margin: 0; font-family: system-ui, sans-serif; }
  #map { width: 100%; height: 320px; background: #eaf3fb; }
  #info { padding: 10px 14px; font-size: 15px; background: #fff; border-top: 1px solid #dde3ea; }
</style>
</head>
<body>
<div id="map"></div>
<div id="info">Click a pin, or click empty water.</div>

<script>
  const places = [
    { name: 'Seoul',  lon: 126.98, lat: 37.57 },
    { name: 'Busan',  lon: 129.08, lat: 35.18 },
    { name: 'Jeju',   lon: 126.53, lat: 33.50 }
  ];

  // Each feature carries its own data
  const features = places.map((p) => {
    const f = new ol.Feature({ geometry: new ol.geom.Point(ol.proj.fromLonLat([p.lon, p.lat])), name: p.name });
    return f;
  });

  const pin = new ol.style.Style({
    image: new ol.style.Circle({
      radius: 9,
      fill: new ol.style.Fill({ color: '#e5484d' }),
      stroke: new ol.style.Stroke({ color: '#fff', width: 3 })
    })
  });

  const map = new ol.Map({
    target: 'map',
    layers: [
      new ol.layer.Graticule(),
      new ol.layer.Vector({ source: new ol.source.Vector({ features }), style: pin })
    ],
    view: new ol.View({ center: ol.proj.fromLonLat([128, 36]), zoom: 6 })
  });

  const info = document.getElementById('info');

  map.on('singleclick', (e) => {
    // which feature, if any, is under the clicked pixel?
    const hit = map.forEachFeatureAtPixel(e.pixel, (f) => f);
    const [lon, lat] = ol.proj.toLonLat(e.coordinate);
    info.textContent = hit
      ? hit.get('name') + ' selected'
      : 'Empty spot at ' + lon.toFixed(2) + ', ' + lat.toFixed(2);
  });

  // hand cursor over a pin
  map.on('pointermove', (e) => {
    map.getTargetElement().style.cursor = map.hasFeatureAtPixel(e.pixel) ? 'pointer' : '';
  });
</script>
</body>
</html>
Each feature can carry its own properties. The demo stores a name on every pin and reads it back with get('name').
Tile layers and the one-page limit
A familiar street map is a tile layer. OpenLayers has a source for OpenStreetMap tiles, and its default address is a tile server at another site.
// Needs images from another site. Fine where that is allowed.
new ol.layer.Tile({ source: new ol.source.OSM() })
A tile layer fetches its images over the network. In NOS pages, images from other sites are blocked, so the tiles would stay blank.
That is why the demos here use vector layers and a grid. Points and lines that you list in the page itself draw fine.
OpenLayers in React
This part uses npm, so it is a guide and not a running example. The OpenLayers quickstart uses Vite with npm create ol-app, and it imports each class from its own module path.
The pattern is the same everywhere: the div is the target, the map is created once after the first render, and the cleanup detaches it.
import { useEffect, useRef } from 'react';
import Map from 'ol/Map.js';
import View from 'ol/View.js';
import VectorLayer from 'ol/layer/Vector.js';
import VectorSource from 'ol/source/Vector.js';
import { fromLonLat } from 'ol/proj.js';
import 'ol/ol.css';

export default function MapView() {
  const box = useRef(null);

  useEffect(() => {
    const map = new Map({
      target: box.current,
      layers: [new VectorLayer({ source: new VectorSource() })],
      view: new View({ center: fromLonLat([126.98, 37.57]), zoom: 6 }),
    });
    return () => map.setTarget(undefined); // release the div
  }, []);

  return <div ref={box} style={{ height: 320 }} />;
}
Three details do the work. The ref gives OpenLayers a real element. The empty dependency array builds the map once. React runs the cleanup when the component is removed, so no old map keeps pointing at the div.
If you only want to try a map, skip all that. The one-file version runs anywhere. Host a React app as a page covers what changes when the build output is the thing you share.
A finished example: a trip map
The last example puts the pieces together. Stops are features in a vector source, a dashed line joins them in order, buttons fly the view to a stop, and the page writes the stops out as GeoJSON.
<!doctype html>
<html lang="en">
<head>
<meta charset="utf-8">
<meta name="viewport" content="width=device-width, initial-scale=1">
<title>OpenLayers: trip map</title>
<link rel="stylesheet" href="https://cdn.jsdelivr.net/npm/ol@10.10.0/ol.css">
<script src="https://cdn.jsdelivr.net/npm/ol@10.10.0/dist/ol.js"></script>
<style>
  * { box-sizing: border-box; }
  body { margin: 0; font-family: system-ui, sans-serif; color: #1d2330; }
  #map { width: 100%; height: 300px; background: #eaf3fb; }
  .bar { display: flex; flex-wrap: wrap; gap: 6px; padding: 10px 12px 0; }
  button { font: inherit; font-size: 14px; padding: 6px 12px; border: 1px solid #c9d1dc; border-radius: 999px; background: #fff; cursor: pointer; }
  .row { display: flex; flex-wrap: wrap; align-items: center; gap: 8px; padding: 8px 12px; font-size: 14px; }
  pre { margin: 0 12px 12px; padding: 8px 10px; background: #f4f5f7; border-radius: 8px; font-size: 12px; max-height: 84px; overflow: auto; white-space: pre-wrap; word-break: break-all; }
</style>
</head>
<body>
<div id="map"></div>
<div class="bar" id="bar"></div>
<div class="row">
  <label><input type="checkbox" id="route" checked> Show route</label>
  <span id="count">3 stops</span>
  <button id="clear" type="button">Clear</button>
  <span style="color:#6b7280">Click the map to add a stop.</span>
</div>
<pre id="out"></pre>

<script>
  const route = new ol.layer.Vector({
    source: new ol.source.Vector(),
    style: new ol.style.Style({ stroke: new ol.style.Stroke({ color: '#1d4ed8', width: 3, lineDash: [8, 6] }) })
  });
  const stops = new ol.source.Vector();
  const stopLayer = new ol.layer.Vector({
    source: stops,
    style: (f) => new ol.style.Style({
      image: new ol.style.Circle({
        radius: 11,
        fill: new ol.style.Fill({ color: '#e5484d' }),
        stroke: new ol.style.Stroke({ color: '#fff', width: 3 })
      }),
      text: new ol.style.Text({ text: String(f.get('n')), fill: new ol.style.Fill({ color: '#fff' }), font: 'bold 12px system-ui' })
    })
  });

  const view = new ol.View({ center: ol.proj.fromLonLat([128, 36]), zoom: 6 });
  const map = new ol.Map({ target: 'map', layers: [new ol.layer.Graticule(), route, stopLayer], view });

  const bar = document.getElementById('bar');
  const out = document.getElementById('out');
  const geojson = new ol.format.GeoJSON();

  function addStop(name, lon, lat) {
    const f = new ol.Feature({ geometry: new ol.geom.Point(ol.proj.fromLonLat([lon, lat])), name });
    stops.addFeature(f);
    refresh();
  }

  function refresh() {
    const fs = stops.getFeatures();
    fs.forEach((f, i) => f.set('n', i + 1));

    // route line through the stops, in order
    route.getSource().clear();
    if (fs.length > 1) {
      route.getSource().addFeature(new ol.Feature(new ol.geom.LineString(fs.map((f) => f.getGeometry().getCoordinates()))));
    }

    // one button per stop; click flies the view there
    bar.textContent = '';
    fs.forEach((f) => {
      const b = document.createElement('button');
      b.type = 'button';
      b.textContent = f.get('n') + '. ' + f.get('name');
      b.addEventListener('click', () => {
        view.animate({ center: f.getGeometry().getCoordinates(), zoom: 8, duration: 600 });
      });
      bar.appendChild(b);
    });

    document.getElementById('count').textContent = fs.length + (fs.length === 1 ? ' stop' : ' stops');
    // export as GeoJSON, converted back to lon/lat
    out.textContent = geojson.writeFeatures(fs, { featureProjection: 'EPSG:3857', dataProjection: 'EPSG:4326', decimals: 3 });
  }

  addStop('Seoul', 126.98, 37.57);
  addStop('Busan', 129.08, 35.18);
  addStop('Jeju', 126.53, 33.5);

  map.on('singleclick', (e) => {
    const [lon, lat] = ol.proj.toLonLat(e.coordinate);
    addStop('Stop ' + (stops.getFeatures().length + 1), lon, lat);
  });

  document.getElementById('route').addEventListener('change', (e) => route.setVisible(e.target.checked));
  document.getElementById('clear').addEventListener('click', () => { stops.clear(); refresh(); });
</script>
</body>
</html>
- Fly to a stop:
view.animatetakes a new center and zoom, plus a duration in milliseconds. - Hide a layer:
layer.setVisible(false)turns the route off without deleting it. - Export:
ol.format.GeoJSONwrites features out. Pass the map's projection and the data projection so the numbers come out in degrees.
For a map with no library at all, map markers on an SVG map uses percentages on an inline drawing. Pick that when you have a floor plan or a campus drawing, and OpenLayers when you need real coordinates and zooming.
When it does not work
| What you see | Cause | Fix |
|---|---|---|
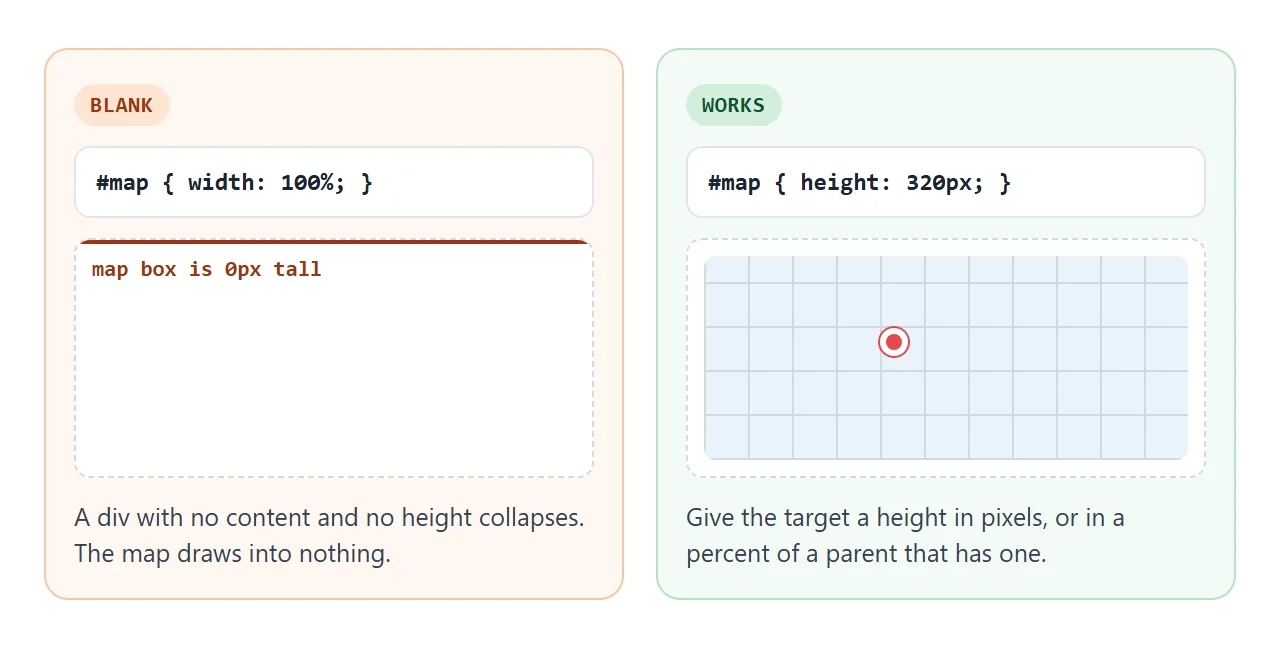
| A blank white area | The map div has no height | Set a height in pixels, or a percent of a parent with a height |
ol is not defined in the console |
The script tag is missing, below your code, or blocked | Put the tag before your script and check the URL |
| Zoom buttons sit above or below the map | ol.css is not loaded |
Add the stylesheet tag |
| Empty map with a tile layer | The tile images come from another site and are blocked | Use vector layers, or host where images are allowed |
| Pin far from where you expect | Degrees used as map coordinates, or latitude first | Wrap the pair in fromLonLat, longitude first |
| Map keeps the old size after its box changes | The viewport size was not recalculated | Call map.updateSize() |
| Two maps, or a map stuck on a blank div in React | The map is created on every render | Create it in useEffect and call setTarget(undefined) in the cleanup |
Share it as a link
A map is something people want to drag and zoom, and a screenshot cannot do either. An .html attachment may open as plain code on a phone, which opening an HTML file on a phone explains.
To send the working version, paste the page into a NOS document and choose Create share link. HTML to link walks through it.
The page renders as written and the scripts from the CDN load, so the people you send it to can pan and click the map themselves. If you change the code later, the same link shows the new version.