Two columns labeled “A” and “B” can fill up quickly without producing a useful comparison. One side lists a price, the other lists a favorite detail, and the class is left comparing different things.
Give the chart a question before you give it headings. Then put comparable details on the same row. The blank format and examples below work on paper or in an editable document; an AI-generated layout can help with formatting once you have chosen the question.
Blank template and worked example

Open the complete example · Blank PDF · Worked PDF
Download the HTML version to adapt the browser page. The worked material is fictional. Use the blank PDF for a printed activity or record; the browser preview switches between versions.
If the question asks why an event changed what followed, use a cause and effect organizer instead of forcing the explanation into two comparison columns.
A blank T-chart you can copy
Write these items at the top of the page:
Name: [ ] Date: [ ]
Question we are answering: [ ]
Left heading: [ ] Right heading: [ ]
Leave several wide rows beneath the headings. In each row, record one related pair of details. Add a small line for a page number, observation, or other source beneath each entry.
Finish with two prompts:
What does this comparison suggest? [ ]
What information is still missing? [ ]
A T-chart uses two columns to examine two aspects of a topic. A classroom T-chart resource shows its use for comparisons across reading and other subjects. The question and evidence lines here make the purpose of each entry explicit.
Filled example: where should the class hold a reading session?
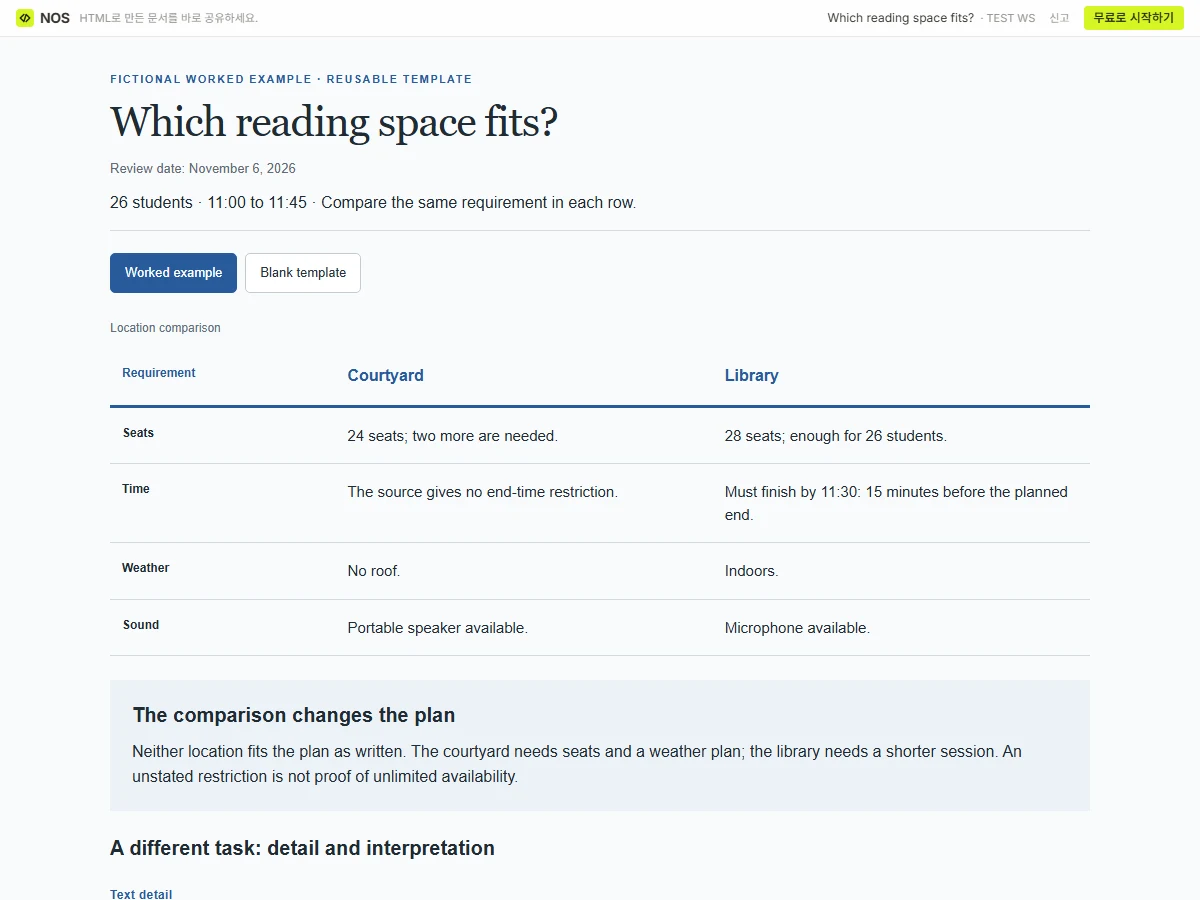
This fictional activity asks students to choose between the courtyard and the library. Give students the same short information sheet:
The courtyard has 24 seats. It has no roof, and the office can supply a portable speaker. The library has 28 seats and a microphone. The librarian says the class must finish before the next group arrives at 11:30.
Question: Which location fits a 26-student reading session planned for 11:00 to 11:45?
Use Courtyard and Library as the two headings.
- Seating row: Courtyard: 24 seats for 26 students. Library: 28 seats for 26 students.
- Timing row: Courtyard: no end-time restriction is given in the sheet. Library: the room must be free at 11:30.
- Weather row: Courtyard: no roof. Library: indoors.
- Sound row: Courtyard: a portable speaker is available. Library: a microphone is available.
Conclusion: Neither location fits the plan as written. The courtyard needs two additional seats and a weather plan. The library has enough seats, but the session would need to end 15 minutes earlier.
That conclusion follows from the supplied details. “The library is better because it is quiet” adds a fact the sheet never gave us.
Notice that an unknown stays unknown. “No end-time restriction is given” does not mean the courtyard is available all day.
Change the headings when the thinking task changes
For a decision about one proposal, use Reasons to support and Concerns to resolve. Keep the same question above both columns. A longer list on one side is not automatically a stronger case; one unresolved requirement may decide the choice.
For close reading, use Text detail and What it suggests. This version separates an observation from an interpretation:
- Text detail: “Leah put the unopened invitation back in the drawer.”
- What it suggests: Leah may be avoiding a decision about the invitation.
- Check: The line supports hesitation, but does not tell us why she is hesitant.
The sentence is an original practice example. A student working with a class text should include the actual line and its location instead.
These are different uses of the same two-column structure. Choose one before printing. A page that tries to compare locations, list pros and cons, and analyze a character at once gives students several different jobs.
Decide whether a T-chart is enough
Use a T-chart when two headings can carry the comparison. If the task specifically asks students to show shared features between two categories, a Venn diagram may fit better.
If students need to compare three options against four requirements, add a criteria column or use a comparison grid. Do not squeeze a multi-option decision into two columns just to keep the template.
For a paper handout, leave space for complete thoughts. Shorter rows encourage one-word labels such as “good” or “bad,” which may hide the reason a student made the comparison. Try filling one row yourself before making class copies.
Prompt for a chart matched to your lesson
Make a T-chart for [grade or learner group] answering this question: [question]. Use exactly these two headings: [left] and [right]. The source material is: [paste text or factual notes]. Produce a blank student version with space for entries and source references, followed by a teacher version using only the supplied material. Align comparable details by row. Keep observations separate from inferences, and label information that the source does not provide. Add one conclusion prompt and one question about missing evidence. Do not invent quotations, page numbers, costs, or outcomes. Return editable document text. Also provide a simple HTML version if I want to show the chart in a browser; keep the writing space readable when printed.
Read the teacher version before using the blank. If its conclusion needs information outside the source, revise the question or supply that information.
Keep the handout and the shared version useful
Open this example’s NOS share link.
Print the blank chart or keep it in the document format your class uses. For a projected worked example, an HTML version lets you show the comparison as a page.
Save that version in NOS if you want to send a page link to colleagues. A mislabeled column can be corrected in the saved page without sending a replacement link. The paper copies still need a correction, so make the final heading check before printing.