Decide which report you're writing
Template collections sort business reports by purpose: annual results, quarterly performance, project milestones, financial forecasts. Each one is organized around something different. An annual report covers a full year, a project report follows dates and milestones, and a quarterly report compares this period with the last one and with the target.
This guide follows a quarterly report, since it comes around every three months and repays a structure you can reuse. The same habits carry over to the other types: state the status first, put every figure next to a comparison, and end with what you need from the reader.
Check the delivery format too. If a board, lender or client asks for a PDF or DOCX attachment, use a document template and send the file they asked for. A page shared by link suits readers who just need to see the current version.
A sample quarterly report, and what to notice
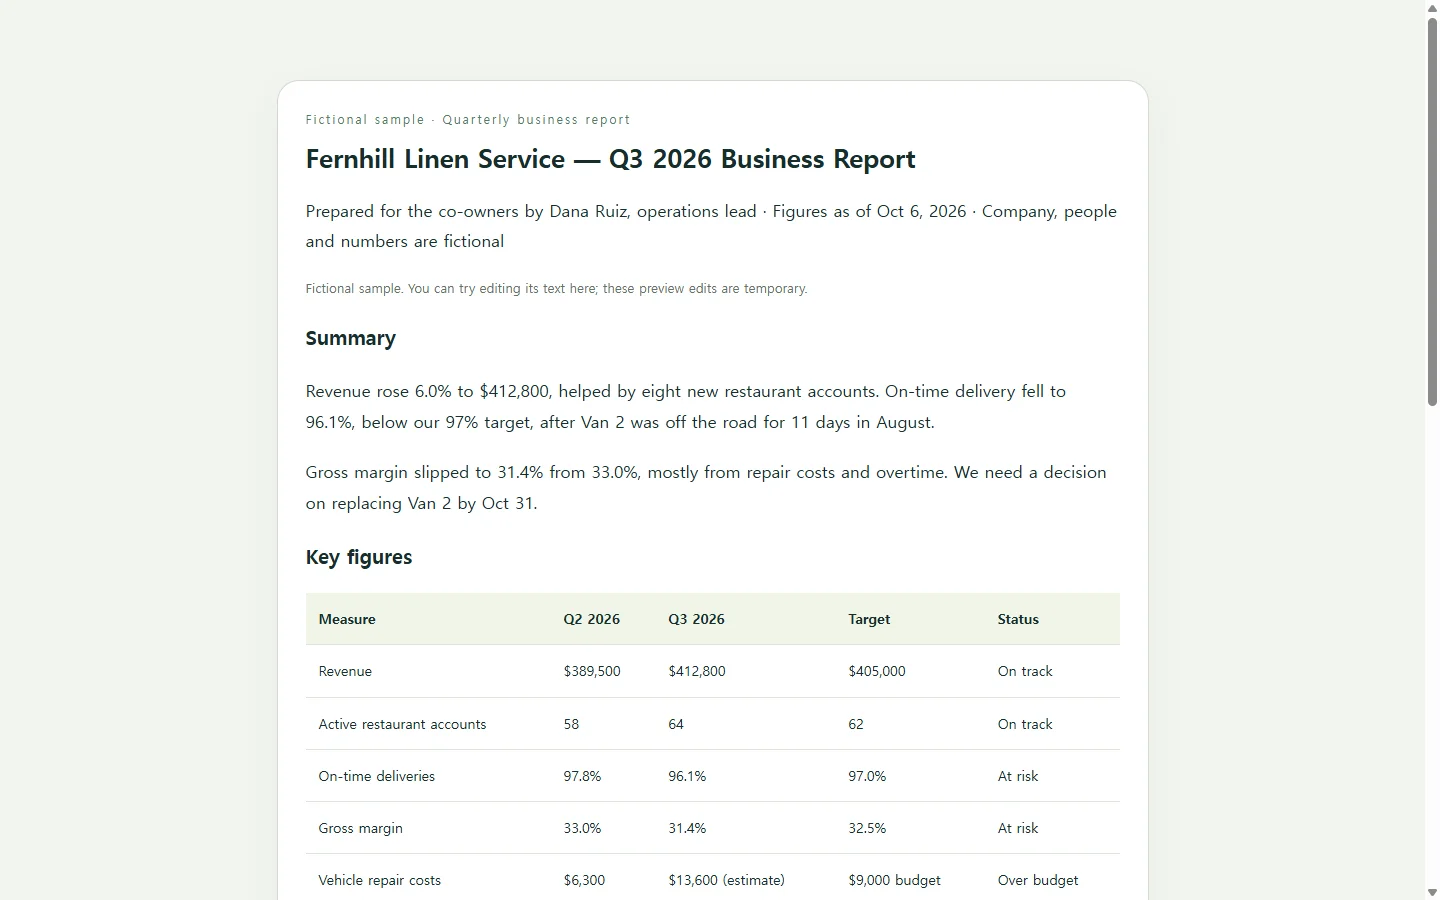
The example is a Q3 2026 report for Fernhill Linen Service, a commercial laundry that supplies restaurants. The company, people and figures are all invented.
Start with the summary. In three sentences it says how the quarter went, bad news included: revenue rose, but on-time delivery slipped below target while a van was out of service. A reader who stops there still knows where the business stands.
The table puts each figure beside last quarter and the target, with a status in words. On its own, 96.1% on-time delivery says little; next to a 97% goal, it reads as a miss worth explaining.
The report closes with the decisions it needs rather than a recap. Route-by-route detail and repair invoices go in an appendix, where readers who want them can find them.
What to gather before you build yours
Before opening a template or an AI chat, collect four things: the period and who will read it; four to six figures, each with the prior period and the target; a sentence or two on anything that missed; and the decisions or approvals you're asking for.
Keep the main table to figures your readers act on and move the rest to the appendix. Write the explanations yourself. An AI tool can tidy your wording and design the page, but it only knows what you tell it, so a visible blank is better than a confident guess.
Build it with AI (optional)
If the blank page is what's stopping you, ask an AI assistant to produce the report as a single HTML file. HTML is the code web pages are written in; a self-contained file opens in a browser and can be shared as a page.
The prompt below uses Fernhill's details as stand-ins for yours. It tells the AI to use only the numbers you supply, mark gaps instead of filling them, and keep the page readable on a phone and with a screen reader. It also rules out scripts, forms and outside connections, so the result is a plain page whose wording you can change later.
Before sending, check every figure against your spreadsheet. A transposed digit in the revenue line is the kind of mistake readers remember.
After you send it: fix the number, keep the link
Suppose that a week after you share the Fernhill report, the final repair invoice arrives at $14,200, not the $13,600 estimate in the table.
Had you emailed a file, you would correct it and send a second copy, and the owners would have two versions to tell apart. With the page in NOS, you edit the figure directly on the rendered page instead of asking AI to regenerate the report. The owners open the link they already have and see $14,200.
Editing text isn't the same as changing a calculation written in code, which is one reason the prompt asks for typed figures rather than computed ones.
Recipients don't need an account to open a shared page, so the same link works for an outside bookkeeper. Add a dated line under the summary, such as 'Updated Oct 20: repair cost corrected,' so anyone who read the first version knows what changed.
A prompt to adapt
Create a quarterly business report as one self-contained HTML file. Replace nothing yourself: every value in [brackets] below is mine and should appear as written.

Report details:
- Company: [Fernhill Linen Service, a commercial laundry that supplies restaurants]
- Period: [Q3 2026, July to September]
- Prepared by / for: [Dana Ruiz, operations lead / the two co-owners]
- Figures as of: [Oct 6, 2026]
- Summary in my words: [Revenue rose 6.0% to $412,800, helped by eight new restaurant accounts. On-time delivery fell to 96.1%, below our 97% target, after Van 2 was off the road for 11 days in August. Gross margin slipped to 31.4% from 33.0%, mostly from repair costs and overtime.]
- Figures (measure | previous period | this period | target | status):
  [Revenue | $389,500 | $412,800 | $405,000 | On track]
  [Active restaurant accounts | 58 | 64 | 62 | On track]
  [On-time deliveries | 97.8% | 96.1% | 97.0% | At risk]
  [Gross margin | 33.0% | 31.4% | 32.5% | At risk]
  [Vehicle repair costs | $6,300 | $13,600 (estimate) | $9,000 budget | Over budget]
- What changed (title: explanation): [New accounts: 8 added, 2 closed when the restaurants shut down] [Van 2 outage: transmission failure, 11 days; routes covered with overtime and a rental van] [Margin: repair costs and overtime offset the revenue gain]
- Next quarter, by month: [October: decide on a replacement van] [November: start a Saturday route for weekend brunch accounts] [December: renew the detergent supply contract]
- Decisions I need: [Approve up to $38,000 for a used replacement van by Oct 31] [Confirm a Nov 8 start for the Saturday route] [Agree to revisit the margin target after Q4]
- Appendix note: [Route-level on-time rates and repair invoices are kept in a separate note.]

Page order: title and prepared-by line; summary (my sentences, lightly edited for clarity, misses kept in); figures table with the status column; what changed as short cards; next quarter as a timeline; decisions as a checklist; appendix note last.

Rules:
- Use only the facts and numbers above. Do not calculate new totals, percentages or statuses. If something is missing, show [missing: what is needed] on the page instead of guessing.
- Plain HTML with CSS in a style element, all in one file. No JavaScript, external fonts, images, links to outside services, forms, buttons that submit anything, or data connections.
- Accessibility: one h1, headings in logical order, a real table with a caption and header cells marked with scope, status written in words (never color alone), strong text contrast against the background, body text at least 16px, a lang attribute on the html element.
- Mobile: the page must read well at 375px wide without the whole page scrolling sideways; let the table scroll inside its own container or stack each row as a card on narrow screens.
- Keep the visual style restrained: one accent color, plenty of white space, no decorative stock imagery.
- Return only the complete HTML file, nothing before or after it.