What a reviewer should be able to find
A portfolio is not strictly required for analyst roles, but it can help you stand out and show that you can work with real-world data. How you present a project matters about as much as the project itself. A reader who cannot tell what question you answered is unlikely to dig through your code to find out.
For each project, make four things easy to spot: the question, the data, what you did, and what you recommend. Add one line on your role, especially for group or course work, so nobody has to guess which parts were yours. Link the code as well, but let the write-up carry the story. Two or three projects written up this way usually say more than ten that are only listed.
Pick a home you will actually update
There is no single correct format. A repository README keeps the explanation next to the code. Notebooks combine code, text and charts in one document. A website template gets you a clean page quickly, and experienced data professionals use them too. A single HTML page, the approach here, gives you control of the layout without building a whole site.
One habit holds whichever you choose: if a job posting asks for a resume or another document as a PDF or DOCX, submit that file. The portfolio link goes in your resume header or in a field the application provides; it supports the required file and does not replace it. If you convert your resume to PDF, open the PDF and check that the formatting survived.
A finished example: one pantry project, written for a fast reader
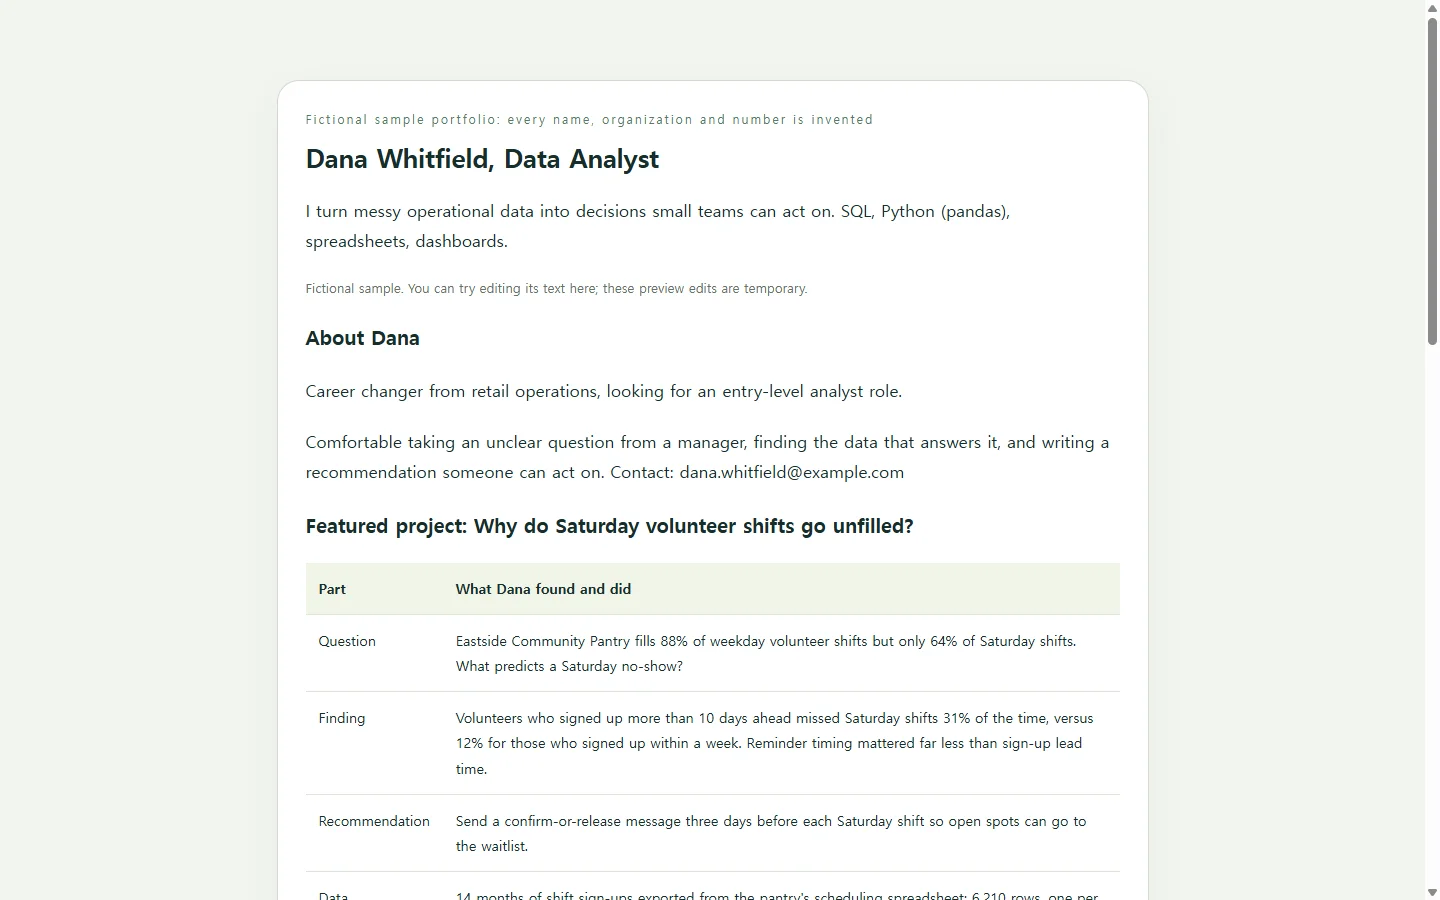
The sample below is fictional. Dana Whitfield, Eastside Community Pantry and every number on the page were invented for illustration. Dana's featured project asks why Saturday volunteer shifts at a small food pantry go unfilled, a question a hiring manager can follow without knowing anything about food banks.
Three choices are worth borrowing. The finding comes before the method, so the reader gets the answer first. A My role row separates what the pantry provided from what Dana did. And the method is written as plain steps with the code linked, not pasted. Dana's project came from a local nonprofit; projects for nonprofits or local businesses and publicly available datasets are both ways to find real-world data of your own.
You might reasonably choose differently. If visualization is your strength, lead with one chart and a one-sentence caption. If SQL is, show the one short, commented query that produced your key number. Either way, keep the thread from question to recommendation intact.
Build your version with AI, if you want the help
You can write this page in a site builder or by hand. If design is the part slowing you down, an AI chat assistant can turn your notes into HTML, the plain-text format web pages are written in. You do not need to read the code; you put the file where you plan to host the page and look at it in a browser.
Use AI to arrange and tighten your words, not to supply results. The prompt below asks for your real numbers and tells the model to flag gaps instead of filling them, so a missing row count shows up as a visible note rather than an invented figure. It also asks for a page that reads well on a phone and works with a screen reader, since you cannot choose the device a reviewer opens your link on.
When the page comes back, check three things before sending it anywhere: every number matches your final analysis, nothing still says [ADD: ...], and headings and findings are spelled correctly. Then open it on your own phone.
After you send it: one link that stays current
Say you put the page's link in your resume header and applied to five roles. Two days later you notice the featured finding says Sunday where it should say Saturday, or you finish a second project worth showing. If the portfolio went out as an attachment, a fix only reaches the applications you send next.
If the page lives in NOS, you can click into the rendered text and correct the word directly, without asking AI to regenerate the whole page. The published sharing link stays the same after the edit, so the address in resumes you already submitted opens the corrected page. The people you send it to can open it without creating an account. Direct editing covers the words on the page; if you later add interactive charts, treat changes to their calculations as a separate job.
Start with your strongest project. Fill in the prompt with your real numbers, check the page on your phone, and put that one link on the resume you are about to send.
A prompt to adapt
Build a one-page data analyst portfolio as a single HTML file.

My details (use exactly these and invent nothing):
- Name and target role: [YOUR NAME], [TARGET ROLE, e.g. entry-level data analyst]
- One-line summary: [e.g. I turn messy operational data into decisions small teams can act on]
- Tools I actually used: [e.g. SQL, Python (pandas), spreadsheets, a dashboard tool]
- Contact: [EMAIL], [LINKEDIN URL], [CODE REPOSITORY URL]

Featured project:
- Question: [e.g. Why do Saturday volunteer shifts go unfilled at a small food pantry?]
- Data: [SOURCE, TIME SPAN, ROW COUNT, e.g. 14 months of shift sign-ups, 6,210 rows]
- What I did: [CLEANING, JOINS, ANALYSIS STEPS]
- Key finding with numbers: [e.g. sign-ups made 10+ days ahead missed Saturday shifts at 31% vs 12% for sign-ups within a week]
- Recommendation: [WHAT I PROPOSED AND TO WHOM]
- My role: [SOLO OR TEAM; WHICH PARTS WERE MINE]
- Code link: [URL]
- Chart description: [ONE SENTENCE ON WHAT THE CHART SHOWS]

Two shorter projects (for each: title, one-sentence result, tools, link, my role): [PROJECT 2] / [PROJECT 3]

Output requirements:
- One self-contained HTML file with all CSS in a <style> tag. No JavaScript, no external fonts, scripts, images or APIs, and no contact form.
- Order: header with name, role, summary and contact links; featured project as a table with rows Question, Data, What I did, Finding, Recommendation, My role; then a short numbered method; then the shorter projects as cards.
- Put the finding before the method in the featured project.
- Wherever I have not given a fact, write [ADD: what is missing] instead of making it up. Do not add metrics, employers, testimonials, certifications or outcomes I did not provide.
- Accessibility: exactly one h1 and headings in logical order; a real <table> with <th> header cells; text contrast of at least 4.5:1; never use color alone to carry meaning; descriptive link text instead of 'click here'; present my chart description as a text caption, not as an image.
- Mobile: single column below 640px wide; body text at least 16px; the table scrolls horizontally inside its own container instead of widening the page; links and buttons at least 44px tall.
- Plain, confident language with no buzzwords.
Return only the HTML.