What an HTML report is, in practice
HTML is the markup that gives a web page its structure: headings, paragraphs, lists and tables. Presentation, such as color, spacing and layout, comes from CSS. Results arranged in rows and columns are tabular data, which HTML organizes into tables. Use a real table rather than a screenshot of your spreadsheet.
Some reporting tools generate these files for you. They start from an HTML template and insert data when the report is created, and at least one of them delivers the result as a .zip of HTML and image files. If your test framework already produces a report like that, keep it for the engineers. The page in this guide is the short written summary that sits on top of it for everyone else.
A worked example: a release QA summary
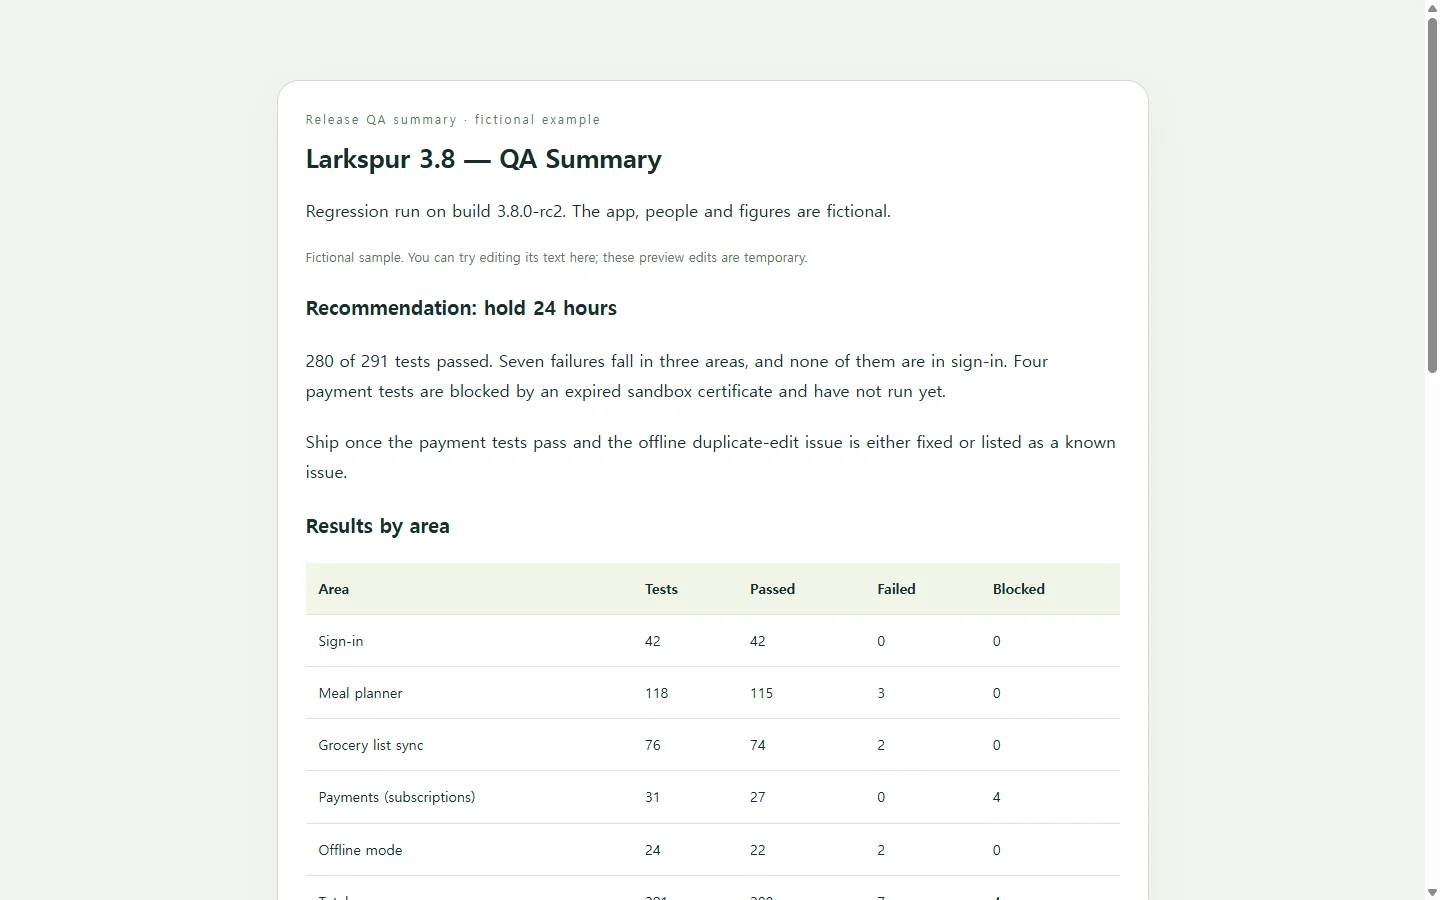
The example below is a QA summary for Larkspur 3.8, a fictional recipe-planning app. The people, issues and test counts are invented to show the layout. Replace all of them with your own.
Two choices in it are worth copying. First, the recommendation comes first, in plain words, so a reader who stops after one paragraph still knows the answer. Second, failed tests and blocked tests are counted separately. A failure means the app did something wrong, while a blocked test never ran, and each one needs a different follow-up.
Each open issue also names an owner and a next step. That turns the report from a scoreboard into a to-do list someone can act on.
Three ways to build your own
If everyone reading is an engineer, the report your test tool already generates may be enough, with a two-line note in the team channel. That is the least work.
If you write HTML and CSS, building the page by hand gives you full control, and a summary this size fits in one sitting. The cost is styling time: a table that works on a phone and status labels that read clearly take longer than they look.
The third route is to give an AI assistant your real numbers and let it handle the markup. This works well when you know what the page should say but don't want to spend the afternoon on layout. The numbers and the judgment call still have to come from you. If an assistant fills gaps with plausible-looking figures, your report is wrong.
A prompt you can paste
Replace each bracketed field before you send the prompt. The sample values show the format and come from the fictional example. The prompt asks for one self-contained file, accessible table markup and a layout that still reads on a narrow screen, since someone may open a release summary on a phone.
When the page comes back, check three things before you share it. Make sure the totals row matches your rows. Make sure every status appears as a word, not only as a color. And make sure the table stays usable when you narrow the browser window to phone width.
Build a one-page HTML report that summarizes a QA test run for a software release. Use only the facts I give below. If a value is missing, show [TBD] instead of inventing one.

Release: [App name and version, e.g. Larkspur 3.8]
Build and run date: [e.g. 3.8.0-rc2, run on Oct 9]
Audience: [e.g. product manager, support lead, engineering manager]
Recommendation: [Ship / Hold / Ship with known issues, plus one sentence of reasoning]

Results by area (area, total, passed, failed, blocked):
[e.g. Sign-in, 42, 42, 0, 0]
[e.g. Payments, 31, 27, 0, 4]
[one line per area]

Open issues (status, title, one-sentence description, owner, next step):
[e.g. Blocked, Payments sandbox certificate expired, 4 subscription tests could not run, Priya Nair, renew the certificate and rerun the Payments suite]
[one line per issue]

Conditions to ship:
[one per line]

Requirements:
- One self-contained .html file with all CSS in a <style> tag. No external fonts, scripts, images, CDNs, forms or network requests.
- Put the recommendation in the first section, directly under the page title.
- Put results in a real <table> with a <caption>, column headers marked up as <th scope="col">, and a totals row. Calculate the totals from my rows, and tell me separately, outside the HTML, if any row doesn't add up (passed + failed + blocked should equal total).
- Show every status as a text label (Passed, Failed, Blocked). Color may support the label but must never be the only signal. Keep text contrast high against its background.
- Use a logical heading order: one h1 for the report title and h2 for each section.
- Mobile: the page must be readable at 360px wide with no page-level horizontal scrolling. The table may scroll inside its own container or stack into labeled rows.
- Print: remove decorative backgrounds when the page is printed.
- Plain, neutral wording. Don't add claims, metrics, names or dates I didn't provide.
Return only the complete HTML file.
When a result changes after you've shared it
Say the sandbox certificate is renewed the next morning and all four blocked payment tests pass. The Payments row, the totals and the first ship condition all change, and the people who read yesterday's version need the new numbers.
If the page lives in a NOS workspace, you can edit the rendered text directly. Change Payments to 31 passed and 0 blocked, update the totals to 284 passed and 0 blocked, and mark the payment condition as done. You don't need to ask an AI to regenerate the page. These are text edits, so nothing recalculates on its own. Change every number that depends on the one you fixed. The shared link stays the same after you edit, so anyone who already has it sees today's numbers when they open it. They don't need an account to view it.
If your release process requires a PDF attached to the ticket, attach the PDF. A link doesn't replace a required file. The shared page is for the people following along, so the latest status lives at one address instead of in a thread of re-sent attachments.