What a project dashboard should answer
Template guides describe a typical project dashboard as covering task status and priority, percent complete, a timeline of start and finish dates, budget spent against plan, and pending items such as decisions and change requests. Some dashboard tools color statuses red, yellow and green so problems stand out.
You don't need every piece. Start from what your reader will act on. A sponsor approving spend needs the budget; a team lead reassigning work needs owners and dates. If something on the page wouldn't change anyone's next step, cut it.
One design choice is worth making early: put a word next to every color. "At risk" in amber still reads correctly on a phone, on a grayscale printout, or for a colleague who can't tell red from green.
Spreadsheet, software or a single page
There are three reasonable routes. Downloadable spreadsheet and slide templates include charts that update once you enter your task data. That suits teams already working in spreadsheets. Project management software builds dashboards from the tasks your team updates inside it. The view stays current as long as everyone keeps their work there.
The third route is a single web page built from the list you already have. An AI assistant handles the layout, you supply the facts, and nobody has to learn a new tool. The trade-off is that the page doesn't pull data on its own; you update it when things change.
Whichever you choose, check what your stakeholders require. If a sponsor or program office expects a PDF or slide report in a set format, send that. A dashboard page can sit beside it, not replace it.
Example: a fictional six-week office move
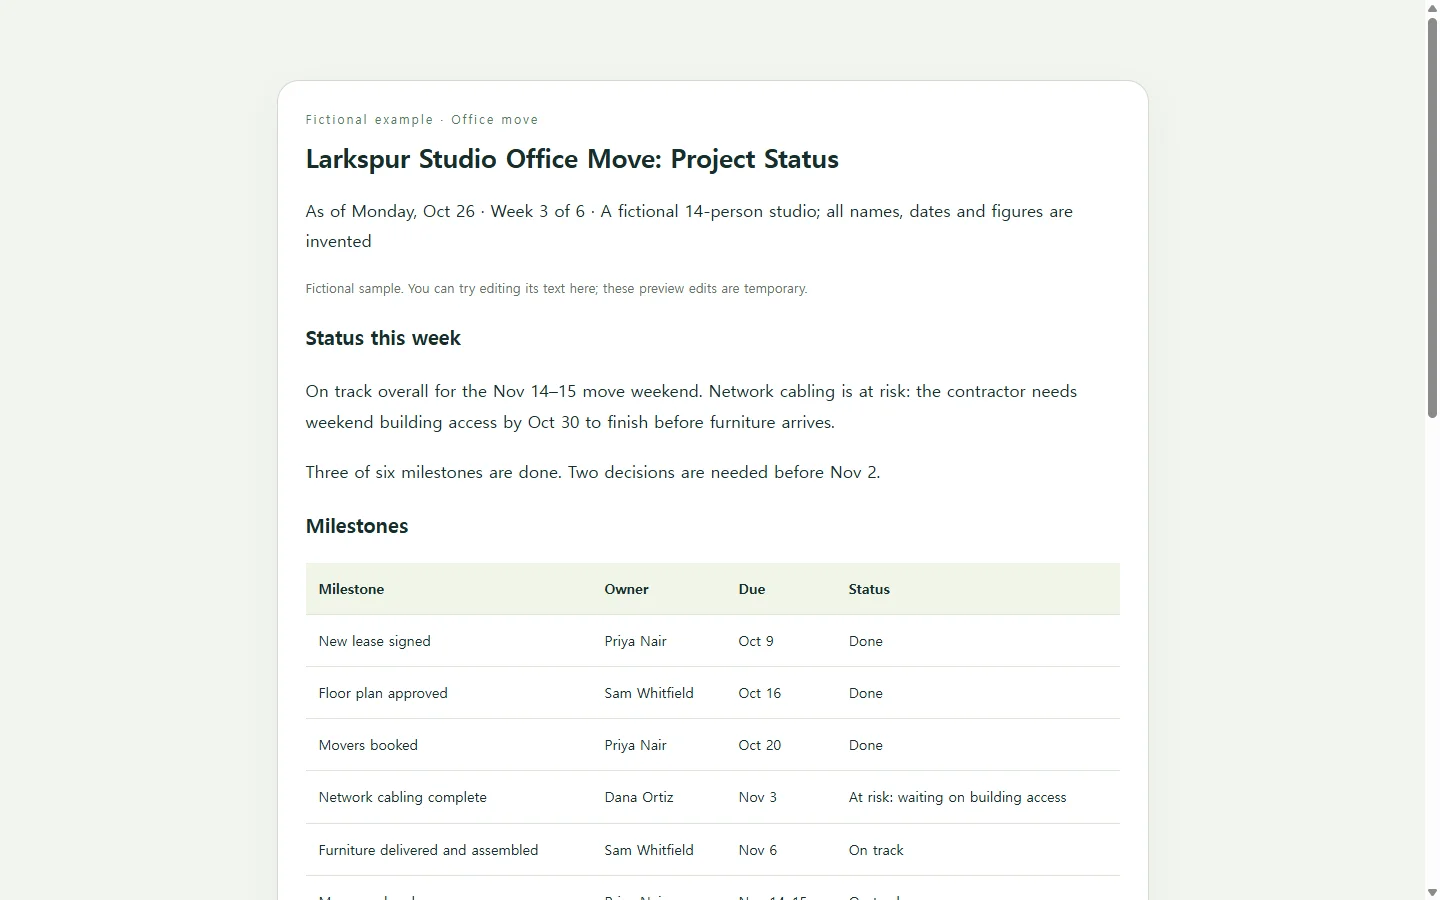
The example below tracks a made-up 14-person design studio moving to a new floor. The company, people, dates and dollar figures are invented for illustration.
Notice the order. The status sentence comes first, so a reader who stops there still knows the move is on track overall with one risk. Each milestone row carries an owner, a date and a status word. The budget compares committed money with the plan instead of only what has been paid, because signed contracts are what limit your options.
The decisions block deserves the most care. Each card names what needs deciding, who decides and by when, which gives the reader something to do rather than just something to read.
Build your own with an AI assistant
Before you open a chat, gather the facts only you know: project name, the date of this update, milestones with owners and due dates, budget lines, and open decisions. The AI should arrange these, not fill gaps, so the prompt tells it to show TBD instead of guessing.
The output is HTML, the plain-text format a web browser displays as a page. You don't need to write any of it, but do open the result in a browser once and check every number against your source list.
The prompt also asks for totals written as plain text rather than calculated by script. That keeps figures easy to verify and easy to change by hand later.
Replace the bracketed fields in the prompt below, then paste your rows where indicated.
After you share it: edit the words, keep the link
Back to the office move. The coordinator sends the dashboard link to the managing partner on Monday. On Wednesday, the furniture vendor pushes delivery from Nov 6 to Nov 10.
With an attached file, that change means editing, re-exporting and resending, then hoping the partner opens the newest copy instead of Monday's. Keeping one current copy, rather than the same date scattered across versions, means a slip needs only one update.
If the page is kept in a NOS workspace, the coordinator can change the delivery date and status word directly on the rendered page, without asking the AI to regenerate it. The published link stays the same after the edit, so the link from Monday now shows Nov 10 and the new status. The partner can open it without an account.
Direct editing changes text. If your page computes anything with script, don't assume a typed number will recalculate; check the result after editing. With totals written as plain text, as the prompt asks, the figure you edit is the figure people see.
A prompt to adapt
Build a project dashboard as one self-contained HTML file for the project below.

Project: [PROJECT NAME]
Status as of: [DATE]
Overall status in one sentence: [e.g., On track overall; network cabling at risk]
Main reader: [WHO READS IT, e.g., managing partner]

Milestones (name | owner | due date | status: Done / On track / At risk / Late | note):
[PASTE ROWS]

Budget (category | planned | committed | note):
[PASTE ROWS]
Total planned: [TOTAL PLANNED]
Total committed: [TOTAL COMMITTED]

Decisions needed (decision | who decides | decide by | what happens if it waits):
[PASTE ROWS]

Requirements:
- Use only the facts above. Do not add tasks, people, dates, amounts or percentages. If a value is missing, show "TBD".
- Order: title and as-of date, the one-sentence status, milestones table, budget table with my totals, decisions needed.
- Write every number, including totals, as plain text exactly as I gave it. Do not calculate anything with JavaScript.
- Every status shows its text label; color may support the label but never replaces it.
- Use dark text on light backgrounds with strong contrast, a clear heading order, and HTML tables with header cells.
- Mobile: the page must read cleanly at 375px wide with no sideways page scrolling; on narrow screens a table may scroll inside its own container.
- No external fonts, scripts, images or network requests. No forms, buttons, download, export or sync features.
- Return only the complete HTML file.