A list of projects isn't a portfolio yet
A project portfolio is a set of projects, programs and related work managed together to reach an organization's strategic objectives. What separates it from a project plan is the question it answers. Project management is about delivering each project well; portfolio management is about choosing which projects to do and when.
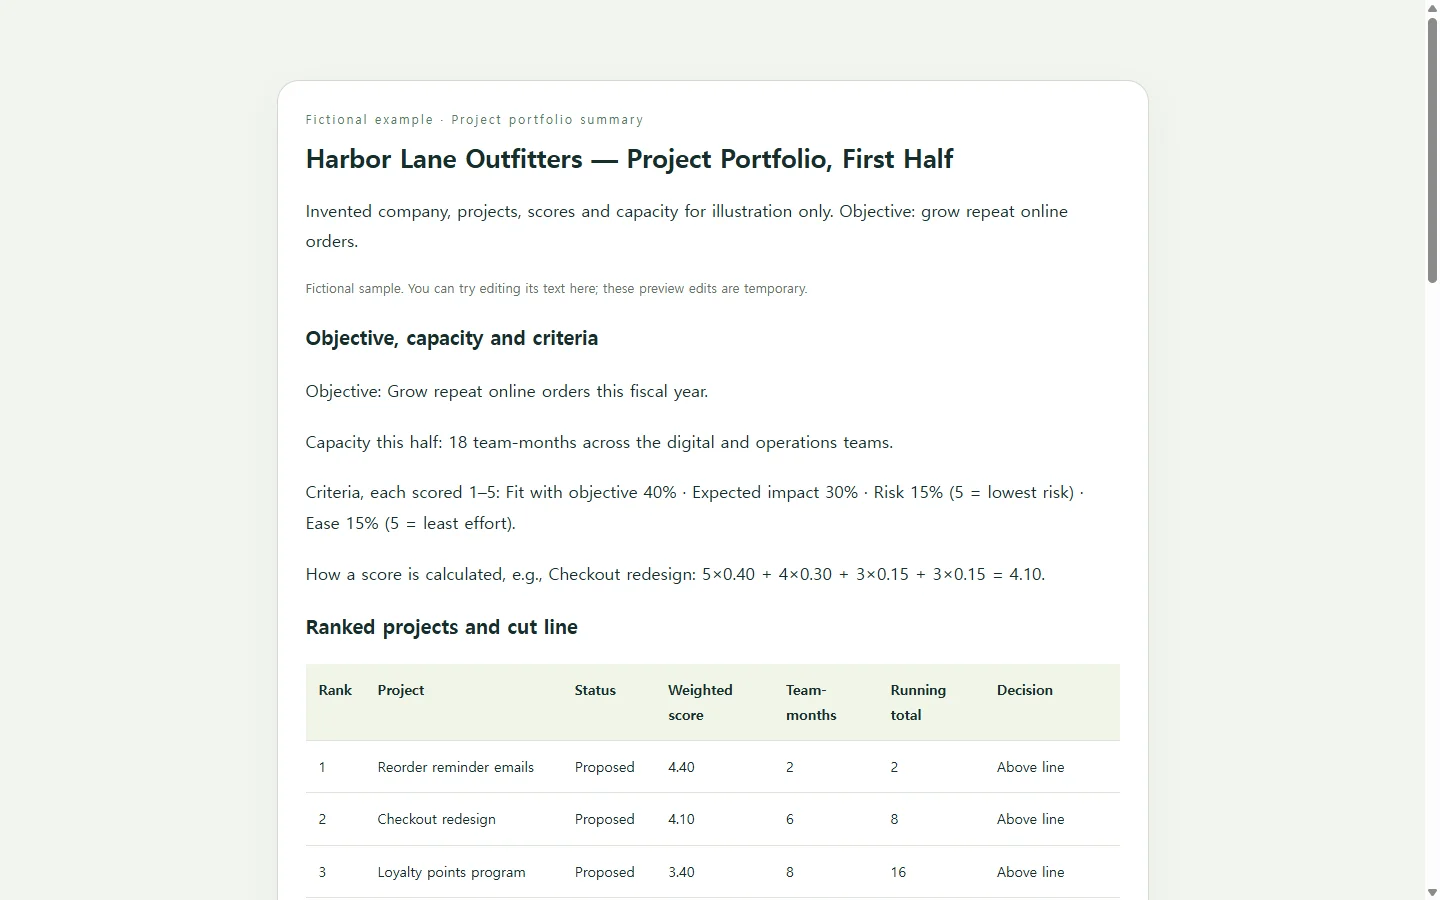
That choice exists because there is rarely enough to go around. It's common for an organization to have more project work than people and money to do it, and for leaders to struggle to say no. A portfolio page earns its spot on the agenda by making each no visible, with a reason next to it.
Three decisions to make before any layout
First, name the objective the portfolio serves. If you can't state it in one sentence, settle that before scoring anything, because every score depends on it.
Second, choose how you'll compare projects. One practitioner paper on portfolio management advises limiting yourself to four to ten criteria so the data stays manageable. Criteria can be financial, like expected return, or a weighted score from 1 to 5; either beats having no structured criteria. Put in-progress projects on the list alongside new proposals, since they draw on the same people.
Third, rank by score and add up the resources each project needs, from the top down, until the available capacity runs out. That point is the cut line. Treat it as the opening position for discussion, not a verdict: no set of criteria captures every real-world constraint, so the people in the review adjust it with judgment.
A worked example: one fictional retailer
The example below uses an invented company, Harbor Lane Outfitters, with made-up projects, scores and capacity. Its objective is to grow repeat online orders, and it has 18 team-months to spend this half.
Two things matter more than the layout. The inventory system upgrade is already underway, yet it lands below the line—exactly the kind of result a review should debate rather than accept quietly. And every project above the line faces customers. That's a balance question: a portfolio that maximizes total score can still be lopsided on risk, timing or focus. Your own page should name tensions like these in plain words beside the numbers.
Spreadsheet, slides, software or a single page
Keep the scoring in a spreadsheet whichever way you present it; that's where the math is easiest to check. If your review process expects a slide deck or a PDF in the meeting packet, deliver that format rather than swapping in a link. Dedicated portfolio management software offers dashboards, templates and scenario comparisons for organizations running many projects at once; for a first portfolio of five or ten projects, it may be more than you need right now.
A single web page suits a narrower case: when the ranked view has to be read outside the meeting—by project owners, or by someone checking what got deferred—and read comfortably on a phone.
Letting AI lay out the page
Your part is the facts: the objective, the criteria and weights, each project's scores, resource estimates and status. The AI's part is arranging them into something readable. Ask for an HTML file—the format web pages are written in, which you can open in a browser—and give it only data you've checked, with an instruction not to fill gaps on its own.
The prompt below spells out the table, the cut line, and requirements for screen readers and narrow phone screens. When the page comes back, recompute two or three weighted scores by hand and confirm the running total and cut line match your spreadsheet. A layout that looks finished can still carry a wrong sum.
After the review: change the words, keep the link
The review rarely leaves the ranking untouched. Suppose leadership trims the loyalty program to a three-team-month first phase so the inventory upgrade fits above the line. That changes a few words and numbers on a page that already exists; it's not a reason to ask the AI to rebuild it.
If the page lives in NOS, you can edit those figures directly in the rendered text. The link you shared before the meeting stays the same, so project owners who saved it see the revised cut line instead of last month's version, and they can open it without an account.
One caution: on a page like this, scores and totals are plain text, not live formulas. When a number changes, re-rank in your spreadsheet and update every figure that depends on it. A common recommendation is a full portfolio review on a set schedule, such as quarterly or annually, with change requests handled in between; the same page and link can carry each revision.
A prompt to adapt
Build a one-page project portfolio summary as a single self-contained HTML file.

Use ONLY the data below. Do not invent projects, scores, owners, dates, budgets or results. If anything is missing, show 'TBD' and list it under 'Missing data' at the bottom.

Organization: [ORGANIZATION NAME, e.g., Harbor Lane Outfitters]
Portfolio objective: [ONE SENTENCE, e.g., Grow repeat online orders this fiscal year]
Capacity available: [AMOUNT AND UNIT, e.g., 18 team-months this half]
Criteria and weights: [LIST, e.g., Fit with objective 40%; Expected impact 30%; Risk 15% (5 = lowest risk); Ease 15% (5 = least effort)]
Projects, one per line (name | status | score per criterion, 1-5, in the order above | resource estimate | owner):
[PASTE ROWS, e.g., Checkout redesign | Proposed | 5, 4, 3, 3 | 6 | E. Ruiz]
Notes for the review: [YOUR OPEN QUESTIONS, e.g., Inventory upgrade is in progress but falls below the line]

Calculations:
- Weighted score = sum of (criterion score x weight), shown to two decimals.
- Rank projects from highest to lowest weighted score.
- Running total = cumulative resource estimate in ranked order.
- The cut line falls after the last project whose running total does not exceed the capacity.
- Under the table, show the calculation for each weighted score in one short line so I can check it.

Page content, in this order:
1. Header: organization, objective, capacity.
2. A two- or three-sentence summary of what sits above and below the cut line.
3. Main table: rank, project, status, weighted score, resource estimate, running total, decision ('Above line' or 'Below line').
4. The cut line as its own clearly labeled table row stating the capacity, not shown by color alone.
5. 'Balance check': two to four short observations drawn only from the data and my notes.
6. 'Questions for the review': my notes as a list.

Accessibility:
- Headings in logical order (one h1, then h2).
- A real <table> with a <caption> and header cells using scope.
- Every status and decision written as text; never rely on color alone.
- Body text at least 16px; text and background contrast meeting WCAG AA.

Mobile:
- Readable at 360px wide with no sideways scrolling of the whole page.
- Either let the table scroll horizontally inside its own container or switch to stacked rows on narrow screens.

Technical:
- Inline CSS only. No JavaScript, external fonts, images, scripts, forms or network requests.
- Neutral, plain wording. No marketing language, icons or decorative filler.