Streamlit은 슬라이더, 표, 차트가 포함된 데이터 앱을 구축하기 위한 오픈 소스 Python 프레임워크입니다. (동영상 스트리밍과는 아무런 관련이 없습니다.)
일반 Python 스크립트를 작성하고 streamlit run로 시작하면 로컬 서버가 브라우저에서 앱을 엽니다. Python은 해당 서버에서 계속 실행되기 때문에 Streamlit 앱은 단일 HTML 파일이 아니며 페이지를 저장해도 HTML 파일이 제공되지 않습니다.
하나의 파일로 끝내는 방법에는 두 가지가 있습니다. stlite는 Streamlit 자체를 브라우저에서 실행합니다. 또는 다음 예와 같이 일반 HTML 및 JavaScript로 작은 앱을 다시 빌드합니다.
<!doctype html>
<html lang="en">
<head>
<meta charset="utf-8">
<meta name="viewport" content="width=device-width, initial-scale=1">
<title>Hello app</title>
<style>
  body { margin: 0; padding: 20px; font-family: system-ui, sans-serif; background: #fff; color: #262730; }
  label { display: block; font-size: 14px; margin-bottom: 6px; }
  input {
    width: 100%; max-width: 320px; box-sizing: border-box;
    padding: 9px 11px; font: inherit; border: 1px solid #d5d7de; border-radius: 8px; background: #f0f2f6;
  }
  #out { margin-top: 18px; font-size: 18px; }
  .note { margin-top: 18px; font-size: 13px; color: #6b7080; }
</style>
</head>
<body>
<label for="name">Your name</label>
<input id="name" autocomplete="off">
<p id="out"></p>
<p class="note">The same app as three lines of Streamlit, with no Python server.</p>

<script>
  const name = document.getElementById('name');
  const out = document.getElementById('out');

  // Streamlit reruns the script on every change; here render() plays that part
  function render() {
    out.textContent = 'Hello, ' + (name.value.trim() || 'world');
  }

  name.addEventListener('input', render);
  render();  // first run, like opening the app
</script>
</body>
</html>
동일한 앱의 Python 버전은 세 줄로 구성됩니다.
import streamlit as st

name = st.text_input("Your name")
st.write("Hello,", name or "world")
Streamlit 앱에 서버가 필요한 이유
pip를 사용하여 Streamlit을 설치하고 명령줄에서 앱을 시작합니다.
pip install streamlit
streamlit run streamlit_app.py
문서에는 로컬 Streamlit 서버가 회전하고 앱이 새 브라우저 탭에서 열린다고 나와 있습니다. server.port를 변경하지 않는 한 서버는 포트 8501에서 수신합니다.
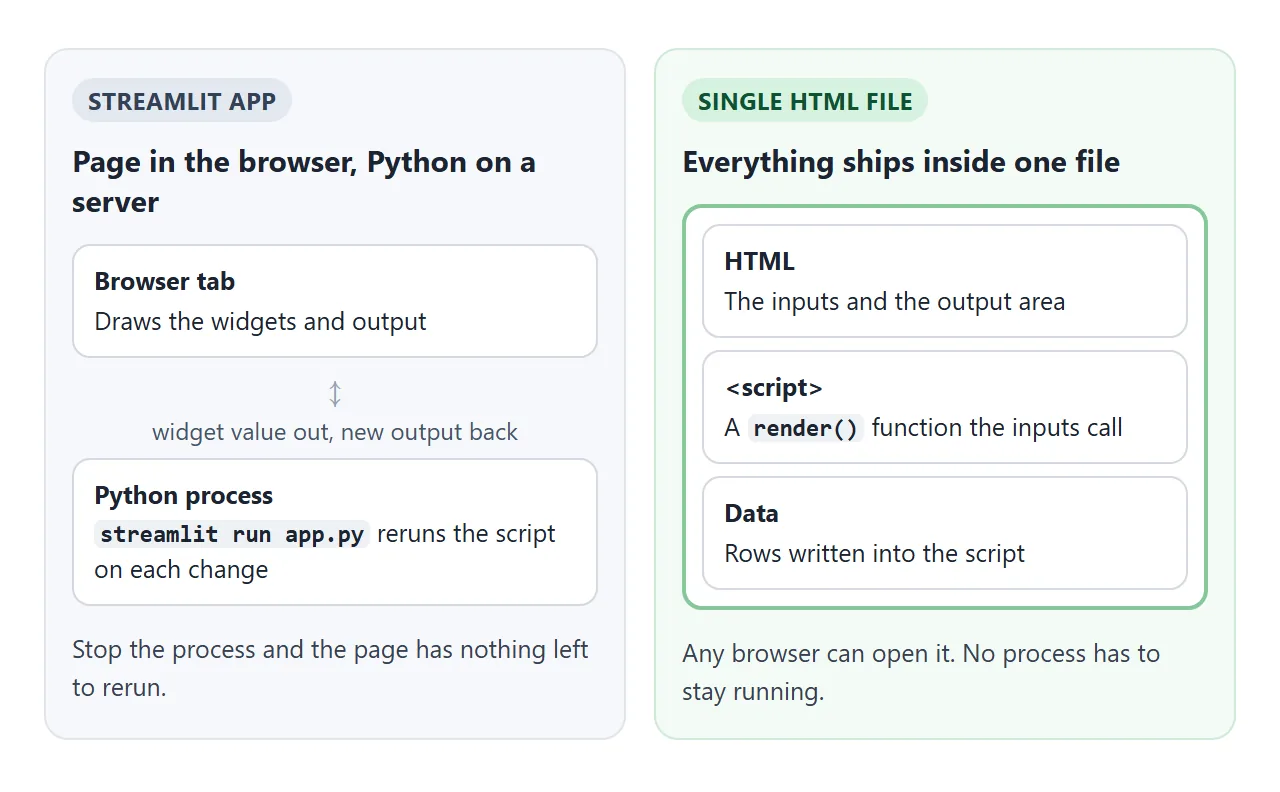
브라우저 탭은 위젯을 그리고 출력을 표시합니다. 문서에 따르면 화면에서 무언가를 업데이트해야 할 때마다 Streamlit은 전체 Python 스크립트를 위에서 아래로 다시 실행합니다. 재실행은 Python 프로세스에서 발생하므로 재실행 없이는 페이지를 업데이트할 수 없습니다.
옵션 1: 브라우저의 stlite, Streamlit
stlite는 Apache 2.0 라이센스에 따라 Python을 WebAssembly로 포트하는 Pyodide에서 Streamlit을 실행하는 오픈 소스 프로젝트입니다. README는 하나의 HTML 파일에 전체 앱을 표시합니다. 아래 버전은 우리가 테스트한 버전입니다.
<link rel="stylesheet"
  href="https://cdn.jsdelivr.net/npm/@stlite/browser@1.9.2/build/stlite.css">
<script type="module"
  src="https://cdn.jsdelivr.net/npm/@stlite/browser@1.9.2/build/stlite.js"></script>

<streamlit-app>
import streamlit as st
name = st.text_input("Your name")
st.write("Hello,", name or "world")
</streamlit-app>
테스트에서는 인터넷 접속이 가능한 Chromium에서 로컬 파일로 열렸으며 약 5초 후에 앱이 표시되었습니다. Python은 자체 서버 없이 브라우저 탭 내에서 실행됩니다.
README에는 예상되는 내용이 나열되어 있습니다. Pyodide는 기본적으로 CDN에서 로드되며 Python 패키지는 micropip를 통해 PyPI에서 설치됩니다. time.sleep()는 아무것도 하지 않습니다. asyncio.sleep()를 사용하세요. Pyodide용으로 빌드되지 않은 바이너리 확장이 포함된 패키지는 설치할 수 없습니다.
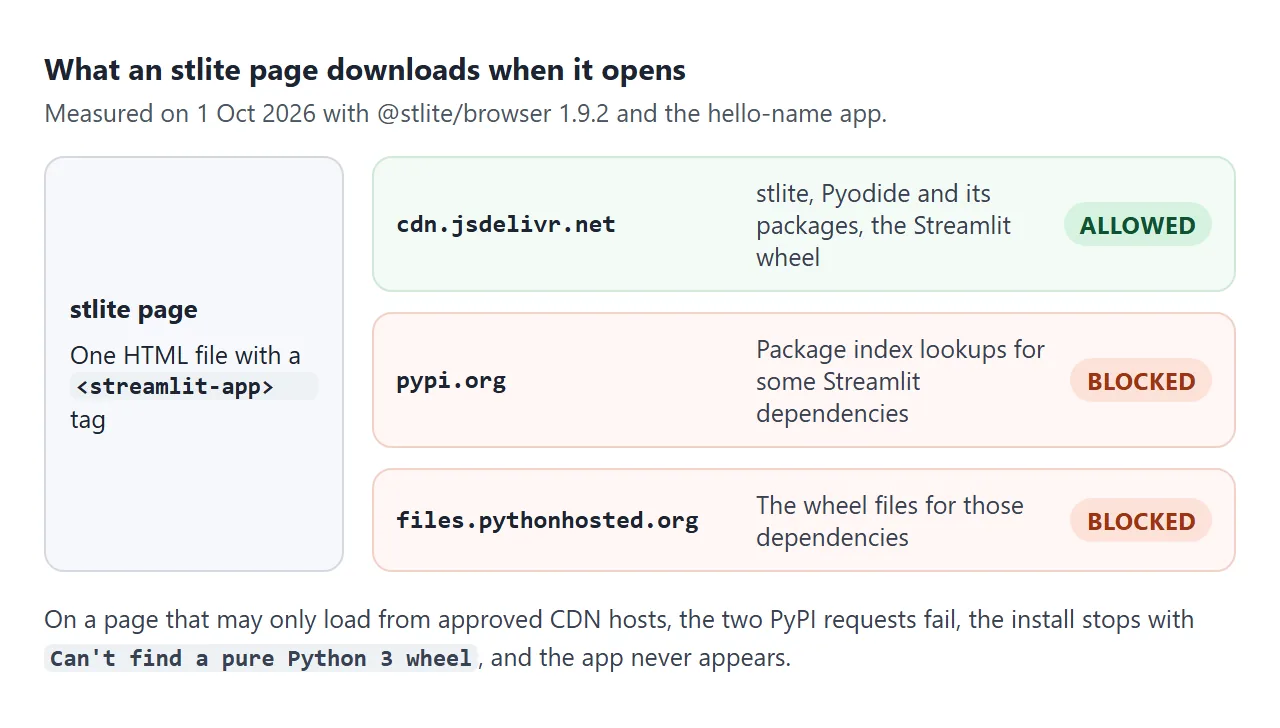
PyPI 단계는 공유에 중요합니다. 테스트에서 페이지는 cdn.jsdelivr.net, pypi.org 및 files.pythonhosted.org에서 파일을 가져왔습니다. CDN 호스트에만 연결할 수 있는 경우 "순수한 Python 3 휠을 찾을 수 없습니다."라는 메시지와 함께 설치가 중지되고 앱이 나타나지 않습니다.
옵션 2: 일반 HTML로 앱 다시 빌드
몇 가지 입력, 필터, 숫자 및 차트가 포함된 작은 앱이 직접 번역합니다. 각 위젯은 HTML 컨트롤이 되고 재실행은 하나의 JavaScript 함수가 됩니다.
| 스트림라이트 | 일반 HTML 및 JavaScript |
|---|---|
st.text_input |
<input type="text"> |
st.slider |
<input type="range"> |
st.selectbox |
<select> 및 <option> |
st.checkbox |
<input type="checkbox"> |
st.button |
<button> |
st.metric |
<b>의 큰 숫자 |
st.dataframe |
어레이로 구축된 <table> |
st.bar_chart |
인라인 SVG 또는 CDN의 차트 라이브러리 |
st.session_state |
render() 외부에서 선언된 변수 |
빌드하려면 다음을 수행하세요.
- 위젯을 나열합니다. 스크립트가 사용하는 모든
st.위젯을 기록하고 테이블에서 일치하는 컨트롤을 선택합니다. render()함수를 하나 작성합니다. 스크립트 본문과 마찬가지로 현재 값을 읽고 모든 출력을 다시 그립니다.- 변경할 때마다 다시 실행합니다. 각 컨트롤의
input또는change리스너에서render()를 호출하고 페이지 로드 시 한 번 호출합니다. render()외부 상태를 유지하세요. 재실행 후에도 유지되어야 하는 값은 함수 위에 선언된 변수에 있습니다.
재실행 모델과 상태가 존재하는 곳
JavaScript 버전은 모든 것을 다시 실행하는 Streamlit의 습관을 유지합니다. 즉, 모든 변경 후에 호출되는 하나의 함수로 모든 것을 다시 계산하고 다시 그립니다.
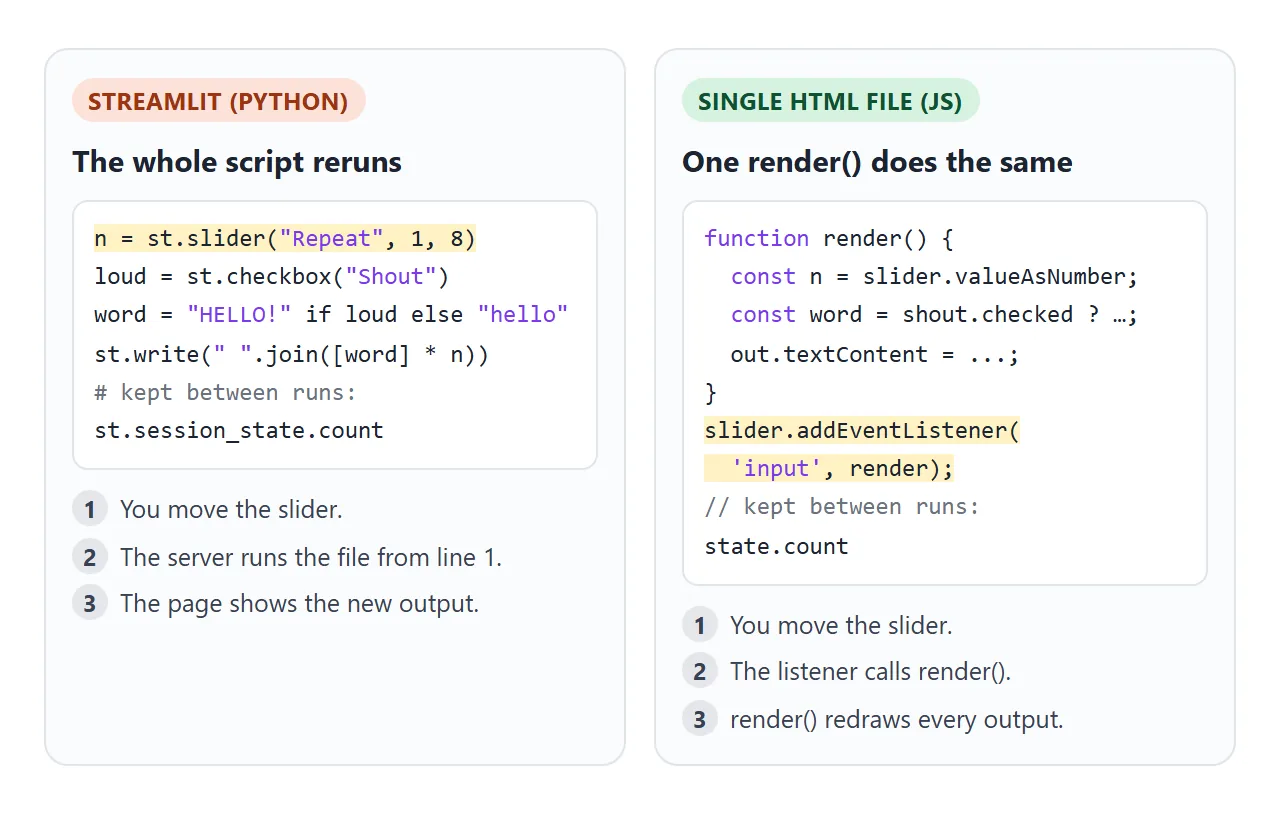
캐치는 둘 다 동일합니다. 스크립트 내의 일반 변수는 실행될 때마다 다시 시작됩니다. Streamlit의 문서에서는 각 사용자 세션에 대해 재실행 간에 변수를 공유하는 방법으로 세션 상태를 설명합니다. JavaScript에서는 render() 외부의 변수입니다.
<!doctype html>
<html lang="en">
<head>
<meta charset="utf-8">
<meta name="viewport" content="width=device-width, initial-scale=1">
<title>Rerun and session state</title>
<style>
  body { margin: 0; padding: 16px; font-family: system-ui, sans-serif; color: #262730; background: #fff; }
  .wrap { display: grid; grid-template-columns: minmax(0, 1fr) minmax(0, 1fr); gap: 14px; }
  @media (max-width: 520px) { .wrap { grid-template-columns: 1fr; } }
  .side { background: #f0f2f6; border-radius: 10px; padding: 14px; }
  label { display: block; font-size: 13px; margin: 0 0 10px; }
  input[type=range] { width: 100%; }
  button { font: inherit; padding: 7px 14px; border: 1px solid #c9ccd4; border-radius: 8px; background: #fff; cursor: pointer; }
  .main p { margin: 0 0 8px; font-size: 15px; }
  .runs { font-size: 13px; color: #6b7080; }
  b.bad { color: #b45309; } b.good { color: #15803d; }
</style>
</head>
<body>
<div class="wrap">
  <div class="side">
    <label>Repeat <span id="nv">3</span> times
      <input type="range" id="n" min="1" max="8" value="3"></label>
    <label><input type="checkbox" id="shout"> Shout</label>
    <button id="add" type="button">Add one</button>
  </div>
  <div class="main">
    <p id="text"></p>
    <p>Counter inside render(): <b class="bad" id="local"></b></p>
    <p>Counter kept outside: <b class="good" id="kept"></b></p>
    <p class="runs">Full reruns so far: <span id="runs"></span></p>
  </div>
</div>

<script>
  const $ = (id) => document.getElementById(id);
  const state = { count: 0 };  // like st.session_state: survives every rerun
  let runs = 0;

  function render(clicked = false) {
    runs++;
    let count = 0;             // like a plain variable in the script: reset each run
    if (clicked) { count++; state.count++; }

    const word = $('shout').checked ? 'HELLO!' : 'hello';
    $('nv').textContent = $('n').value;
    $('text').textContent = Array($('n').valueAsNumber).fill(word).join(' ');
    $('local').textContent = count;
    $('kept').textContent = state.count;
    $('runs').textContent = runs;
  }

  // every widget triggers a full rerun, top to bottom
  $('n').addEventListener('input', () => render());
  $('shout').addEventListener('change', () => render());
  $('add').addEventListener('click', () => render(true));
  render();
</script>
</body>
</html>
완성된 예: 작은 데이터 탐색기
이는 지역 필터, 최소 슬라이더, 두 개의 측정 항목, 막대 차트 및 테이블로 구성된 일반적인 첫 번째 Streamlit 앱의 모양입니다. 데이터는 Python 버전이 pd.read_csv()를 호출하는 스크립트에 있습니다.
<!doctype html>
<html lang="en">
<head>
<meta charset="utf-8">
<meta name="viewport" content="width=device-width, initial-scale=1">
<title>Sales explorer</title>
<style>
  body { margin: 0; padding: 16px; font-family: system-ui, sans-serif; color: #262730; background: #fff; }
  h1 { font-size: 20px; margin: 0 0 12px; }
  .controls { display: flex; flex-wrap: wrap; gap: 12px 20px; background: #f0f2f6; border-radius: 10px; padding: 12px 14px; }
  .controls label { font-size: 13px; display: grid; gap: 5px; min-width: 150px; }
  select { font: inherit; padding: 6px 8px; border: 1px solid #c9ccd4; border-radius: 7px; background: #fff; }
  .metrics { display: flex; gap: 24px; margin: 14px 0 6px; }
  .metric small { display: block; font-size: 13px; color: #6b7080; }
  .metric b { font-size: 26px; font-weight: 600; }
  svg { display: block; width: 100%; max-width: 560px; height: auto; margin: 6px 0 10px; }
  table { border-collapse: collapse; width: 100%; max-width: 560px; font-size: 14px; }
  th, td { text-align: left; padding: 6px 8px; border-bottom: 1px solid #e6e8ee; }
  td.num, th.num { text-align: right; font-variant-numeric: tabular-nums; }
  .empty { color: #b45309; font-size: 14px; }
</style>
</head>
<body>
<h1>Sales explorer</h1>
<div class="controls">
  <label>Region
    <select id="region"><option>All</option><option>North</option><option>South</option><option>West</option></select>
  </label>
  <label>Minimum units: <span id="minv">0</span>
    <input type="range" id="min" min="0" max="60" step="5" value="0">
  </label>
</div>

<div class="metrics">
  <div class="metric"><small>Units</small><b id="units"></b></div>
  <div class="metric"><small>Rows</small><b id="rows"></b></div>
</div>
<svg id="chart" viewBox="0 0 560 170" role="img" aria-label="Units by product"></svg>
<table>
  <thead><tr><th>Product</th><th>Region</th><th class="num">Units</th></tr></thead>
  <tbody id="body"></tbody>
</table>

<script>
  // the data a Streamlit app would read with pd.read_csv()
  const data = [
    ['Lamp', 'North', 42], ['Lamp', 'South', 18], ['Desk', 'North', 25],
    ['Desk', 'West', 51], ['Chair', 'South', 33], ['Chair', 'West', 12],
    ['Shelf', 'North', 8], ['Shelf', 'West', 27], ['Rug', 'South', 46]
  ].map(([product, region, units]) => ({ product, region, units }));

  const $ = (id) => document.getElementById(id);

  function render() {
    const region = $('region').value;
    const min = $('min').valueAsNumber;
    $('minv').textContent = min;

    const rows = data.filter((r) => (region === 'All' || r.region === region) && r.units >= min);

    // st.metric
    $('units').textContent = rows.reduce((s, r) => s + r.units, 0);
    $('rows').textContent = rows.length;

    // st.dataframe
    $('body').innerHTML = rows.length
      ? rows.map((r) => `<tr><td>${r.product}</td><td>${r.region}</td><td class="num">${r.units}</td></tr>`).join('')
      : '<tr><td colspan="3" class="empty">No rows match. Lower the minimum.</td></tr>';

    // st.bar_chart: total units per product, drawn as SVG
    const totals = {};
    rows.forEach((r) => { totals[r.product] = (totals[r.product] || 0) + r.units; });
    const names = Object.keys(totals);
    const max = Math.max(1, ...Object.values(totals));
    const w = 560 / Math.max(names.length, 1);
    $('chart').innerHTML = names.map((n, i) => {
      const h = Math.round(totals[n] / max * 115);
      const x = i * w + 8;
      return `<rect x="${x}" y="${140 - h}" width="${w - 16}" height="${h}" rx="4" fill="#ff4b4b"/>` +
             `<text x="${x + (w - 16) / 2}" y="162" font-size="15" text-anchor="middle" fill="#262730">${n}</text>` +
             `<text x="${x + (w - 16) / 2}" y="${134 - h}" font-size="14" text-anchor="middle" fill="#6b7080">${totals[n]}</text>`;
    }).join('');
  }

  // any widget change reruns everything, the Streamlit way
  $('region').addEventListener('change', render);
  $('min').addEventListener('input', render);
  render();
</script>
</body>
</html>
- 한 번 필터링하고 여러 개 그리기:
render()가 어레이를 필터링한 다음 모든 출력이 동일한rows를 읽습니다. - 빈 상태: 일치하는 행이 없으면 테이블에는 공백이 아닌 일치하는 내용이 표시됩니다.
- 종속성 없음: 막대는 SVG
<rect>요소이므로 파일에는 외부가 필요하지 않습니다. 더 많은 차트 유형을 보려면 HTML 막대 차트를 참조하세요.
다른 방향으로 가기: Streamlit 앱 내부의 HTML
Streamlit에 머물면서 앱에서 자신만의 HTML을 원하는 경우 세 가지 명령이 다르게 작동합니다.
st.markdown는 기본적으로 HTML 태그를 이스케이프하여 원시 텍스트로 표시합니다.unsafe_allow_html=True를 사용하면 렌더링됩니다.st.html는 iframe 없이 HTML을 앱에 삽입합니다.unsafe_allow_javascript=True를 설정하지 않으면 해당 JavaScript가 무시됩니다.st.components.v1.html는 스크립트가 실행되는 iframe(기본적으로 높이 150픽셀)에 HTML을 표시합니다.st.html를 위해 1.56.0부터 더 이상 사용되지 않습니다.
Streamlit의 자체 호스팅인 Community Cloud는 GitHub 리포지토리에서 앱을 배포하고 무료라고 설명합니다. 앱이 서버에 실제 Python을 필요로 할 때 사용하세요.
작동하지 않을 때
| 당신이 보는 것 | 원인 | 수정 |
|---|---|---|
| 저장된 Streamlit 페이지는 아무 작업도 수행하지 않습니다. | Python 프로세스가 그 뒤에서 실행되고 있지 않습니다. | stlite를 사용하거나 일반 HTML로 다시 작성 |
| stlite는 "순수한 Python 3 휠을 찾을 수 없습니다"라는 메시지로 중지됩니다. | PyPI에 연결할 수 없습니다. | PyPI에 접근할 수 있는 곳에서 열거나 일반 HTML로 다시 빌드하세요. |
| 패키지가 stlite에 설치되지 않습니다. | Pyodide용으로 구축되지 않은 바이너리 확장이 있습니다. | 순수 Python 패키지를 선택하거나 다시 빌드하세요. |
time.sleep()가 stlite에서 일시 중지되지 않습니다. |
Pyodide에서는 작동하지 않습니다. | asyncio.sleep() 사용 |
| HTML이 앱에 텍스트로 표시됩니다. | st.markdown는 기본적으로 이를 이스케이프합니다. |
unsafe_allow_html=True 또는 st.html |
st.html 내부의 스크립트가 실행되지 않습니다. |
JavaScript는 기본적으로 무시됩니다. | unsafe_allow_javascript=True |
| 구성 요소 HTML이 잘립니다. | st.components.v1.html의 기본값은 150픽셀입니다. |
height를 전달하거나 st.html로 이동하세요. |
| 일반 HTML 버전에는 이전 숫자가 표시됩니다. | 하나의 컨트롤이 render()를 호출하지 않습니다. |
모든 컨트롤에 리스너 추가 |
| HTML 버전의 카운터가 계속 재설정됩니다. | render() 내부에 선언되어 있습니다. |
함수 외부로 이동 |
링크로 공유하세요
데이터 앱은 클릭하고, 필터링하고, 드래그할 수 있도록 만들어졌습니다. 스크린샷은 한 상태를 정지시키고, Python을 보내는 것은 다른 사람이 Python을 먼저 설치해야 함을 의미합니다. 단일 HTML 파일 앱은 하나의 파일이 왜 그렇게 잘 전달되는지 설명합니다.
일반 HTML 버전을 보내려면 페이지를 NOS 문서에 붙여넣고 공유 링크 만들기를 선택하세요. 링크할 HTML이 이를 안내합니다.
페이지는 작성된 대로 렌더링되고 스크립트가 실행되므로 페이지를 받는 사람은 계정 없이도 필터를 직접 사용할 수 있습니다. 나중에 코드를 변경하면 동일한 링크에 새 버전이 표시됩니다.