Streamlit is an open-source Python framework for building data apps, the kind with sliders, tables and charts. (It has nothing to do with video streaming.)
You write a normal Python script, start it with streamlit run, and a local server opens the app in your browser. Because the Python keeps running on that server, a Streamlit app is not a single HTML file, and saving the page does not give you one.
There are two ways to end up with one file. stlite runs Streamlit itself in the browser. Or you rebuild the small app in plain HTML and JavaScript, which is what this example is:
<!doctype html>
<html lang="en">
<head>
<meta charset="utf-8">
<meta name="viewport" content="width=device-width, initial-scale=1">
<title>Hello app</title>
<style>
  body { margin: 0; padding: 20px; font-family: system-ui, sans-serif; background: #fff; color: #262730; }
  label { display: block; font-size: 14px; margin-bottom: 6px; }
  input {
    width: 100%; max-width: 320px; box-sizing: border-box;
    padding: 9px 11px; font: inherit; border: 1px solid #d5d7de; border-radius: 8px; background: #f0f2f6;
  }
  #out { margin-top: 18px; font-size: 18px; }
  .note { margin-top: 18px; font-size: 13px; color: #6b7080; }
</style>
</head>
<body>
<label for="name">Your name</label>
<input id="name" autocomplete="off">
<p id="out"></p>
<p class="note">The same app as three lines of Streamlit, with no Python server.</p>

<script>
  const name = document.getElementById('name');
  const out = document.getElementById('out');

  // Streamlit reruns the script on every change; here render() plays that part
  function render() {
    out.textContent = 'Hello, ' + (name.value.trim() || 'world');
  }

  name.addEventListener('input', render);
  render();  // first run, like opening the app
</script>
</body>
</html>
The Python version of the same app is three lines:
import streamlit as st

name = st.text_input("Your name")
st.write("Hello,", name or "world")
Why a Streamlit app needs a server
You install Streamlit with pip and start an app from the command line:
pip install streamlit
streamlit run streamlit_app.py
The docs say a local Streamlit server spins up and the app opens in a new browser tab. The server listens on port 8501 unless you change server.port.
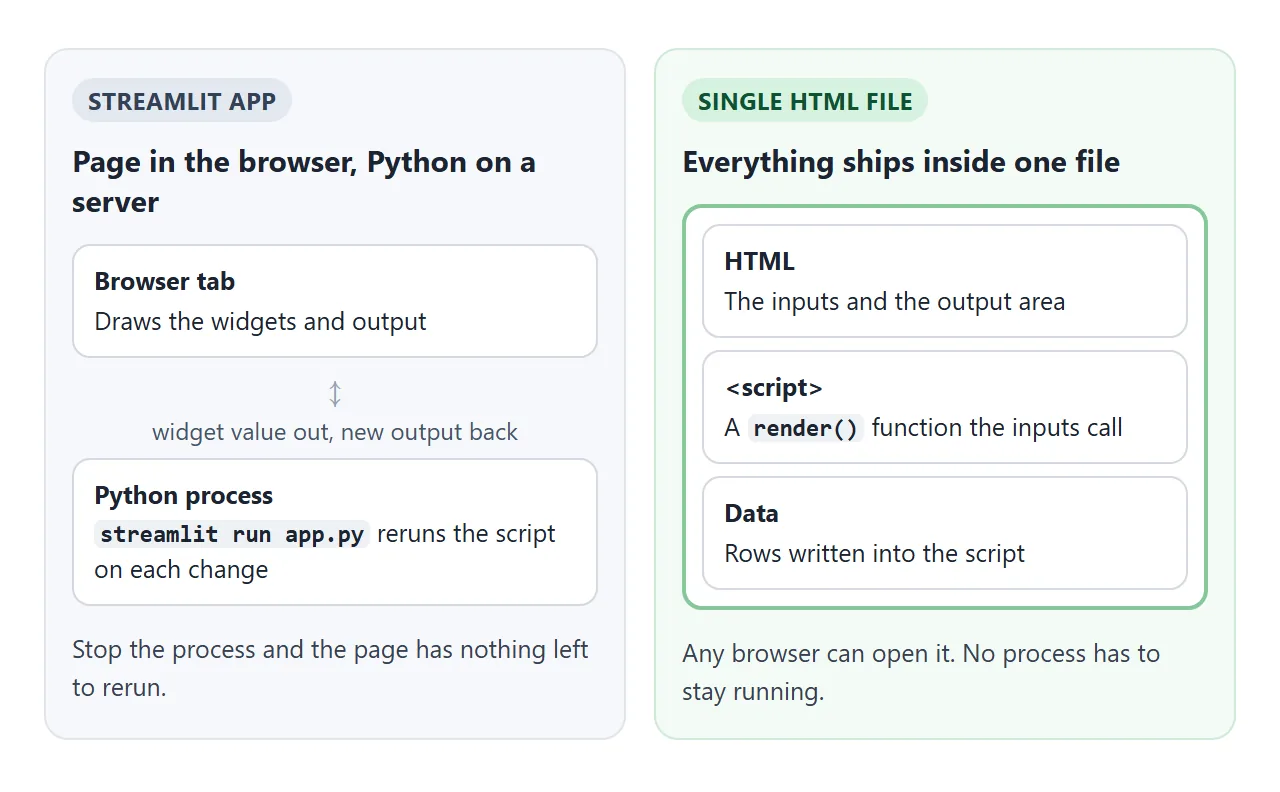
The browser tab draws the widgets and shows the output. In the docs' words, any time something must be updated on the screen, Streamlit reruns your entire Python script from top to bottom. That rerun happens in the Python process, so the page cannot update without it.
Option 1: stlite, Streamlit in the browser
stlite is an open-source project, under the Apache 2.0 licence, that runs Streamlit on Pyodide, a port of Python to WebAssembly. Its README shows a whole app in one HTML file. The version below is the one we tested:
<link rel="stylesheet"
  href="https://cdn.jsdelivr.net/npm/@stlite/browser@1.9.2/build/stlite.css">
<script type="module"
  src="https://cdn.jsdelivr.net/npm/@stlite/browser@1.9.2/build/stlite.js"></script>

<streamlit-app>
import streamlit as st
name = st.text_input("Your name")
st.write("Hello,", name or "world")
</streamlit-app>
In our test, opened as a local file in Chromium with internet access, this showed the app after about five seconds. The Python runs inside the browser tab, with no server of your own.
The README lists what to expect. Pyodide loads from a CDN by default, and Python packages are installed from PyPI through micropip. time.sleep() does nothing; use asyncio.sleep(). Packages with binary extensions that are not built for Pyodide cannot be installed.
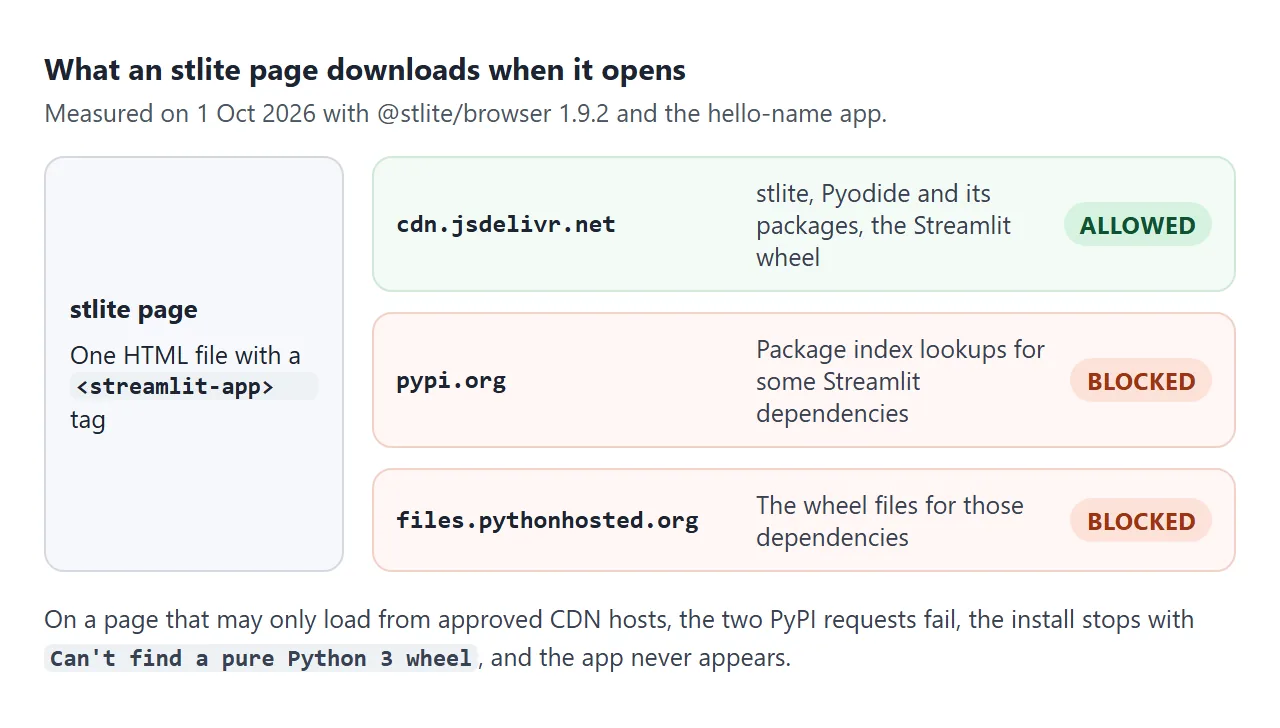
That PyPI step matters for sharing. In our test, the page fetched files from cdn.jsdelivr.net and also from pypi.org and files.pythonhosted.org. When only the CDN hosts were reachable, installation stopped with "Can't find a pure Python 3 wheel" and the app never appeared.
Option 2: rebuild the app in plain HTML
A small app, with a few inputs, a filter, a number and a chart, translates directly. Each widget becomes an HTML control, and the rerun becomes one JavaScript function.
| Streamlit | Plain HTML and JavaScript |
|---|---|
st.text_input |
<input type="text"> |
st.slider |
<input type="range"> |
st.selectbox |
<select> with <option>s |
st.checkbox |
<input type="checkbox"> |
st.button |
<button> |
st.metric |
A large number in a <b> |
st.dataframe |
A <table> built from an array |
st.bar_chart |
Inline SVG, or a chart library from a CDN |
st.session_state |
A variable declared outside render() |
To build it:
- List the widgets. Note every
st.widget the script uses and pick the matching control from the table. - Write one
render()function. It reads the current values and redraws every output, just like the script body. - Rerun on every change. Call
render()from aninputorchangelistener on each control, and once on page load. - Keep state outside
render(). Values that must survive a rerun live in a variable declared above the function.
The rerun model, and where state lives
The JavaScript version keeps Streamlit's habit of rerunning everything: one function, called after every change, that recomputes and redraws everything.
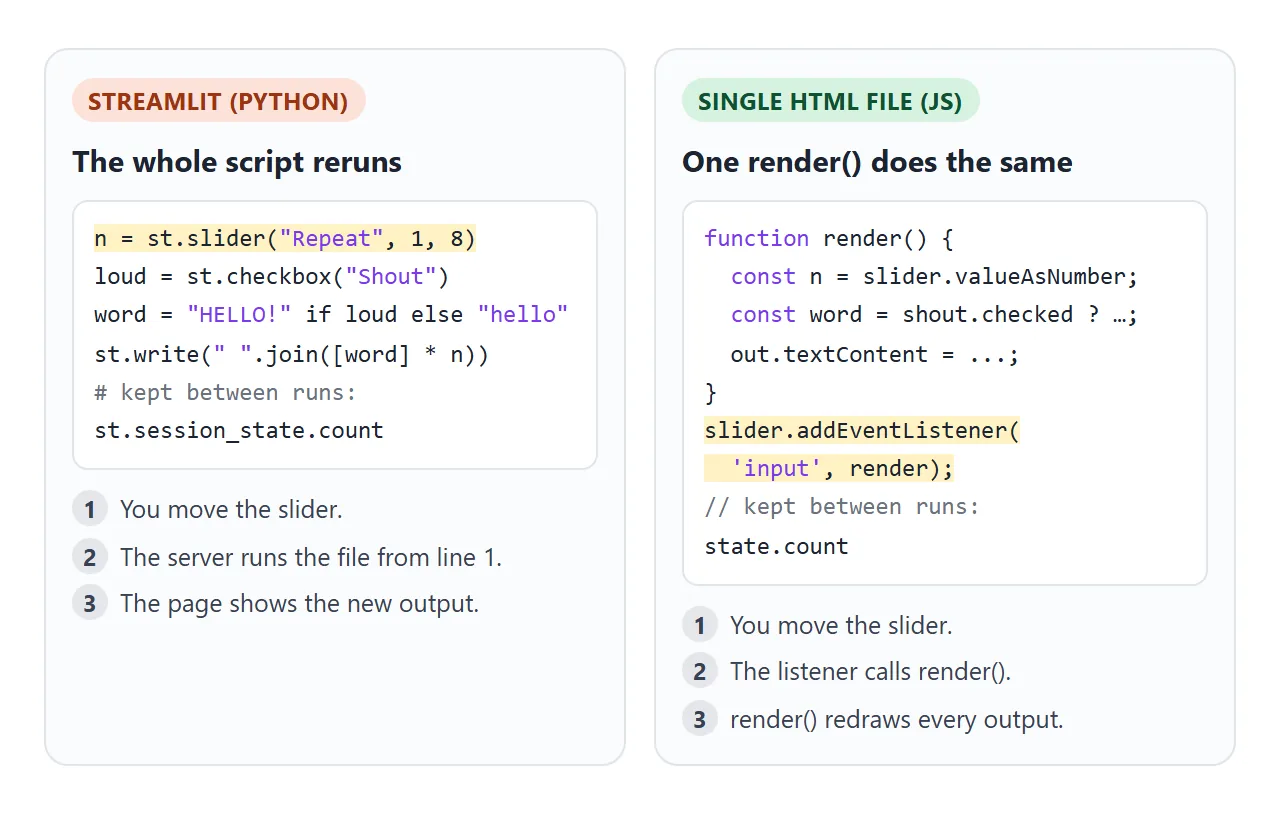
The catch is the same in both. A plain variable inside the script starts over on every run. Streamlit's docs describe Session State as a way to share variables between reruns, for each user session. In JavaScript, that is a variable outside render().
<!doctype html>
<html lang="en">
<head>
<meta charset="utf-8">
<meta name="viewport" content="width=device-width, initial-scale=1">
<title>Rerun and session state</title>
<style>
  body { margin: 0; padding: 16px; font-family: system-ui, sans-serif; color: #262730; background: #fff; }
  .wrap { display: grid; grid-template-columns: minmax(0, 1fr) minmax(0, 1fr); gap: 14px; }
  @media (max-width: 520px) { .wrap { grid-template-columns: 1fr; } }
  .side { background: #f0f2f6; border-radius: 10px; padding: 14px; }
  label { display: block; font-size: 13px; margin: 0 0 10px; }
  input[type=range] { width: 100%; }
  button { font: inherit; padding: 7px 14px; border: 1px solid #c9ccd4; border-radius: 8px; background: #fff; cursor: pointer; }
  .main p { margin: 0 0 8px; font-size: 15px; }
  .runs { font-size: 13px; color: #6b7080; }
  b.bad { color: #b45309; } b.good { color: #15803d; }
</style>
</head>
<body>
<div class="wrap">
  <div class="side">
    <label>Repeat <span id="nv">3</span> times
      <input type="range" id="n" min="1" max="8" value="3"></label>
    <label><input type="checkbox" id="shout"> Shout</label>
    <button id="add" type="button">Add one</button>
  </div>
  <div class="main">
    <p id="text"></p>
    <p>Counter inside render(): <b class="bad" id="local"></b></p>
    <p>Counter kept outside: <b class="good" id="kept"></b></p>
    <p class="runs">Full reruns so far: <span id="runs"></span></p>
  </div>
</div>

<script>
  const $ = (id) => document.getElementById(id);
  const state = { count: 0 };  // like st.session_state: survives every rerun
  let runs = 0;

  function render(clicked = false) {
    runs++;
    let count = 0;             // like a plain variable in the script: reset each run
    if (clicked) { count++; state.count++; }

    const word = $('shout').checked ? 'HELLO!' : 'hello';
    $('nv').textContent = $('n').value;
    $('text').textContent = Array($('n').valueAsNumber).fill(word).join(' ');
    $('local').textContent = count;
    $('kept').textContent = state.count;
    $('runs').textContent = runs;
  }

  // every widget triggers a full rerun, top to bottom
  $('n').addEventListener('input', () => render());
  $('shout').addEventListener('change', () => render());
  $('add').addEventListener('click', () => render(true));
  render();
</script>
</body>
</html>
A finished example: a small data explorer
This is the shape of a typical first Streamlit app: a region filter, a minimum slider, two metrics, a bar chart and a table. The data lives in the script, where the Python version would call pd.read_csv().
<!doctype html>
<html lang="en">
<head>
<meta charset="utf-8">
<meta name="viewport" content="width=device-width, initial-scale=1">
<title>Sales explorer</title>
<style>
  body { margin: 0; padding: 16px; font-family: system-ui, sans-serif; color: #262730; background: #fff; }
  h1 { font-size: 20px; margin: 0 0 12px; }
  .controls { display: flex; flex-wrap: wrap; gap: 12px 20px; background: #f0f2f6; border-radius: 10px; padding: 12px 14px; }
  .controls label { font-size: 13px; display: grid; gap: 5px; min-width: 150px; }
  select { font: inherit; padding: 6px 8px; border: 1px solid #c9ccd4; border-radius: 7px; background: #fff; }
  .metrics { display: flex; gap: 24px; margin: 14px 0 6px; }
  .metric small { display: block; font-size: 13px; color: #6b7080; }
  .metric b { font-size: 26px; font-weight: 600; }
  svg { display: block; width: 100%; max-width: 560px; height: auto; margin: 6px 0 10px; }
  table { border-collapse: collapse; width: 100%; max-width: 560px; font-size: 14px; }
  th, td { text-align: left; padding: 6px 8px; border-bottom: 1px solid #e6e8ee; }
  td.num, th.num { text-align: right; font-variant-numeric: tabular-nums; }
  .empty { color: #b45309; font-size: 14px; }
</style>
</head>
<body>
<h1>Sales explorer</h1>
<div class="controls">
  <label>Region
    <select id="region"><option>All</option><option>North</option><option>South</option><option>West</option></select>
  </label>
  <label>Minimum units: <span id="minv">0</span>
    <input type="range" id="min" min="0" max="60" step="5" value="0">
  </label>
</div>

<div class="metrics">
  <div class="metric"><small>Units</small><b id="units"></b></div>
  <div class="metric"><small>Rows</small><b id="rows"></b></div>
</div>
<svg id="chart" viewBox="0 0 560 170" role="img" aria-label="Units by product"></svg>
<table>
  <thead><tr><th>Product</th><th>Region</th><th class="num">Units</th></tr></thead>
  <tbody id="body"></tbody>
</table>

<script>
  // the data a Streamlit app would read with pd.read_csv()
  const data = [
    ['Lamp', 'North', 42], ['Lamp', 'South', 18], ['Desk', 'North', 25],
    ['Desk', 'West', 51], ['Chair', 'South', 33], ['Chair', 'West', 12],
    ['Shelf', 'North', 8], ['Shelf', 'West', 27], ['Rug', 'South', 46]
  ].map(([product, region, units]) => ({ product, region, units }));

  const $ = (id) => document.getElementById(id);

  function render() {
    const region = $('region').value;
    const min = $('min').valueAsNumber;
    $('minv').textContent = min;

    const rows = data.filter((r) => (region === 'All' || r.region === region) && r.units >= min);

    // st.metric
    $('units').textContent = rows.reduce((s, r) => s + r.units, 0);
    $('rows').textContent = rows.length;

    // st.dataframe
    $('body').innerHTML = rows.length
      ? rows.map((r) => `<tr><td>${r.product}</td><td>${r.region}</td><td class="num">${r.units}</td></tr>`).join('')
      : '<tr><td colspan="3" class="empty">No rows match. Lower the minimum.</td></tr>';

    // st.bar_chart: total units per product, drawn as SVG
    const totals = {};
    rows.forEach((r) => { totals[r.product] = (totals[r.product] || 0) + r.units; });
    const names = Object.keys(totals);
    const max = Math.max(1, ...Object.values(totals));
    const w = 560 / Math.max(names.length, 1);
    $('chart').innerHTML = names.map((n, i) => {
      const h = Math.round(totals[n] / max * 115);
      const x = i * w + 8;
      return `<rect x="${x}" y="${140 - h}" width="${w - 16}" height="${h}" rx="4" fill="#ff4b4b"/>` +
             `<text x="${x + (w - 16) / 2}" y="162" font-size="15" text-anchor="middle" fill="#262730">${n}</text>` +
             `<text x="${x + (w - 16) / 2}" y="${134 - h}" font-size="14" text-anchor="middle" fill="#6b7080">${totals[n]}</text>`;
    }).join('');
  }

  // any widget change reruns everything, the Streamlit way
  $('region').addEventListener('change', render);
  $('min').addEventListener('input', render);
  render();
</script>
</body>
</html>
- Filter once, draw many:
render()filters the array, then every output reads the samerows. - Empty state: when no rows match, the table says so instead of going blank.
- No dependencies: the bars are SVG
<rect>elements, so the file needs nothing from outside. For more chart types, see HTML bar chart.
Going the other way: HTML inside a Streamlit app
If you are staying in Streamlit and want your own HTML in the app, three commands behave differently:
st.markdownescapes HTML tags by default and shows them as raw text. Withunsafe_allow_html=True, they render.st.htmlinserts HTML into the app without an iframe. JavaScript in it is ignored unless you setunsafe_allow_javascript=True.st.components.v1.htmlshows HTML in an iframe where scripts run, 150 pixels tall by default. It is deprecated since 1.56.0 in favour ofst.html.
Streamlit's own hosting, Community Cloud, deploys apps from GitHub repositories and describes itself as free. Use it when the app needs real Python on the server.
When it does not work
| What you see | Cause | Fix |
|---|---|---|
| A saved Streamlit page does nothing | The Python process is not running behind it | Use stlite, or rebuild in plain HTML |
| stlite stops with "Can't find a pure Python 3 wheel" | PyPI could not be reached | Open it where PyPI is reachable, or rebuild in plain HTML |
| A package fails to install in stlite | It has binary extensions not built for Pyodide | Choose a pure-Python package, or rebuild |
time.sleep() does not pause in stlite |
It is a no-op on Pyodide | Use asyncio.sleep() |
| HTML appears as text in the app | st.markdown escapes it by default |
unsafe_allow_html=True or st.html |
A script inside st.html never runs |
JavaScript is ignored by default | unsafe_allow_javascript=True |
| The component HTML is cut off | st.components.v1.html defaults to 150 pixels |
Pass a height, or move to st.html |
| The plain HTML version shows old numbers | One control does not call render() |
Add a listener to every control |
| A counter in the HTML version keeps resetting | It is declared inside render() |
Move it outside the function |
Share it as a link
A data app is meant to be clicked, filtered and dragged. A screenshot freezes one state, and sending the Python means the other person has to install it first. Single HTML file apps explains why one file travels so well.
To send the plain HTML version, paste the page into a NOS document and choose Create share link. HTML to link walks through it.
The page renders as written and its scripts run, so the people you send it to can use the filters themselves without an account. If you change the code later, the same link shows the new version.