To share an HTML dashboard, give it an address and send the link, not a screenshot and not a file. A dashboard exists to answer "where are we now".
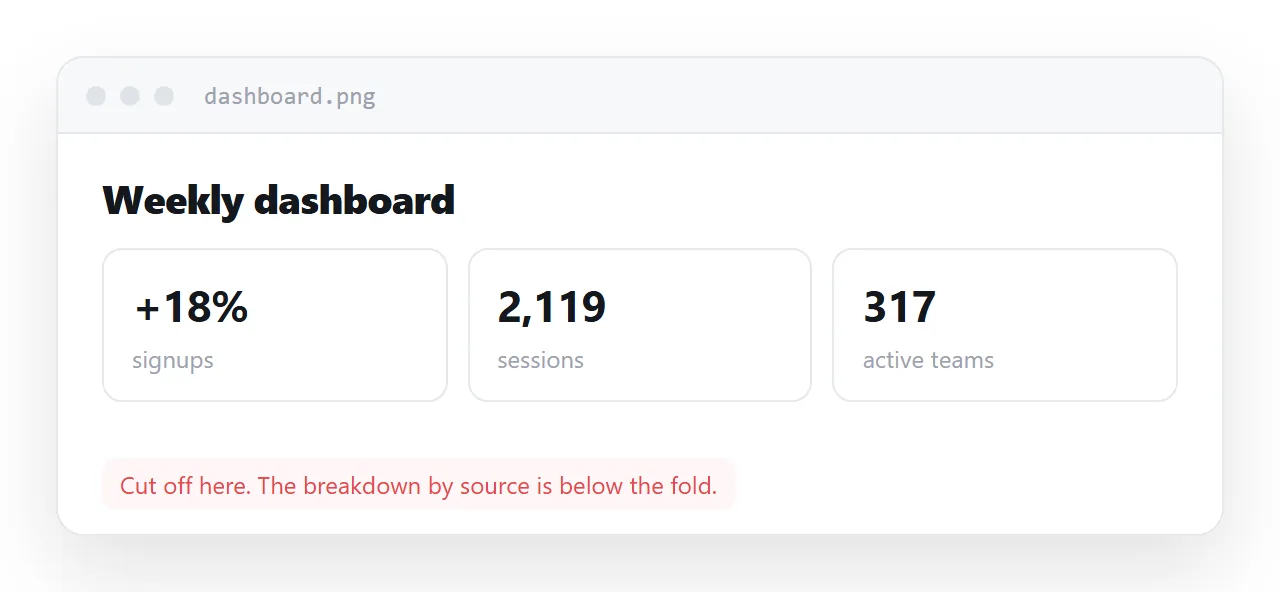
Send it as a picture and it answers "where were we when somebody took this screenshot", which is a different and much less useful question, and the picture keeps getting forwarded after the numbers have moved.
This guide covers what a screenshot costs, the four steps to share the dashboard as a link, and the four things to design differently once other people are reading it on their own screens.
A dashboard exists to answer "where are we now". Send it as a picture and it answers "where were we when somebody took this screenshot", which is a different and much less useful question.
What a screenshot of a dashboard costs
- The numbers are frozen, and nothing in the image says so.
- Nobody can copy a figure into their own working notes.
- Charts stop responding, so the detail behind a bar is gone.
- It is one fixed width — unreadable on a phone if it was captured on a wide screen.
- It looks authoritative while being wrong, which is the expensive part.
That last point is worth dwelling on. A stale spreadsheet announces itself with a filename and a date. A stale image of a dashboard looks exactly like a current one, and it gets forwarded.
How to share an HTML dashboard: put it at an address
The page itself, at a link that does not change. Everyone opens the same page. When a figure is corrected, everyone who opens the link afterwards sees the correction — including the people who received the link three weeks ago.
Publishing the page is the mechanical part. The rest is designing it for the fact that it is now going to be read on other people's screens.
Four things to design differently
A timestamp, at the top
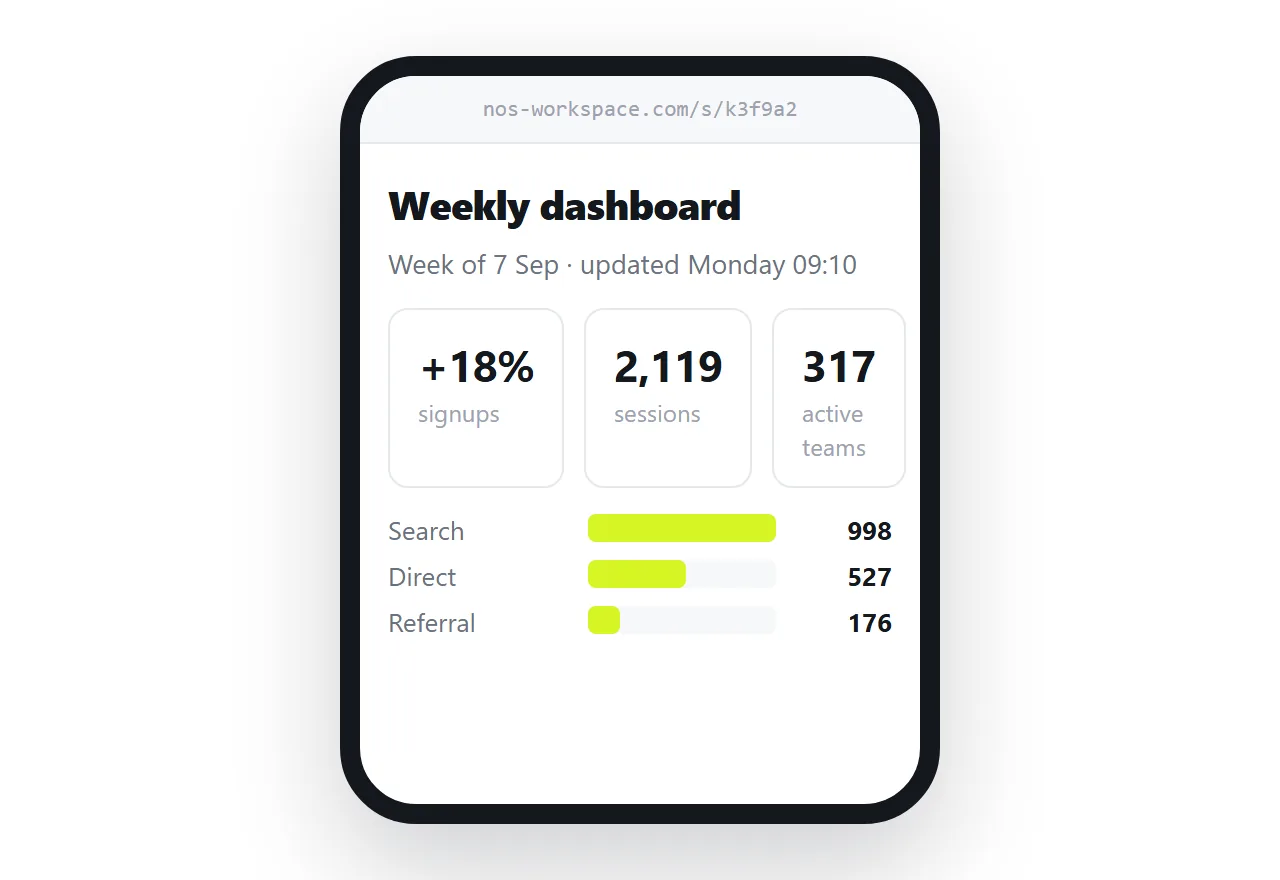
<p class="when">Figures through 12 Sep · updated daily</p>
The most valuable line on the page. It tells the reader what they are looking at and tells them when to come back.
One column on a phone
.cards {
  display: grid;
  grid-template-columns: repeat(auto-fit, minmax(170px, 1fr));
  gap: 10px;
}
auto-fit with a minimum width means the browser fits as many columns as will comfortably hold 170px and stacks the rest. Four cards on a laptop, one on a phone, with no media query. See CSS grid for what each part does.
Direction, not just magnitude
A number on its own is not information. 1,284 means nothing; 1,284, up 12% on last week means something. Put the comparison next to the figure, not in a separate section.
Aligned digits
.num { text-align: right; font-variant-numeric: tabular-nums; }
Tabular figures give every digit the same width, so a column of numbers lines up and the magnitudes are comparable at a glance. Without it, 1,284 and 998 are hard to compare because the digits sit at different widths.
Making the numbers change
Two approaches, both legitimate.
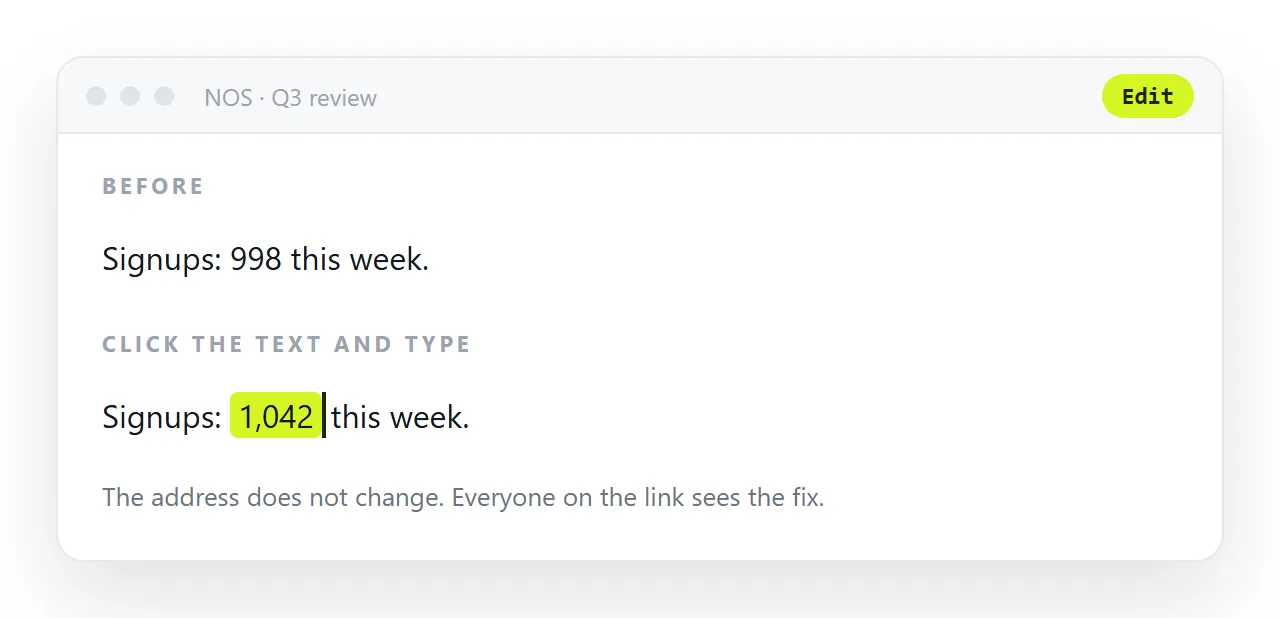
Written into the page. The numbers are text in the markup. Updating means editing the page — but there is one page, so there is one edit, and every reader of the link gets it. This is where most shared dashboards actually live, and it is fine.
Fetched by the page. A script pulls from an endpoint on load. Genuinely live, and now you own an endpoint, its availability, and its permissions. Worth it for something watched daily; overkill for a weekly summary.
Either way the link stays the same, which is what makes this work at all.
Why the link mattering more than the file
A dashboard is the clearest case of a document whose value depends on being current. The file model fights that at every turn: each send is a copy, each copy ages independently, and the oldest one is the one that gets forwarded to the person who matters.
In NOS the pasted HTML renders exactly as written at a fixed address, and the text in it — including every number — is clickable text you can correct. So updating the week's figures is typing over them, not producing a new file, and the address you gave the team in January is still the one showing this week's numbers.
One dashboard or one per client
A team dashboard is one page at one address. A client dashboard is one page per client, each at its own address, with the client's numbers and nothing else on it.
The second case is where a file approach fails fastest, because six clients means six files a week, and where a page approach is easiest, because each client's page is edited in place and the link they were given at the start of the engagement never changes. Dashboards for clients covers the per-client layout.
Who should be able to open it
A dashboard usually carries numbers that are fine for the team and not for the world.
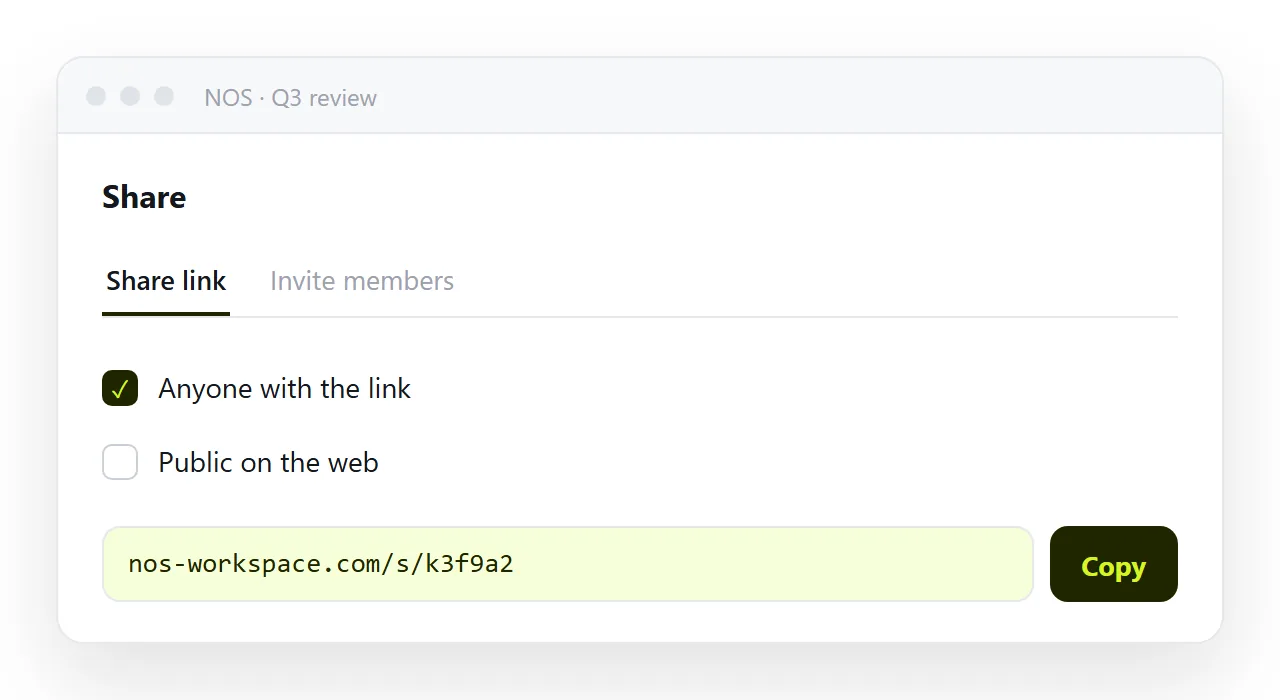
The share link is unlisted by default: it works for whoever has it and is not listed anywhere, which is the right setting for a link posted in a private channel.
For a dashboard that only named people should see, invite them from the Invite members tab instead of sharing by link, and revoke the link if it has already gone out.
Do not tick Public on the web for internal numbers; that setting is for pages you want search engines to find.
Before you post the link
- Is there a date on the page? If not, add the timestamp line before anything else.
- Does every percentage have its base next to it?
+12%means nothing withoutof 1,142. - Does it read at phone width? Narrow the window; the cards should stack into one column.
- Does the title tag say what it is? That is what the preview card in chat shows.
Sharing the dashboard as a link: 4 steps
- Put a timestamp on the page.
Figures through 12 Sep · updated dailyat the top. It tells the reader what they are looking at and when to come back, and it is the one thing a screenshot can never carry honestly. - Paste the HTML into a NOS document. It renders exactly as written, cards, charts and scripts included, and every number in it stays clickable text. Turning HTML into a link is this step.
- Copy the share link and send it. Share, then Share link, then Create link. Post the same address every week; a link people have opened before is one they open again without thinking, and it unfurls into a preview card in chat.
- Update the page, not the message. When the figures come in, type over the numbers. The link in the channel, in the email, in the deck already shows the new ones, including for the people who received it in January.