A client dashboard in HTML is read when you are not there, and that single fact determines what belongs on it.
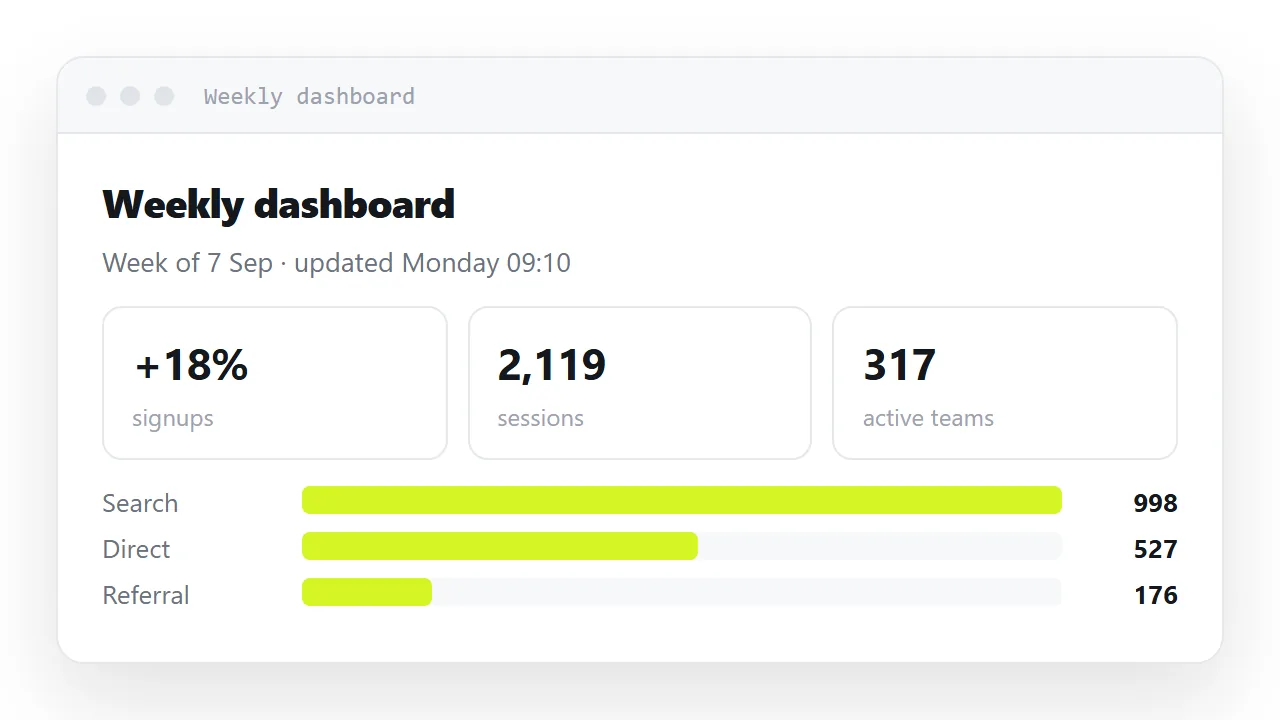
Four lines make it usable without you: the as-of date at the top, every figure with its base, one line saying what each metric means, and a plain statement of what is not measured.
This guide covers those four lines, one page per client, designing for the phone, charts without a library, why the link and not a screenshot, and the four steps to set a client dashboard up at one address.
A client dashboard is read when you are not there. That single fact determines what belongs on it.
The four lines that make a client dashboard HTML usable
The as-of date, at the top
<p class="when">Figures through 12 Sep 2026 · updated every Monday morning</p>
Two pieces of information: what they are looking at, and when to come back. A dashboard without them gets checked once.
Every figure with its base
<div class="card">
  <div class="l">Conversion</div>
  <div class="v">4.2%</div>
  <div class="d">54 of 1,284 sessions · 3.6% in August</div>
</div>
4.2% alone is unverifiable and cannot be argued with, which sounds convenient and means it is not being used. The base number and the comparison are what make it a fact rather than a claim.
What each metric means
<p class="fine">
  <strong>Conversion</strong> counts sessions that reached the enquiry form,
  not completed enquiries. <strong>Reach</strong> excludes internal traffic.
</p>
One short paragraph. Without it, every monthly call opens with the client asking what a number means — and worse, sometimes not asking and assuming something wrong.
What is not measured
<p class="fine">Phone enquiries are not tracked here. Offline conversions are not included.</p>
The line that protects you. A dashboard that quietly omits a channel will eventually be used to conclude that the channel does not work.
One page per client
/clients/northwind/dashboard
/clients/eastgate/dashboard
Separate addresses. The worst available failure on a client dashboard is showing one client another client's figures, and separate pages make that structurally impossible rather than a matter of a filter being right.
Design for the phone
.cards {
  display: grid;
  grid-template-columns: repeat(auto-fit, minmax(170px, 1fr));
  gap: 10px;
}
.num { text-align: right; font-variant-numeric: tabular-nums; }
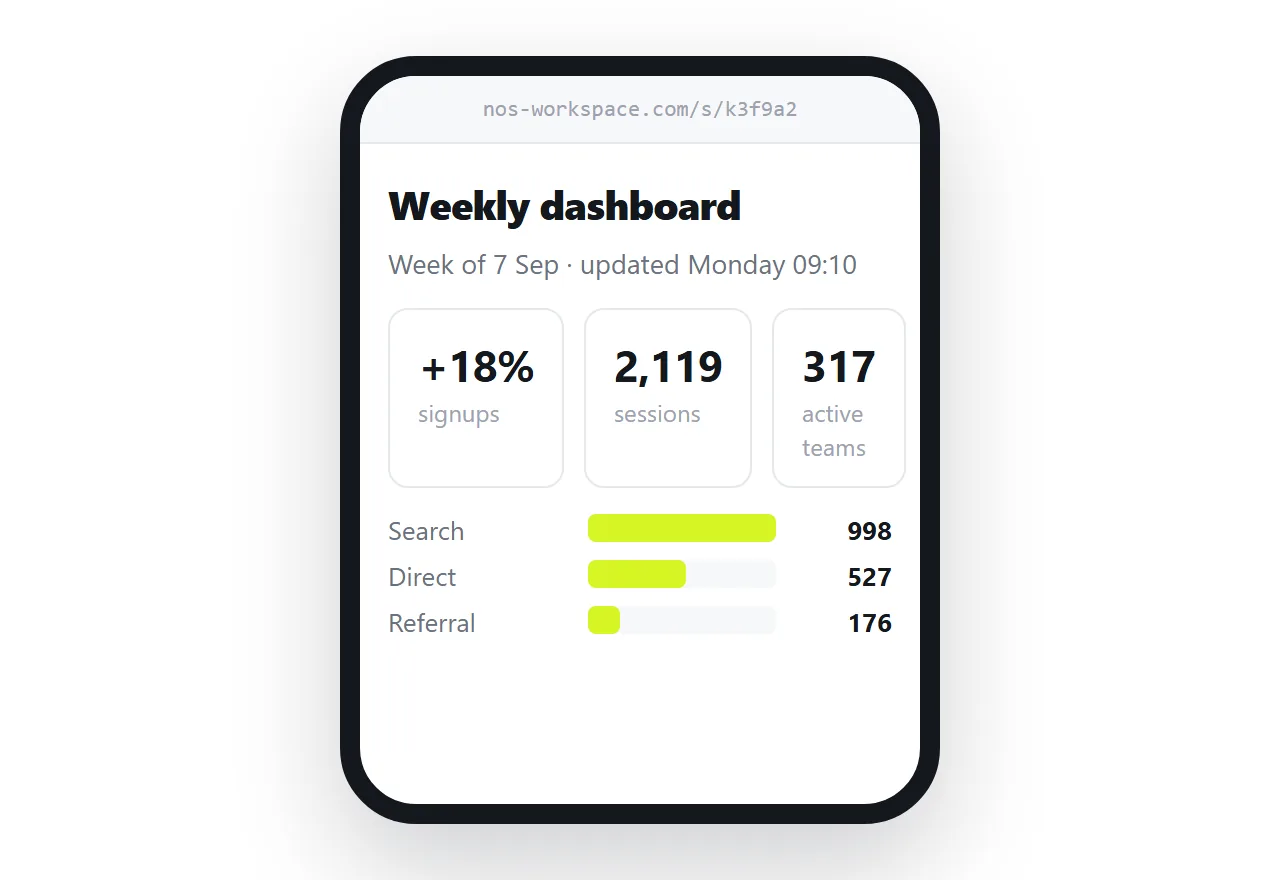
Clients open these on phones between meetings. An auto-fitting grid gives four cards on a laptop and one on a phone with no breakpoints — see CSS grid.
Charts without a library
Bars need no dependency:
<span class="track"><i class="fill" style="width:78%"></i></span>
with .fill { display: block; height: 100%; }. The display: block is essential — an inline element ignores width, which produces bars that do not appear. See sharing a chart.
A charting library loaded from an outside address is a dashboard that can go blank at a moment you are not watching, in front of a client.
Why the link and not a screenshot
A screenshot in an email is wrong within a week and looks authoritative the entire time. It also cannot be copied from, which means the client's own analyst has to retype your figures.
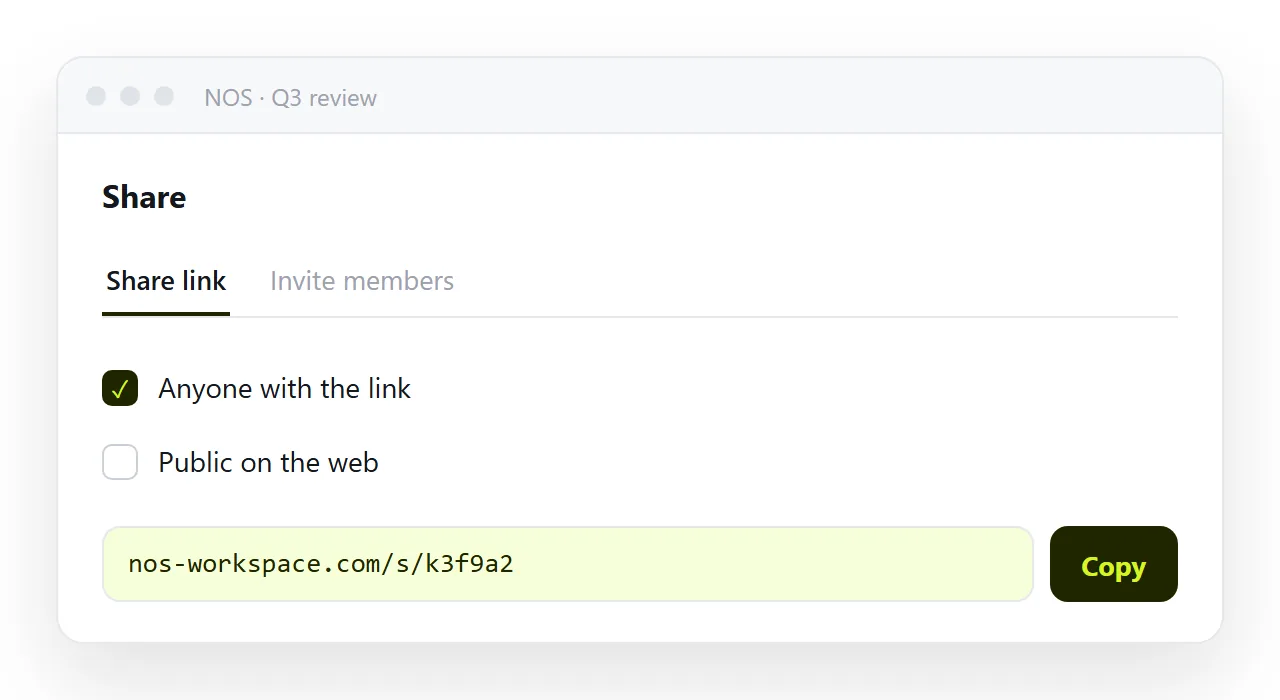
One link, updated on a stated schedule. In NOS the dashboard is a document at a fixed address whose numbers are clickable text — the Monday update is typing over them, and the link the client bookmarked in January is showing this week.
When the client asks why a number moved
They will, on a Monday, without you. The dashboard cannot answer, but it can point: a one-line note under the changed figure, dated, saying what happened ("spend paused 3 to 5 Sep for the creative refresh"), turns the Monday question into a nod.
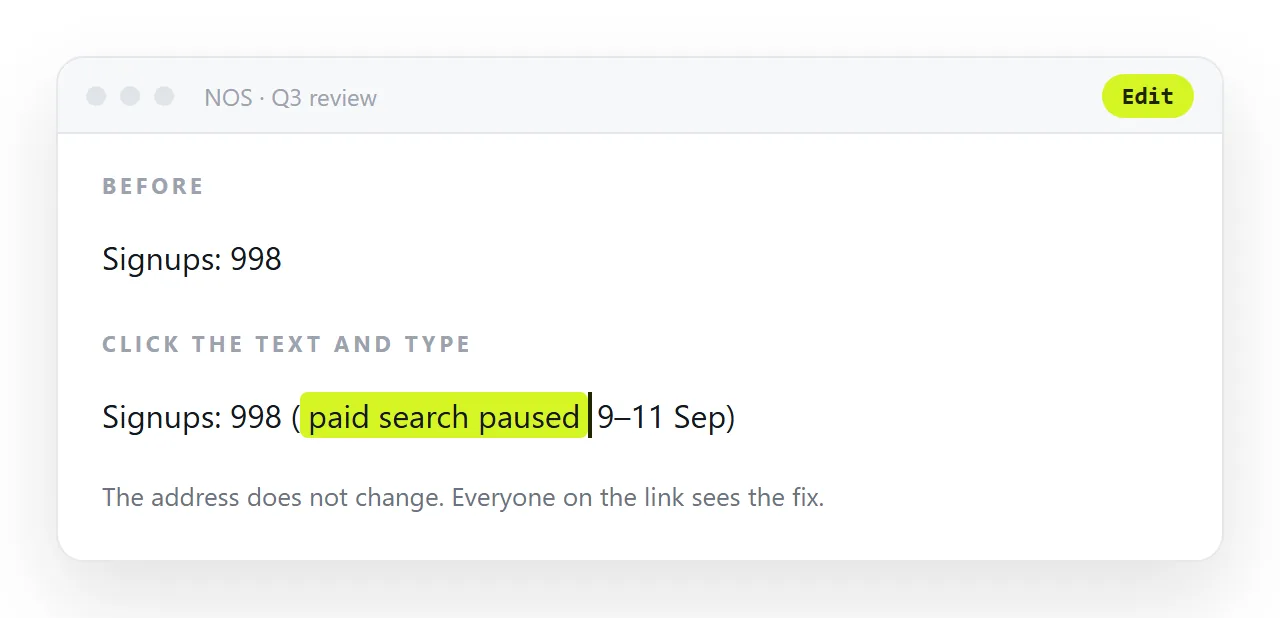
Add the note when you update the page; remove it after a month. That is the difference between a dashboard that explains itself and one that generates a meeting.
What goes on it, and what does not
| Include | Leave off |
|---|---|
| The as-of date and update schedule | Metrics you cannot explain in one line |
| Six figures that matter, with their bases | Everything you happen to have |
| A comparison for each figure | Impressions with no conversion path |
| A one-line definition per metric | Internal jargon |
| What is not measured | Composite indices |
| A contact for questions | Another client's figures, ever |
The last row on the right is worth designing against structurally rather than trusting a filter — one page per client makes it impossible.
The relationship to the monthly report
The dashboard answers "where are we now". The client report answers "what happened last month and what are we doing about it". They are different documents with different update rhythms, and merging them produces a dashboard nobody reads and a report that is out of date.
One address each. The dashboard is updated in place; each report keeps its own period address — see reusing a template for the two patterns.
What the client is allowed to do with it
Say it on the page, in one line at the foot: whether the client may share the link internally, whether they may forward it to their agency, and who to contact about access.
An unlisted link is a link, and the client will forward it; a line saying that is fine, or is not, saves the conversation later. If it is not fine, invite named people instead and do not create a link at all.
The dashboard and the report are two documents
The dashboard answers "where are we", every Monday, in one screen. The monthly report answers "what happened and what we are doing about it", once a month, in prose with the same base numbers.
Link each from the other, keep the definitions identical, and do not let the dashboard grow a narrative section or the report grow twelve charts.
Setting up the client dashboard: 4 steps
- Write the four lines first. As-of date and cadence at the top, the base under every figure, a one-line definition per metric, and what is not measured with the reason.
- Make one page per client. Their numbers and nothing else, at their own address. Never a shared page with a client switcher.
- Check it at phone width with no library. Cards that stack, bars that are divs, nothing loaded from another address. The HTML viewer shows it at 360px.
- Paste it into a NOS document and share the link once. Share, then Share link, then Create link. Unlisted, or invite the client's people by name. Update in place; the link they bookmarked in January shows this week. Turning HTML into a link is this step.