A KPI dashboard template, in this guide, is one web page: a tile for each KPI with the actual number, the target and a status in words.
You ask an AI chat to write it, paste your numbers in, and share the page as a link.
One thing first: the numbers are typed in. The page does not read your spreadsheet and does not refresh itself. For a weekly or monthly review that is a fair trade, and it is why this takes minutes.
The AI part is easy. The sharing part is where people stall. One post on X puts it plainly: “A lot of my output from Claude is in HTML. But is surprisingly awkward to share HTML files.” A link removes the awkward part.
Here is a finished page. The company and every number are made up.
<!doctype html>
<html lang="en">
<head>
<meta charset="utf-8">
<meta name="viewport" content="width=device-width, initial-scale=1">
<title>KPI dashboard - Larkspur Supply Co.</title>
<style>
  * { box-sizing: border-box; }
  body { margin: 0; padding: 16px; font: 16px/1.4 system-ui, -apple-system, "Segoe UI", sans-serif; color: #1d2330; background: #f4f5f7; }
  header { margin-bottom: 12px; }
  h1 { margin: 0 0 4px; font-size: 20px; }
  .meta { margin: 0; font-size: 14px; color: #4b5563; }
  .sample { display: inline-block; margin-left: 6px; padding: 1px 7px; border-radius: 99px; background: #fde68a; color: #78350f; font-size: 12px; font-weight: 700; }
  .grid { display: grid; grid-template-columns: repeat(auto-fit, minmax(210px, 1fr)); gap: 10px; }
  .tile { background: #fff; border: 1px solid #e1e4ea; border-radius: 10px; padding: 12px 14px; }
  .name { font-size: 14px; font-weight: 600; color: #374151; }
  .value { margin: 2px 0 6px; font-size: 28px; font-weight: 700; font-variant-numeric: tabular-nums; }
  .unit { font-size: 15px; font-weight: 500; color: #4b5563; }
  .track { position: relative; height: 8px; border-radius: 4px; background: #e5e7eb; margin: 8px 0 10px; }
  .fill { height: 100%; border-radius: 4px; }
  .tick { position: absolute; top: -4px; width: 2px; height: 16px; background: #1d2330; }
  .row { display: flex; justify-content: space-between; gap: 8px; font-size: 13px; color: #4b5563; }
  .pill { display: inline-block; margin-top: 8px; padding: 2px 9px; border-radius: 99px; font-size: 13px; font-weight: 700; }
  .ok { background: #dcfce7; color: #14532d; } .ok-fill { background: #16a34a; }
  .watch { background: #fef3c7; color: #78350f; } .watch-fill { background: #d97706; }
  .behind { background: #fee2e2; color: #7f1d1d; } .behind-fill { background: #dc2626; }
  footer { margin-top: 12px; font-size: 13px; color: #4b5563; }
</style>
</head>
<body>
<header>
  <h1>Sales and service KPIs <span class="sample">SAMPLE DATA</span></h1>
  <p class="meta" id="meta"></p>
</header>
<div class="grid" id="grid"></div>
<footer>
  On track: at or better than target. Watch: within 5% of target. Behind: further off than that.
  The numbers were typed in by hand. This page does not read a spreadsheet.
</footer>

<script>
  // Every number on the page lives here. Next month, change this block only.
  const DATA = {
    team: 'Larkspur Supply Co.',
    through: '30 Sep 2026',
    kpis: [
      { name: 'Revenue',                  unit: '$k', actual: 412, last: 388, target: 400, better: 'higher', dec: 0 },
      { name: 'New customers',            unit: '',   actual: 58,  last: 49,  target: 60,  better: 'higher', dec: 0 },
      { name: 'Repeat order rate',        unit: '%',  actual: 34,  last: 36,  target: 40,  better: 'higher', dec: 0 },
      { name: 'Average delivery time',    unit: 'days', actual: 3.1, last: 3.4, target: 3.0, better: 'lower', dec: 1 },
      { name: 'Tickets closed in 24 h',   unit: '%',  actual: 91,  last: 88,  target: 90,  better: 'higher', dec: 0 },
      { name: 'Return rate',              unit: '%',  actual: 4.2, last: 3.9, target: 3.5, better: 'lower', dec: 1 }
    ]
  };
  const WATCH_BAND = 0.05; // within 5% of target counts as Watch

  function status(k) {
    if (k.better === 'higher') {
      if (k.actual >= k.target) return 'ok';
      return k.actual >= k.target * (1 - WATCH_BAND) ? 'watch' : 'behind';
    }
    if (k.actual <= k.target) return 'ok';
    return k.actual <= k.target * (1 + WATCH_BAND) ? 'watch' : 'behind';
  }
  const LABEL = { ok: 'On track', watch: 'Watch', behind: 'Behind' };

  function el(tag, cls, text) {
    const e = document.createElement(tag);
    if (cls) e.className = cls;
    if (text !== undefined) e.textContent = text;
    return e;
  }

  document.getElementById('meta').textContent = DATA.team + ' - figures through ' + DATA.through;

  const grid = document.getElementById('grid');
  DATA.kpis.forEach((k) => {
    const s = status(k);
    const max = Math.max(k.actual, k.target) * 1.15;
    const diff = k.actual - k.last;
    const sign = diff > 0 ? '+' : diff < 0 ? '-' : '';
    const tile = el('div', 'tile');
    tile.appendChild(el('div', 'name', k.name));

    const v = el('div', 'value', k.actual.toFixed(k.dec));
    if (k.unit) v.appendChild(el('span', 'unit', ' ' + k.unit));
    tile.appendChild(v);

    const track = el('div', 'track');
    const fill = el('div', 'fill ' + s + '-fill');
    fill.style.width = (k.actual / max * 100) + '%';
    const tick = el('div', 'tick');
    tick.style.left = (k.target / max * 100) + '%';
    track.append(fill, tick);
    tile.appendChild(track);

    const row = el('div', 'row');
    row.append(el('span', '', 'Target ' + k.target.toFixed(k.dec)),
               el('span', '', sign + Math.abs(diff).toFixed(k.dec) + ' vs last month'));
    tile.appendChild(row);
    tile.appendChild(el('span', 'pill ' + s, LABEL[s]));
    grid.appendChild(tile);
  });
</script>
</body>
</html>
Each tile has the KPI name, this month's number, the target, the change since last month, and a status. The status is written out, so it does not depend on colour. The date at the top says which month the figures cover.
What goes on each tile
Keep a tile to what a reader needs to answer one question: are we where we said we would be?
- Name: short, in the words your team already uses.
- Actual: this period's number, with its unit.
- Target: the number you agreed, and whether higher or lower is better.
- Last period: so a reader sees the direction, not only the level.
- Status: On track, Watch or Behind, with the rule written at the bottom of the page.
Put the date the figures cover at the top. A dashboard with no date looks current long after it is not. The weekly update version uses the same idea for a status report.
Decide the status rule before you ask the AI. In the example, On track means at or better than target, Watch means within 5% of it, and Behind means further off.
Your team may want other bands. What matters is that the rule is on the page.
Make it with AI
Open the AI chat you already use, such as ChatGPT, Claude or Gemini. Paste the prompt, then your own figures under it.
Make a single-file HTML page: a KPI dashboard for
[team name], [month year].
Use only the numbers I give below. Do not invent, round
or estimate any figure. If something is missing, show "n/a".

Put every number in one DATA block at the top of the
script, so I can change them without touching the layout.
For each KPI show: name, actual, last period, target, and
whether higher or lower is better.

Show a status on each tile, in words as well as colour:
- On track: at or better than target
- Watch: within 5% of target
- Behind: further off than that
Write this rule at the bottom of the page.

Show "Figures through [date]" at the top, and a line saying
the numbers were typed in by hand.
One column on a phone, tiles side by side on a laptop.
Text 16px or larger. No external images, fonts or scripts.
Return only the HTML.

My numbers (KPI | actual | last period | target | higher
or lower is better):
[paste your rows here]
Check the result before you copy it:
- Every figure matches your sheet. Check all of them, not a sample, because AI can change a digit.
- Each KPI has the right direction. A cost or a return rate is easy to flip.
- Two statuses agree with your rule when you work them out by hand.
- The team name and date are right, and no square-bracket placeholder is left.
- In a narrow window the tiles stack into one column.
If your figures are confidential, check your company's rules before pasting them into an AI chat. If something is off, say so in the same chat and paste the new version. A longer prompt for a general HTML dashboard covers more layout rules.
Send it as a link
Open a NOS document and paste the HTML in. The page renders there with its script running, so the tiles and statuses show straight away. Look at it, then choose Create share link and copy the address.
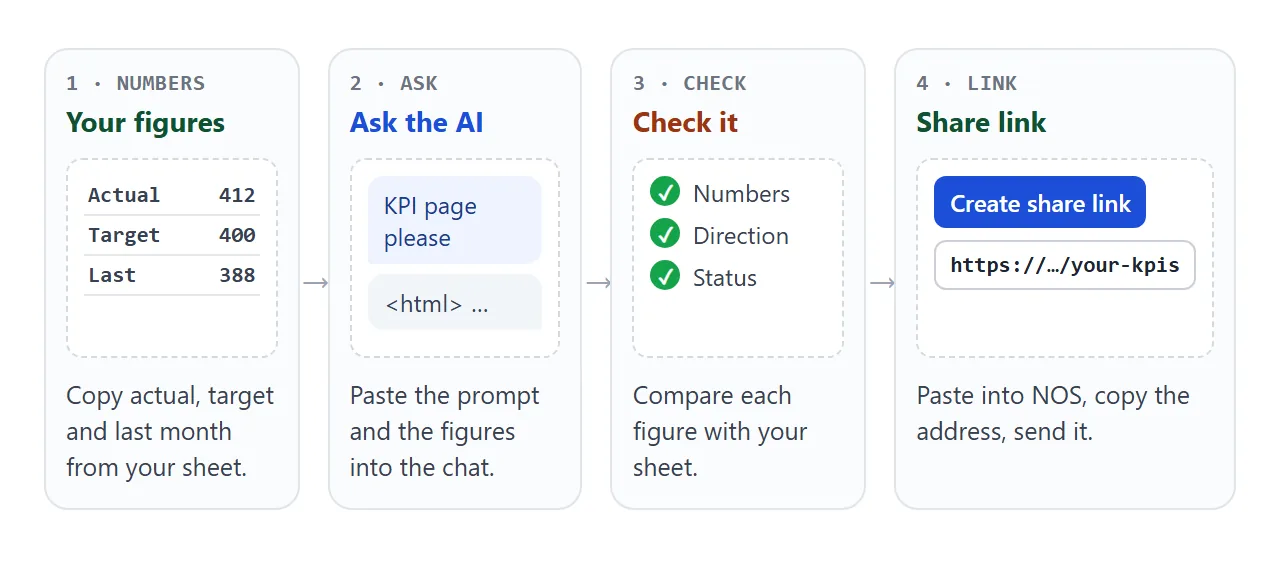
Anyone with the address can open the page in a browser, on a phone too, with no account. They can read it but not edit it. A shared page has no password.
Next month, change the numbers in the code. The link stays the same, so a message, a calendar invite or a slide that already holds it now shows the new figures. HTML to link walks through it.
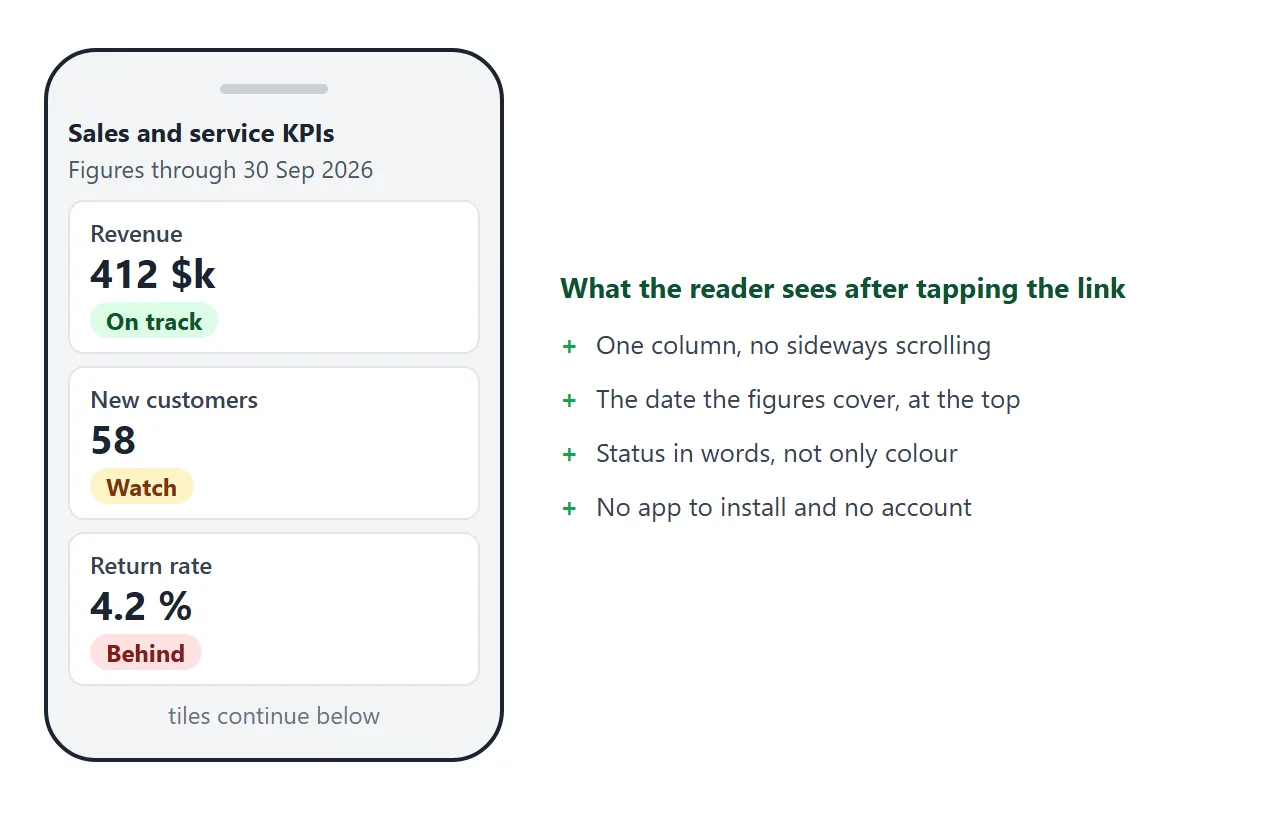
Paste the link wherever your readers already look: a chat message, the invite for the review meeting, an email or a slide. For a printed pack, turn it into a code with a QR code link.
Typed in, not live
This is the limit to say out loud when you send it. A page in NOS cannot fetch data from other sites, so it cannot pull from your spreadsheet. Its numbers are whatever you typed into the code.
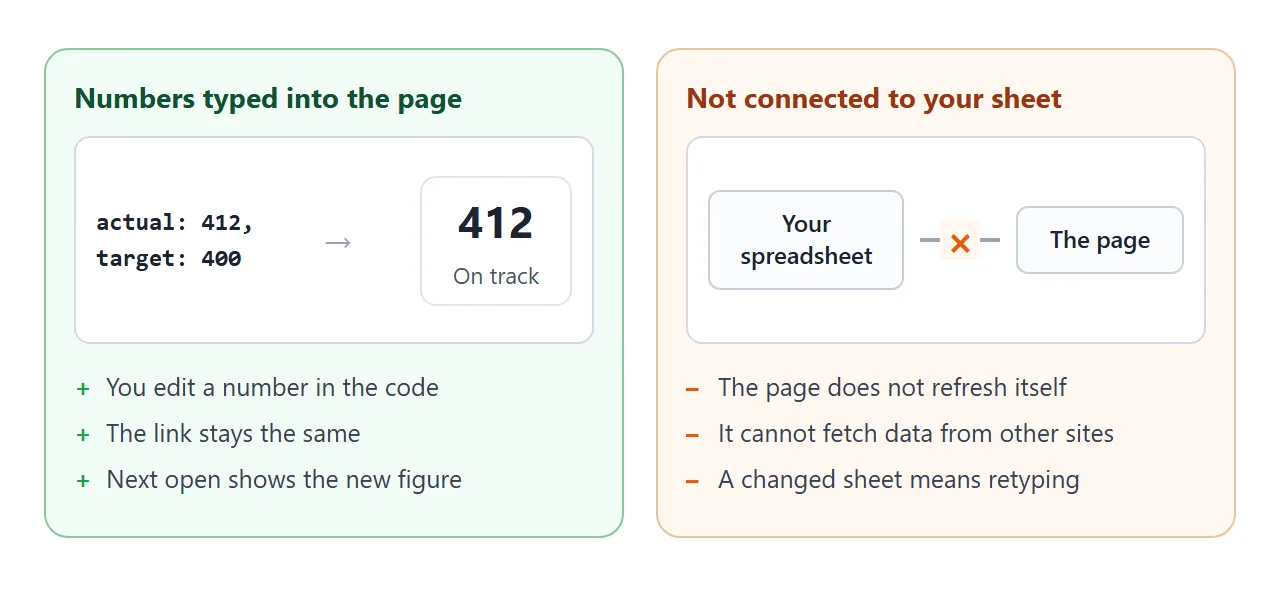
In practice the routine is short. Update your sheet as usual, copy the new figures into the DATA block, and the link everyone has shows them. The date at the top tells readers how fresh they are.
Which way to share depends on what readers need to do with the numbers.
| HTML page as a link | Google Sheets link | Power BI report | PDF or screenshot | |
|---|---|---|---|---|
| Who can open it | Anyone with the link, no account | Anyone with the link, if you set access that way | People you share with, under Power BI's license rules | Whoever gets the file |
| Where the numbers live | Typed into the page | In the sheet's cells | In the report's data | Frozen when exported |
| After you change a number | Edit the page, same link | Edit the sheet, same link | See Microsoft's help | Send a new file |
Google's Share files from Google Drive page says that anyone who has the link can use your file without signing in to a Google Account, once you pick that setting.
Microsoft's Share a filtered Power BI report page says that with sharing, you and your recipients need a Power BI Pro license, or the content needs to be in a Premium capacity. Both are as of October 2026.
A spreadsheet or a BI tool fits readers who want to filter or work in the data. A page fits readers who want one clear screen on a phone. For the case against sending the workbook itself, see sharing spreadsheet data without the file.
Keep three months on one page
Readers often ask what last month looked like. You can keep several months in the same block of numbers and let buttons choose which one to show.
<!doctype html>
<html lang="en">
<head>
<meta charset="utf-8">
<meta name="viewport" content="width=device-width, initial-scale=1">
<title>Warehouse scorecard - three months</title>
<style>
  * { box-sizing: border-box; }
  body { margin: 0; padding: 16px; font: 16px/1.4 system-ui, -apple-system, "Segoe UI", sans-serif; color: #1d2330; background: #f4f5f7; }
  h1 { margin: 0 0 4px; font-size: 20px; }
  .sample { display: inline-block; margin-left: 6px; padding: 1px 7px; border-radius: 99px; background: #fde68a; color: #78350f; font-size: 12px; font-weight: 700; }
  .meta { margin: 0 0 10px; font-size: 14px; color: #4b5563; }
  .tabs { display: flex; gap: 6px; margin-bottom: 10px; }
  .tabs button { font: inherit; font-size: 15px; padding: 6px 14px; border: 1px solid #cbd0d8; border-radius: 8px; background: #fff; color: #1d2330; cursor: pointer; }
  .tabs button[aria-pressed="true"] { background: #1d4ed8; border-color: #1d4ed8; color: #fff; }
  table { width: 100%; border-collapse: collapse; background: #fff; border: 1px solid #e1e4ea; border-radius: 10px; overflow: hidden; }
  th, td { padding: 9px 10px; text-align: left; border-bottom: 1px solid #eef0f3; font-size: 15px; vertical-align: top; }
  th { font-size: 13px; color: #4b5563; background: #fafbfc; }
  tr:last-child td { border-bottom: 0; }
  .num { text-align: right; font-variant-numeric: tabular-nums; }
  .small { display: block; font-size: 12px; color: #4b5563; font-weight: 400; }
  .pill { display: inline-block; padding: 2px 8px; border-radius: 99px; font-size: 13px; font-weight: 700; white-space: nowrap; }
  .ok { background: #dcfce7; color: #14532d; }
  .watch { background: #fef3c7; color: #78350f; }
  .behind { background: #fee2e2; color: #7f1d1d; }
  footer { margin-top: 10px; font-size: 13px; color: #4b5563; }
</style>
</head>
<body>
<h1>Warehouse scorecard <span class="sample">SAMPLE DATA</span></h1>
<p class="meta">Larkspur Supply Co. - typed in by hand, three months kept on this page</p>
<div class="tabs" id="tabs"></div>
<table>
  <thead><tr><th>KPI</th><th class="num">Actual</th><th class="num">Target</th><th>Status</th></tr></thead>
  <tbody id="body"></tbody>
</table>
<footer>On track: at or better than target. Watch: within 5%. Behind: further off than that.</footer>

<script>
  // All numbers are written here. Add next month as one more entry in "months".
  const KPIS = [
    { name: 'Orders shipped',               target: 1250, better: 'higher', dec: 0 },
    { name: 'Shipped on time (%)',          target: 96,   better: 'higher', dec: 0 },
    { name: 'Pick errors per 1,000 orders', target: 5.0,  better: 'lower',  dec: 1 },
    { name: 'Stock-outs (items)',           target: 10,   better: 'lower',  dec: 0 },
    { name: 'Overtime hours',               target: 150,  better: 'lower',  dec: 0 }
  ];
  const MONTHS = [
    { label: 'Jul 2026', values: [1180, 94, 6.1, 14, 160] },
    { label: 'Aug 2026', values: [1240, 95, 5.4, 11, 142] },
    { label: 'Sep 2026', values: [1315, 93, 4.8, 12, 171] }
  ];
  const BAND = 0.05;
  const LABEL = { ok: 'On track', watch: 'Watch', behind: 'Behind' };

  function status(k, actual) {
    if (k.better === 'higher') {
      if (actual >= k.target) return 'ok';
      return actual >= k.target * (1 - BAND) ? 'watch' : 'behind';
    }
    if (actual <= k.target) return 'ok';
    return actual <= k.target * (1 + BAND) ? 'watch' : 'behind';
  }

  function el(tag, cls, text) {
    const e = document.createElement(tag);
    if (cls) e.className = cls;
    if (text !== undefined) e.textContent = text;
    return e;
  }

  const tabs = document.getElementById('tabs');
  const body = document.getElementById('body');

  function show(i) {
    [...tabs.children].forEach((b, n) => b.setAttribute('aria-pressed', String(n === i)));
    body.textContent = '';
    KPIS.forEach((k, n) => {
      const actual = MONTHS[i].values[n];
      const tr = el('tr');
      tr.appendChild(el('td', '', k.name));

      const a = el('td', 'num', actual.toFixed(k.dec));
      let note = 'first month';
      if (i > 0) {
        const d = actual - MONTHS[i - 1].values[n];
        note = (d > 0 ? '+' : d < 0 ? '-' : '') + Math.abs(d).toFixed(k.dec) + ' vs ' + MONTHS[i - 1].label.slice(0, 3);
      }
      a.appendChild(el('span', 'small', note));
      tr.appendChild(a);

      tr.appendChild(el('td', 'num', k.target.toFixed(k.dec)));
      const s = status(k, actual);
      const td = el('td');
      td.appendChild(el('span', 'pill ' + s, LABEL[s]));
      tr.appendChild(td);
      body.appendChild(tr);
    });
  }

  MONTHS.forEach((m, i) => {
    const b = el('button', '', m.label);
    b.type = 'button';
    b.addEventListener('click', () => show(i));
    tabs.appendChild(b);
  });
  show(MONTHS.length - 1);
</script>
</body>
</html>
You do not need buttons for a first version. Add them when people start asking. Each period, add one more month to the block instead of replacing the old ones.
When it does not work
| Symptom | Cause | Fix |
|---|---|---|
| A status looks wrong | The AI flipped higher or lower is better, or used its own rule | Put the rule in the prompt and check two tiles by hand |
| A number differs from your sheet | The AI changed a digit or rounded it | Compare every figure, and ask for your numbers exactly |
| Tiles are empty | The reply was cut off when you copied it | Copy the whole reply, down to the closing tags |
| You asked it to read your Google Sheet and nothing loads | A page cannot fetch data from other sites | Copy the numbers into the page |
| Readers still see last month | You updated the sheet but not the page | Edit the numbers in the page. The same link shows them |
| A logo or picture is missing | The AI used an outside image, which is blocked | Ask for shapes and colours only |
| The page looks tiny on a phone | The AI left out the phone settings | Ask for one column and text of 16px or larger |
If the page will not open on a phone at all, opening an HTML file on a phone covers the usual causes.