To turn an Excel sheet into a dashboard with AI, copy the figures you want to show and paste them into ChatGPT, Claude or Gemini. Ask for one HTML page. Paste that page into NOS, create a share link, and send it.
One thing decides how you use it: the page keeps the numbers you pasted. It does not read the spreadsheet again.
The alternative is a PDF or a screenshot. One person writing about exporting from Claude put it like this: "save as pdf, layout shifts. always end up just screenshotting." A link skips the export. Nobody saves, resizes or crops anything.
Here is the kind of page you can get. The numbers sit in one block at the top of the code. Change a figure there and the cards, the chart and the table all change with it.
<!doctype html>
<html lang="en">
<head>
<meta charset="utf-8">
<meta name="viewport" content="width=device-width, initial-scale=1">
<title>Larkspur Outfitters - Sales dashboard, September</title>
<style>
  *{box-sizing:border-box;margin:0}
  body{font-family:system-ui,-apple-system,"Segoe UI",sans-serif;background:#f6f7f9;color:#1d2330;padding:20px 16px 28px;line-height:1.45}
  .wrap{max-width:860px;margin:0 auto}
  h1{font-size:22px;line-height:1.25}
  .when{margin-top:6px;font-size:14px;color:#4b5563}
  .cards{display:grid;grid-template-columns:repeat(auto-fit,minmax(170px,1fr));gap:10px;margin-top:16px}
  .card{background:#fff;border:1px solid #e1e4ea;border-radius:10px;padding:12px 14px}
  .card .lab{font-size:13px;color:#4b5563}
  .card .val{font-size:26px;font-weight:700;margin-top:2px;font-variant-numeric:tabular-nums}
  .card .sub{font-size:13px;color:#4b5563;margin-top:2px}
  .up{color:#0f5132;font-weight:600}.down{color:#9a3412;font-weight:600}
  section{background:#fff;border:1px solid #e1e4ea;border-radius:10px;padding:14px;margin-top:12px}
  h2{font-size:16px;margin-bottom:10px}
  .bars{display:flex;align-items:flex-end;gap:8px;height:170px;border-bottom:1px solid #9aa3b2;padding-top:20px}
  .col{flex:1;display:flex;flex-direction:column;justify-content:flex-end;align-items:center;height:100%;min-width:0}
  .bar{width:100%;max-width:64px;background:#9db7e8;border-radius:4px 4px 0 0}
  .col.last .bar{background:#2563eb}
  .num{font-size:12px;color:#1d2330;margin-bottom:3px;font-variant-numeric:tabular-nums}
  .names{display:flex;gap:8px;margin-top:5px}
  .names span{flex:1;text-align:center;font-size:13px;color:#4b5563}
  table{width:100%;border-collapse:collapse;font-size:14px}
  th,td{padding:8px 6px;border-bottom:1px solid #eceef2;text-align:right;font-variant-numeric:tabular-nums}
  th:first-child,td:first-child{text-align:left}
  th{font-weight:600;color:#4b5563;font-size:13px}
  .note{font-size:13px;color:#4b5563;margin-top:12px}
</style>
</head>
<body>
<div class="wrap">
  <h1 id="title">Larkspur Outfitters: sales by region</h1>
  <p class="when" id="when"></p>
  <div class="cards" id="cards"></div>
  <section>
    <h2>Revenue by month, all regions (thousand USD)</h2>
    <div class="bars" id="bars"></div>
    <div class="names" id="names"></div>
  </section>
  <section>
    <h2 id="cmp"></h2>
    <table>
      <thead><tr><th>Region</th><th id="h1"></th><th id="h2"></th><th>Change</th></tr></thead>
      <tbody id="rows"></tbody>
    </table>
  </section>
  <p class="note">These figures were typed into this page from the sales workbook. The page does not read the workbook, so it changes only when someone edits the numbers.</p>
</div>
<script>
  // 1. Edit only this block. Everything below rebuilds from it.
  var AS_OF = "30 Sep 2026";
  var MONTHS = ["Apr", "May", "Jun", "Jul", "Aug", "Sep"];
  var REGIONS = {
    "North": [41, 44, 47, 52, 55, 61],
    "South": [38, 36, 40, 43, 41, 39],
    "East":  [29, 33, 35, 34, 38, 44],
    "West":  [22, 25, 24, 28, 31, 33]
  };

  // 2. Work out the totals from the numbers above.
  var names = Object.keys(REGIONS);
  var last = MONTHS.length - 1;
  var totals = MONTHS.map(function (m, i) {
    return names.reduce(function (sum, r) { return sum + REGIONS[r][i]; }, 0);
  });
  var sixMonth = totals.reduce(function (a, b) { return a + b; }, 0);
  var change = (totals[last] - totals[last - 1]) / totals[last - 1] * 100;
  var bestRegion = names.slice().sort(function (a, b) { return REGIONS[b][last] - REGIONS[a][last]; })[0];

  function pct(n) { return (n >= 0 ? "+" : "") + n.toFixed(1) + "%"; }
  function cls(n) { return n >= 0 ? "up" : "down"; }
  function el(id) { return document.getElementById(id); }

  // 3. Draw the page.
  el("when").textContent = "Figures through " + AS_OF + ". Typed in from the workbook, not live.";
  el("cards").innerHTML =
    '<div class="card"><div class="lab">' + MONTHS[last] + ' revenue</div><div class="val">$' + totals[last] + 'k</div>' +
    '<div class="sub"><span class="' + cls(change) + '">' + pct(change) + '</span> vs ' + MONTHS[last - 1] + '</div></div>' +
    '<div class="card"><div class="lab">Six-month total</div><div class="val">$' + sixMonth + 'k</div><div class="sub">' + MONTHS[0] + ' to ' + MONTHS[last] + '</div></div>' +
    '<div class="card"><div class="lab">Top region in ' + MONTHS[last] + '</div><div class="val">' + bestRegion + '</div><div class="sub">$' + REGIONS[bestRegion][last] + 'k of $' + totals[last] + 'k</div></div>';

  var max = Math.max.apply(null, totals);
  el("bars").innerHTML = totals.map(function (t, i) {
    return '<div class="col' + (i === last ? ' last' : '') + '" title="' + MONTHS[i] + ': $' + t + 'k">' +
      '<div class="num">' + t + '</div><div class="bar" style="height:' + Math.round(t / max * 130) + 'px"></div></div>';
  }).join("");
  el("names").innerHTML = MONTHS.map(function (m) { return "<span>" + m + "</span>"; }).join("");

  el("cmp").textContent = MONTHS[last - 1] + " vs " + MONTHS[last] + " by region (thousand USD)";
  el("h1").textContent = MONTHS[last - 1];
  el("h2").textContent = MONTHS[last];
  el("rows").innerHTML = names.map(function (r) {
    var a = REGIONS[r][last - 1], s = REGIONS[r][last], c = (s - a) / a * 100;
    return "<tr><td>" + r + "</td><td>" + a + "</td><td>" + s + '</td><td class="' + cls(c) + '">' + pct(c) + "</td></tr>";
  }).join("");
</script>
</body>
</html>
Make it with AI
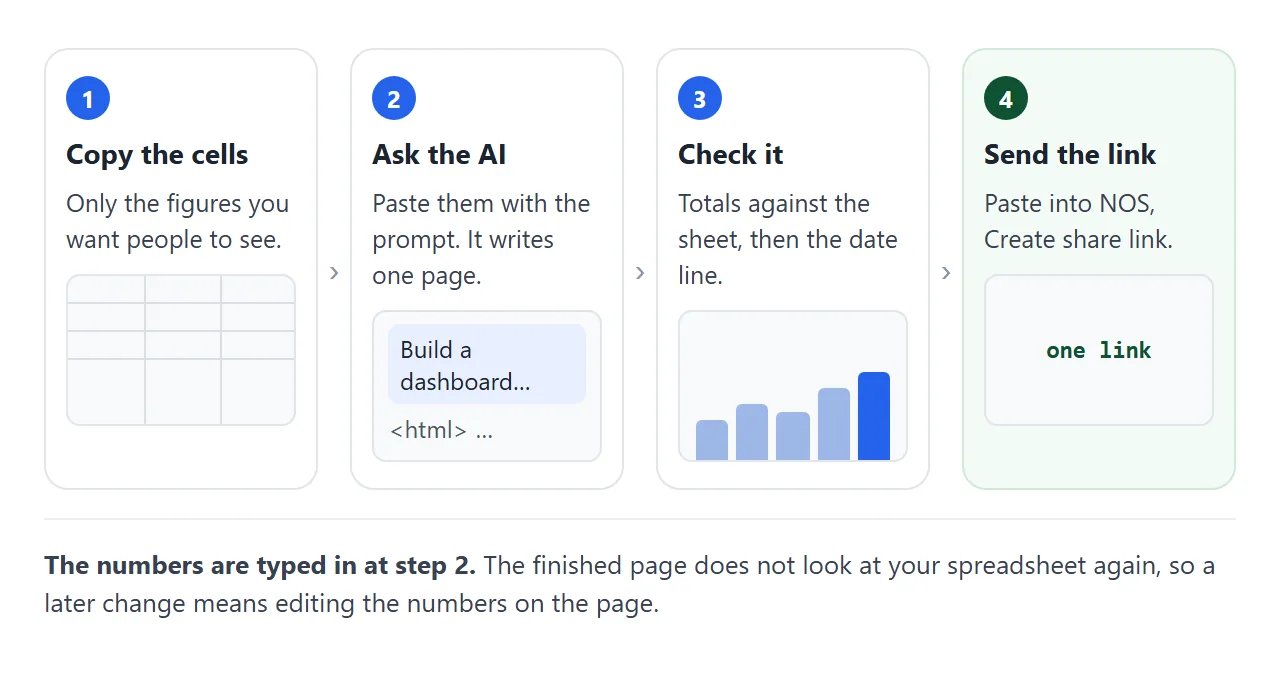
Paste this into ChatGPT, Claude or Gemini, then paste your cells where it says. Keep the header row in the copy so the AI knows what each column is.
Build one self-contained HTML page: a dashboard for the
figures below.

- One file. No external images, fonts or scripts.
- Put every number in one data block at the top of the
  script. The page must draw itself from that block.
- Show 3 headline cards, one bar chart and one table.
- Under the title, write "Figures through" and the date.
- On a phone the cards stack into one column.
- Use only the numbers I give you. Do not invent or
  round anything. If something is missing, write TODO.

Figures (copied from Excel, header row first):
<paste your cells here>
Before you paste company figures into any AI tool, check your workplace's rules on what may be shared.
What to check in the result
- Totals. Add up each column in the sheet and on the page. A dashboard that looks right can still carry one wrong digit.
- The data block. It should be at the top of the script, in plain lists you can read. If the numbers are scattered through the page, ask again.
- Percentages. Recalculate one by hand. AI is good at layout and loose with arithmetic.
- Units and dates. Thousands or millions, dollars or euros, and the date line.
- Phone width. Narrow your browser window. The cards should stack.
Check the numbers before the AI sees them
Pasted cells can arrive with a stray note, an empty cell or a number stored as text. This page reads what you paste, adds the totals and builds a clean data block. Compare its Total row with your sheet before going on.
<!doctype html>
<html lang="en">
<head>
<meta charset="utf-8">
<meta name="viewport" content="width=device-width, initial-scale=1">
<title>Paste cells, check them, get the data block</title>
<style>
*{box-sizing:border-box;margin:0}
body{font-family:system-ui,-apple-system,"Segoe UI",sans-serif;background:#f6f7f9;color:#1d2330;padding:20px 16px 28px;line-height:1.45}
.wrap{max-width:860px;margin:0 auto}
h1{font-size:21px;line-height:1.25}
p.lead{font-size:14px;color:#4b5563;margin-top:6px}
label{display:block;font-size:14px;font-weight:600;margin:16px 0 6px}
textarea{width:100%;height:120px;font:13px/1.45 ui-monospace,Consolas,monospace;padding:10px;border:1px solid #c9ced8;border-radius:8px;background:#fff;color:#1d2330;resize:vertical}
.btns{display:flex;flex-wrap:wrap;gap:8px;margin-top:8px}
button{font:600 14px system-ui,sans-serif;padding:9px 14px;border-radius:8px;border:1px solid #c9ced8;background:#fff;color:#1d2330;cursor:pointer;min-height:40px}
button.main{background:#2563eb;border-color:#2563eb;color:#fff}
.box{background:#fff;border:1px solid #e1e4ea;border-radius:10px;padding:12px 14px;margin-top:12px}
.ok{color:#0f5132;font-weight:600}.bad{color:#9a3412;font-weight:600}
table{width:100%;border-collapse:collapse;font-size:14px;margin-top:8px}
th,td{padding:7px 6px;border-bottom:1px solid #eceef2;text-align:right;font-variant-numeric:tabular-nums}
th:first-child,td:first-child{text-align:left}
th{font-weight:600;color:#4b5563;font-size:13px}
tr.total td{font-weight:700;border-top:2px solid #9aa3b2}
pre{font:12.5px/1.5 ui-monospace,Consolas,monospace;background:#f1f3f7;border-radius:8px;padding:10px;white-space:pre-wrap;word-break:break-word;margin-top:8px;max-height:200px;overflow:auto}
.hint{font-size:13px;color:#4b5563;margin-top:6px}
.scroll{overflow-x:auto}
</style>
</head>
<body>
<div class="wrap">
<h1>Check your numbers before the AI sees them</h1>
<p class="lead">Copy the cells from your sheet, including the header row, and paste them below. This page reads them, adds the totals, and builds the data block for the dashboard. Nothing leaves this page.</p>
<label for="paste">Cells from your spreadsheet</label>
<textarea id="paste" placeholder="Region, Aug, Sep (header row first) North, 55, 61 South, 41, 39"></textarea>
<div class="btns">
<button class="main" id="go" type="button">Check the numbers</button>
<button id="example" type="button">Load an example</button>
<button id="clear" type="button">Clear</button>
</div>
<p class="hint">Columns can be separated by tabs or by commas.</p>
<div class="box" id="status" aria-live="polite">Nothing checked yet.</div>
<div class="box scroll" id="tablebox" hidden></div>
<div class="box" id="codebox" hidden>
<strong>Data block for the dashboard</strong>
<pre id="code"></pre>
<div class="btns"><button id="select" type="button">Select the block</button></div>
<p class="hint">Select it, copy it, and paste it over the data block in the dashboard code.</p>
</div>
</div>
<script>
var $ = function (id) { return document.getElementById(id); };
function parse(text) {
var lines = text.split(/\r?\n/).filter(function (l) { return l.trim() !== ""; });
var problems = [], rows = [];
lines.forEach(function (line, r) {
var tabs = line.indexOf("\t") > -1;
var cells = line.split(tabs ? "\t" : ",").map(function (c) { return c.trim(); });
if (r === 0) { rows.push(cells); return; }
var out = [cells[0]];
for (var c = 1; c < cells.length; c++) {
var raw = cells[c];
var clean = raw.replace(/[$\s]/g, "");
if (tabs) clean = clean.replace(/,/g, "");
var n = Number(clean);
if (raw === "" || isNaN(n)) { problems.push("Row " + (r + 1) + ", column " + (c + 1) + ": \"" + raw + "\" is not a number"); out.push(null); }
else out.push(n);
}
rows.push(out);
});
return { rows: rows, problems: problems };
}
function check() {
var res = parse($("paste").value);
var rows = res.rows;
if (rows.length < 2) { $("status").innerHTML = '<span class="bad">Paste a header row and at least one row of numbers.</span>'; $("tablebox").hidden = true; $("codebox").hidden = true; return; }
var head = rows[0], body = rows.slice(1);
var sums = head.slice(1).map(function (h, i) {
return body.reduce(function (s, row) { return s + (row[i + 1] || 0); }, 0);
});
var html = "<table><thead><tr>" + head.map(function (h) { return "<th>" + h + "</th>"; }).join("") + "</tr></thead><tbody>";
body.forEach(function (row) {
html += "<tr>" + row.map(function (v, i) { return "<td>" + (v === null ? "?" : v) + "</td>"; }).join("") + "</tr>";
});
html += '<tr class="total"><td>Total</td>' + sums.map(function (s) { return "<td>" + s + "</td>"; }).join("") + "</tr></tbody></table>";
$("tablebox").innerHTML = html + '<p class="hint">Compare the Total row with the total row in your sheet. If they differ, fix the paste before going on.</p>';
$("tablebox").hidden = false;
if (res.problems.length) {
$("status").innerHTML = '<span class="bad">' + res.problems.length + " cell(s) to fix:</span><br>" + res.problems.join("<br>");
$("codebox").hidden = true;
return;
}
$("status").innerHTML = '<span class="ok">' + body.length + " rows and " + (head.length - 1) + " columns read, all numbers.</span>";
var code = "var MONTHS = " + JSON.stringify(head.slice(1)) + ";\nvar REGIONS = {\n" +
body.map(function (row) { return " " + JSON.stringify(row[0]) + ": " + JSON.stringify(row.slice(1)); }).join(",\n") + "\n};";
$("code").textContent = code;
$("codebox").hidden = false;
}
$("go").addEventListener("click", check);
$("example").addEventListener("click", function () {
$("paste").value = ["Region\tApr\tMay\tJun", "North\t41\t44\t47", "South\t38\t36\t40", "East\t29\t33\t35", "West\t22\t25\t24"].join("\n");
check();
});
$("clear").addEventListener("click", function () {
$("paste").value = ""; $("status").textContent = "Nothing checked yet.";
$("tablebox").hidden = true; $("codebox").hidden = true;
});
$("select").addEventListener("click", function () {
var range = document.createRange(); range.selectNodeContents($("code"));
var sel = window.getSelection(); sel.removeAllRanges(); sel.addRange(range);
});
</script>
</body>
</html>
If the columns run together when you paste, save the sheet as a CSV file and paste that text instead. In Excel, choose File, then Save As, then CSV (Comma delimited).
Excel saves only the current worksheet, and the default separator is a comma, as of October 2026.
Send it as a link
Copy the whole page the AI gave you, paste it into a NOS document, and choose Create share link. HTML to link walks through it. The page renders as written, with its scripts running.
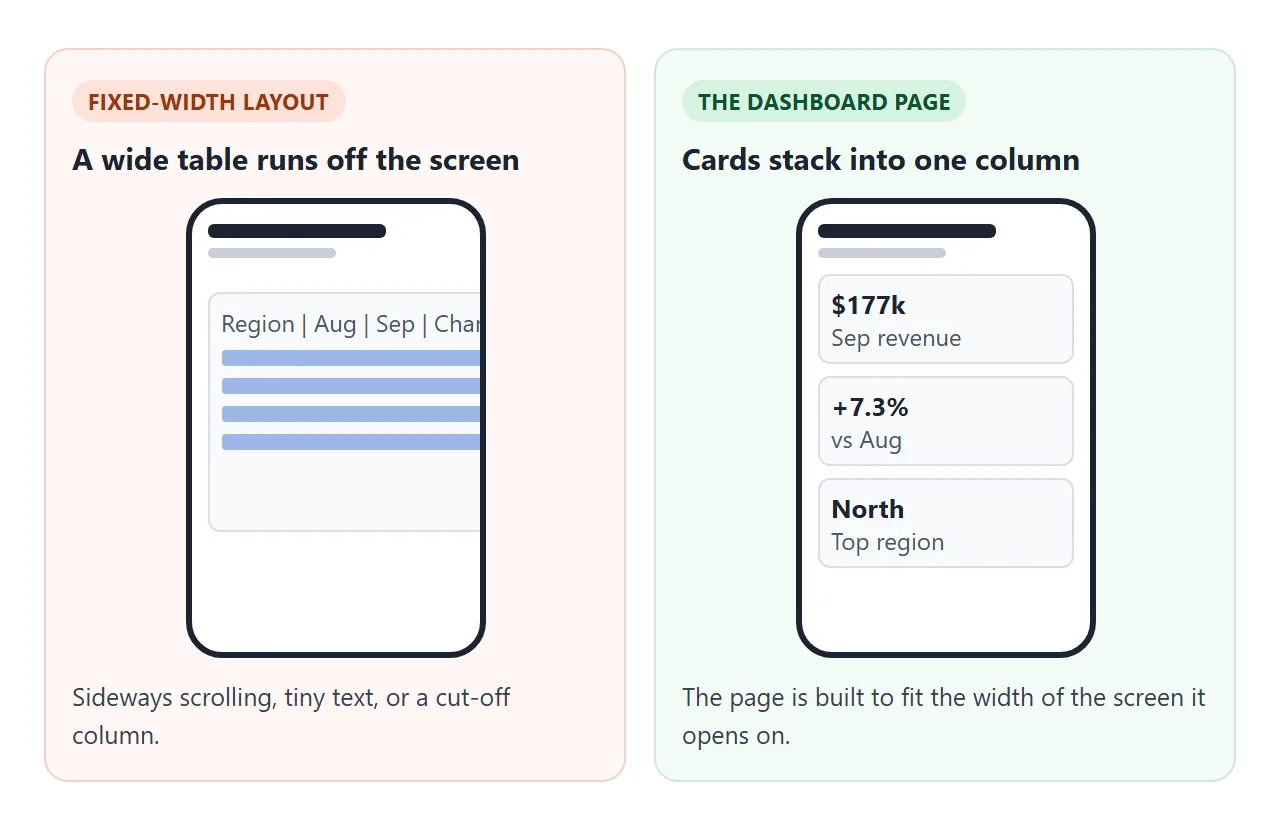
The person you send it to opens the link in a browser, on a phone too. They need no account, and they cannot edit the page. If you change the code later, the same link shows the new version.
Paste the link into an email or a chat message like any other link. Two limits matter for a dashboard. Anyone who has the link can open it, and NOS has no password option. A form that sends data to a server is blocked.
When the sheet changes
The page does not follow the sheet. If a figure changes on Tuesday, the link still shows last Friday's figure until you change the page.
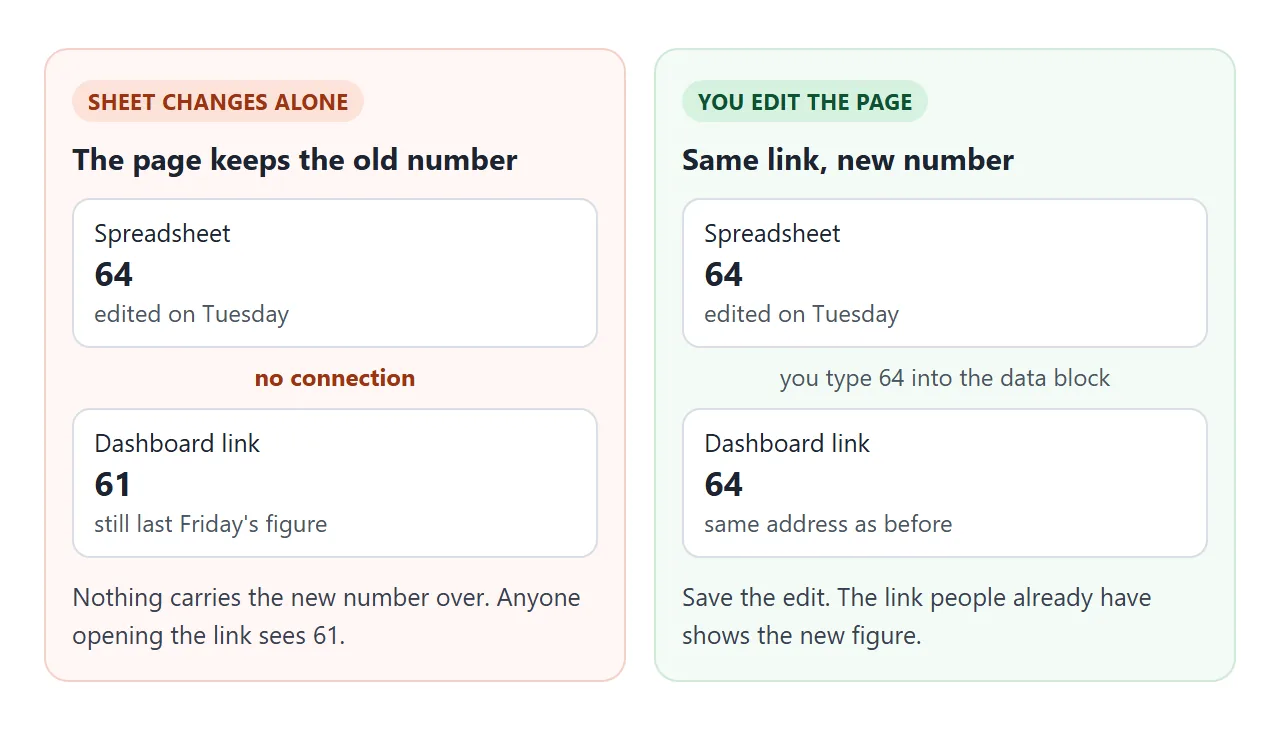
You have two ways to update it:
- Edit the data block. Open the page in NOS, type the new numbers into the block at the top of the script, and save. The link stays the same.
- Ask again. Paste the new cells into the same chat and ask for a new page with the same layout. Then replace the code in NOS.
The first is faster for a few numbers. The second suits a new month with new rows. Either way, change the date line too, and tell people to reload if they already had the page open.
A page cannot pull the new figures from your sheet itself, because fetching data from other sites is blocked on a NOS share link.
For a dashboard that is more than a snapshot, you need a tool built for live connections. A typed-in page suits a report that goes out weekly or monthly.
Link, PDF, screenshot or file
| Excel file | Screenshot | Page link | ||
|---|---|---|---|---|
| What the reader gets | The workbook, every sheet in it | Fixed pages | One picture | Only what is on the page |
| When the numbers change | Send a new file | Export and send again | Take it again | Edit the page, same link |
| Reads the sheet again by itself | No | No | No | No |
| Shape on a small screen | Depends on the app | Fixed page size | Fixed picture size | Built to fit the width |
For the PDF column: to fit a sheet on one page, Excel shrinks your data to fit the number of pages you choose, per Microsoft's help, as of October 2026.
Screenshot or live page covers the picture case. Sharing spreadsheet data without the file covers what a workbook carries with it.
When it does not work
| What you see | Cause | Fix |
|---|---|---|
| The page shows last week's numbers | The page does not read the sheet | Edit the data block, or ask the AI again |
| A total differs from the sheet | The AI changed or dropped a number | Compare each column and ask it to fix the block |
| Numbers are scattered through the page | No data block was requested | Ask for one block at the top of the script |
| The chart is empty | A cell was text, such as "n/a" | Fix the cell, check it in the paste checker |
| Columns run together when pasted | The cells came through without separators | Paste a CSV export instead |
| The AI added figures you never gave it | It filled gaps on its own | Ask for TODO in place of anything missing |
| A reader says they cannot edit it | Share links are view-only | That is intended. Send them the sheet if they need to work in it |
For a longer prompt to start from, see a prompt for an HTML dashboard. Sharing a dashboard as a link covers the date line and the phone layout in more detail.