A data link is a dataset published at an address with its documentation on the same page, so somebody can use it without asking you what the columns mean.
The file is the easy part. The documentation is what makes the data usable.
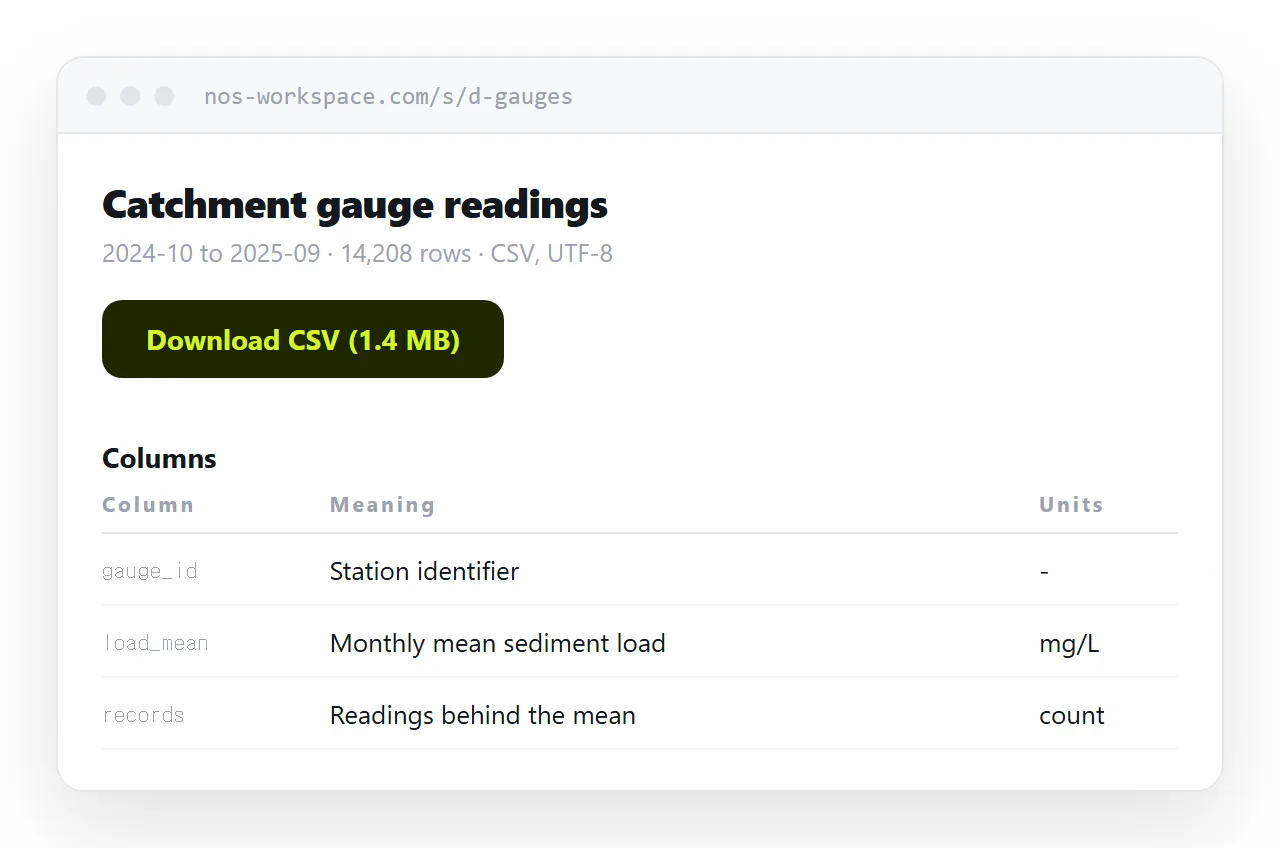
This guide covers format, the five things documentation must answer, versioning, and licensing.
CSV, unless you have a reason
For tabular data, CSV is the right default.
It is read by every tool, it has no version compatibility problem, and it contains exactly the data and nothing else. A workbook, by contrast, carries hidden sheets, formulas, filtered rows and author metadata, which is both more than you meant to send and harder for a user to work with.
Offer JSON alongside if a meaningful part of your audience is writing code. For anything hierarchical rather than tabular, JSON should be the primary form.
A few CSV details that prevent support emails.
- UTF-8, with the encoding stated. Names and place names break otherwise.
- ISO dates, as 2026-09-18. Ambiguous formats cause silent errors.
- A header row with short, machine-friendly column names.
- No merged cells, no blank rows, no totals row. Totals belong in the page, not in the data.
- One table per file. Two tables in one CSV is not a CSV.
The five things documentation has to answer
Every question a user emails you is one of these.
| Question | What to state |
|---|---|
| What does this column mean | A sentence per column, in plain words |
| What units | Per column. Currency, and which currency |
| What does an empty cell mean | Blank, zero and not-applicable are different |
| What period does it cover | Start and end, and what timezone if it matters |
| Where did it come from | The source, and how it was processed |
The third is the one most often missed and most damaging. A user who treats missing values as zero will produce a wrong answer confidently.
<table class="cols">
  <tr><th>Column</th><th>Meaning</th><th>Units</th></tr>
  <tr><td>gauge_id</td><td>Station identifier, stable across years</td><td>-</td></tr>
  <tr><td>load_mean</td><td>Monthly mean sediment load</td><td>mg/L</td></tr>
  <tr><td>records</td><td>Readings the mean is calculated from</td><td>count</td></tr>
</table>
The last column in that example matters more than it looks. A mean calculated from four readings is not the same claim as one from four hundred, and publishing the count lets a user judge.
Say what you did to it
Raw data is rare. Almost everything published has been cleaned, aggregated or corrected.
Say what. Which rows were excluded and why, how gaps were filled, whether outliers were removed, what was rounded. A user who knows you interpolated gaps shorter than three days can decide whether that suits their purpose.
This is also what lets somebody reproduce your figures. If the numbers in your report do not match what they get from the data, the processing note is where the difference lives.
Versioning
Decide what the address means and say so.
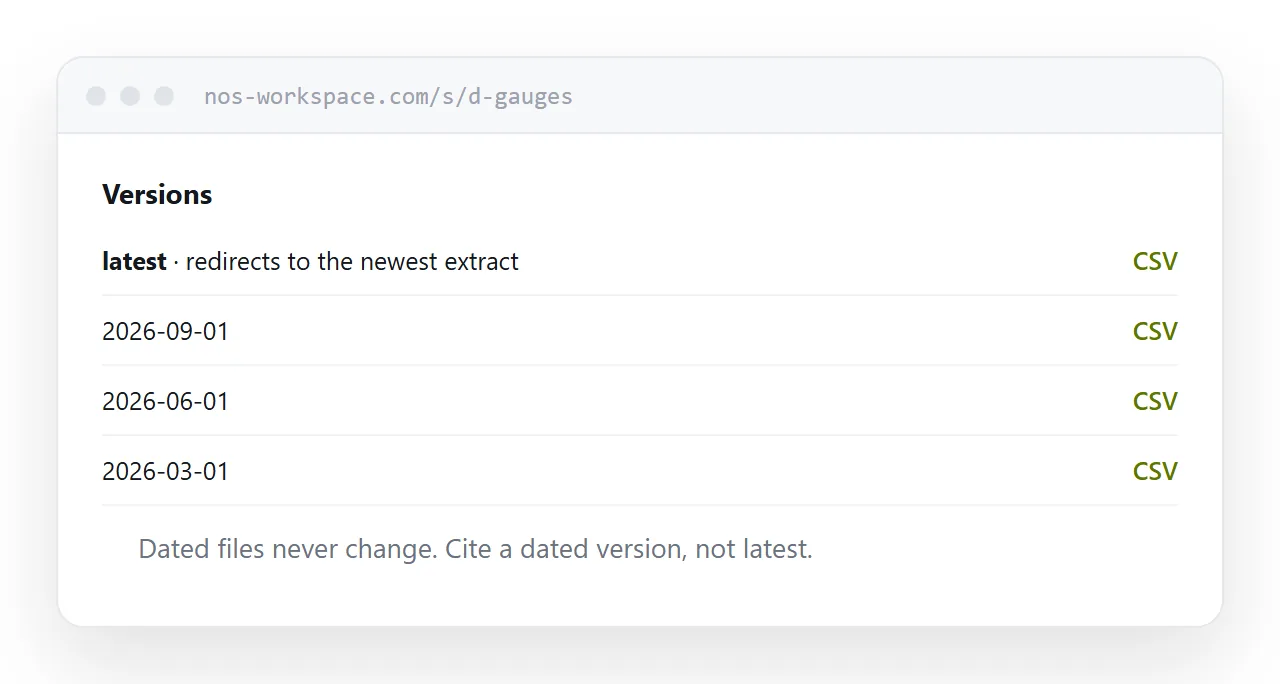
A "latest" address that always holds the current extract is useful for anything automated. A dated address is necessary for anyone citing the data in a report, because a citation pointing at a moving target is not a citation.
Do both. Dated files that never change, plus a latest link that redirects. State the convention on the page so nobody has to guess.
Keep the old versions. Someone will need to work out why last quarter's figure was different, and deleting the extract it came from makes that impossible.
Licensing
State it plainly, even when the answer is that anyone may use it.
A user who cannot tell whether redistribution is permitted either avoids your data or uses it and hopes. Where the data includes anything from a third party, say what that is and under what terms, since your licence cannot cover material you do not own.
What belongs on the page rather than in the file
Keep the data clean and put the interpretation in the page.
Totals, charts, notable findings and caveats all belong in the page text. A totals row inside the CSV breaks every tool that reads it, and a chart in a workbook cannot be used by anybody analysing the numbers.
If you want to show the figures as well as supply them, dashboard to link covers the presentation side.
Put it at an address
Publish CSV, document every column with its units, say how gaps are represented and what you did to the data, date the version, state the licence, and create a share link.
Then nobody has to email you asking what a column means.