At the traffic a freelance site gets, most of what an analytics product reports is statistical noise presented confidently.
Why the percentages lie
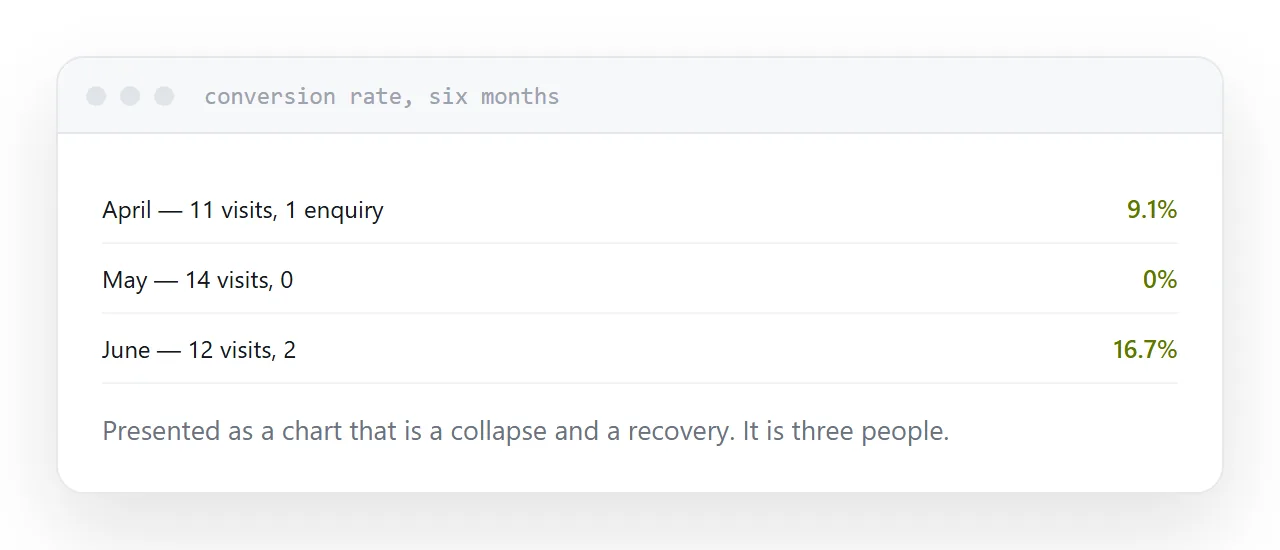
Twelve visits and one enquiry is eight percent. Next month, twelve visits and two enquiries is seventeen percent.
Presented as a chart, that is a doubling. In reality one additional person made contact, which could be a coincidence, a referral, or nothing at all.
At this scale every rate moves several points on one person. Treating those movements as findings produces changes that do nothing, and a fair amount of anxiety.
| Figure | Useful at 12 visits/day |
|---|---|
| Enquiries per month | Yes |
| Visits per page | Yes |
| Where visitors came from | Yes |
| Search terms used | Yes |
| Conversion rate | No |
| Bounce rate | No |
| Session duration average | No |
The three worth watching
Visits per page. Which pages people reach. Usually a surprise, and usually it is one project write-up carrying most of the traffic rather than the homepage.
Where they came from. Search, a link somewhere, a message, or typed directly. It tells you which of your efforts produced anything.
Search terms. From search engine tools rather than analytics, free, and the most useful of the three. The actual words people used, which are never the words you would have chosen.
Count enquiries by hand
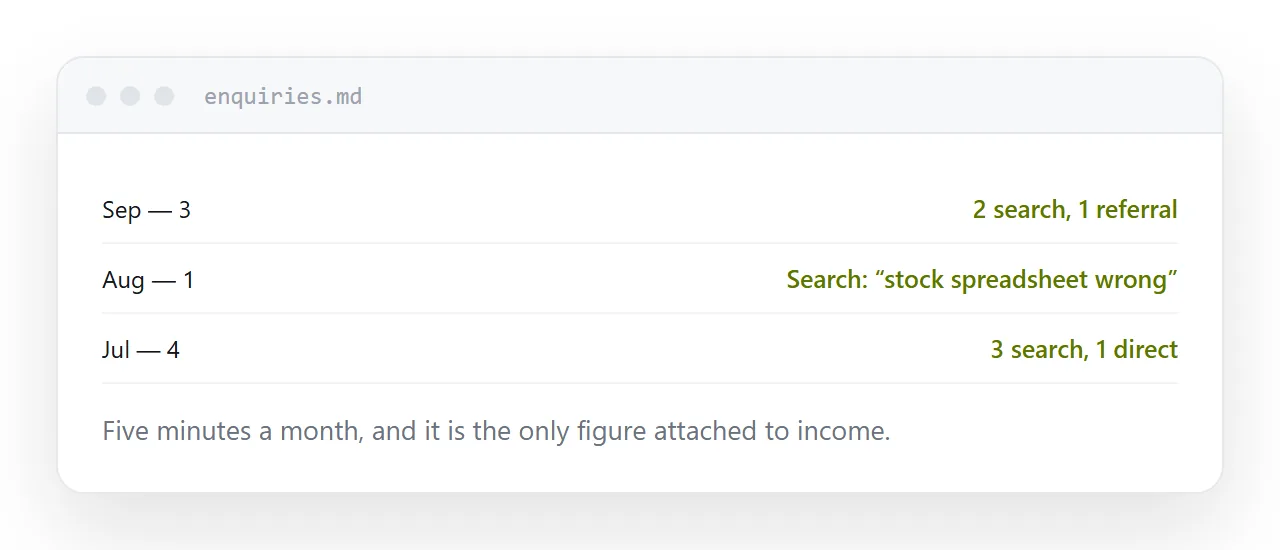
The number attached to income is enquiries, and at this volume the honest way to count them is a line in a note.
Month, how many, where each came from if you know. Five minutes.
That record tells you more over a year than any dashboard, because it is the only thing connected to whether the site is doing its job.
Read the search terms
This is where the next page comes from.
Every term bringing somebody to a page that only partly answers it is a page waiting to be written. At small scale you can read the whole list in five minutes, which is not true of a larger site.
It is also the only source that tells you what people call the thing you do.
Keep it light
A light analytics tool that collects no personal data gives you the three figures, adds almost nothing to the page, and removes the consent banner along with the obligation.
A full analytics product is built for scale you do not have, takes time to configure, slows the page, and reports mostly noise.
Closely related: What to measure on a small site, and Search basics for a static site for the adjacent problem.
Put it at an address
Count enquiries by hand each month, watch visits per page rather than site totals, read the search terms, ignore every percentage, and use a tool light enough to need no banner.