Chart tools publish in two ways and the difference is not visible on the page until something goes wrong.
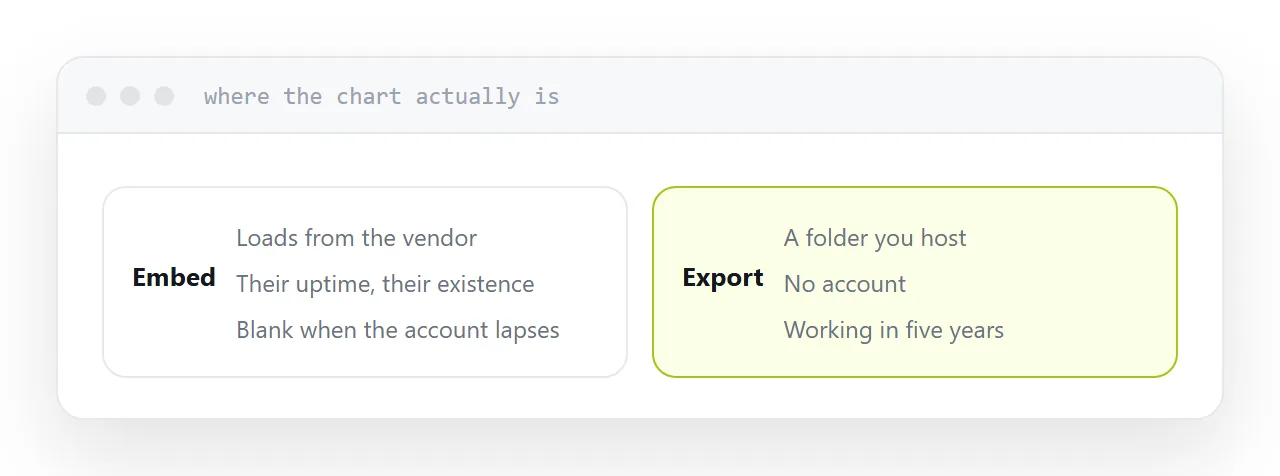
Embed
A line of markup loading the chart from the vendor's service. Simple, updates when you edit in the tool, and the chart is never actually on your site.
Every visitor's browser requests it from them. That means their uptime, their performance and their continued existence are all now part of your page.
When an account lapses or a plan changes, every page containing the chart shows an empty rectangle. Nothing alerts you, because from your machine it may still work while you are signed in.
| Embed | Export | |
|---|---|---|
| Setup | One line | Upload a folder |
| Updates with the data | Yes | No |
| Works if the account lapses | No | Yes |
| Depends on their uptime | Yes | No |
| Page speed | Their servers | Yours |
| Available on free tiers | Usually | Rarely |
Export
A folder of files containing the chart and its data, hosted wherever you like.
It is now yours. No account, no dependency, no monthly obligation, and it will still be working in five years.
The trade is that it does not update. Regenerating means exporting again, which for a chart in a published report is not a disadvantage: a chart in a March report should show March figures.
Where embedding is genuinely right
Live data.
A chart tracking something that changes, fed from a source that updates, where you want the page to follow without republishing. That is the case the embed was designed for and it works well.
Everything else, a chart in an article, a figure in a report, a comparison in a proposal, is a snapshot, and a snapshot should be a file you own.
Check export before you commit
Export is frequently a paid feature and absent from free tiers.
That is worth discovering before a report is built around a tool, because the alternative is rebuilding every chart under deadline or paying at the moment you have no choice.
Ask directly: can I export a self-contained version, and what does it cost?
Always keep an image
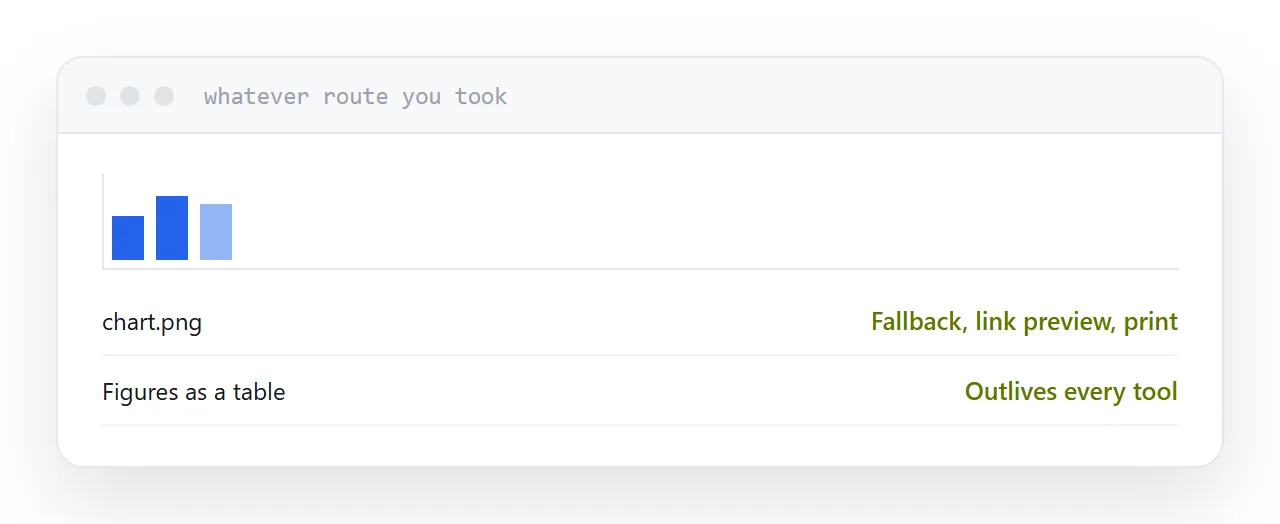
Whatever route you take, export a static image of every chart.
It is the fallback when anything fails. It is what appears in a link preview when somebody shares the page. It is what goes in a printed version. And it is what survives regardless of what happens to the tool.
Put the underlying figures on the page as a table as well. Those outlive every charting product.
Closely related: Publishing an interactive chart, and How to share an interactive chart for the adjacent problem.
Put it at an address
Check whether export exists before building on a tool, export and host the chart yourself, embed only when the data is genuinely live, keep a static image of every chart, and put the figures on the page.