Power BI shares well inside an organisation and badly outside it. Every internal route depends on the reader having a licence and being in your tenant, and a client has neither.
This guide covers why the internal routes fail, what publish-to-web actually means, and the practical alternative.
The licence is the wall
Sharing inside the product assumes the reader is a colleague. The link resolves within your tenant, the reader is authenticated, and their licence is checked.
A client fails all three tests. So does a board member on a personal email address, an investor, a partner organisation, and a contractor.
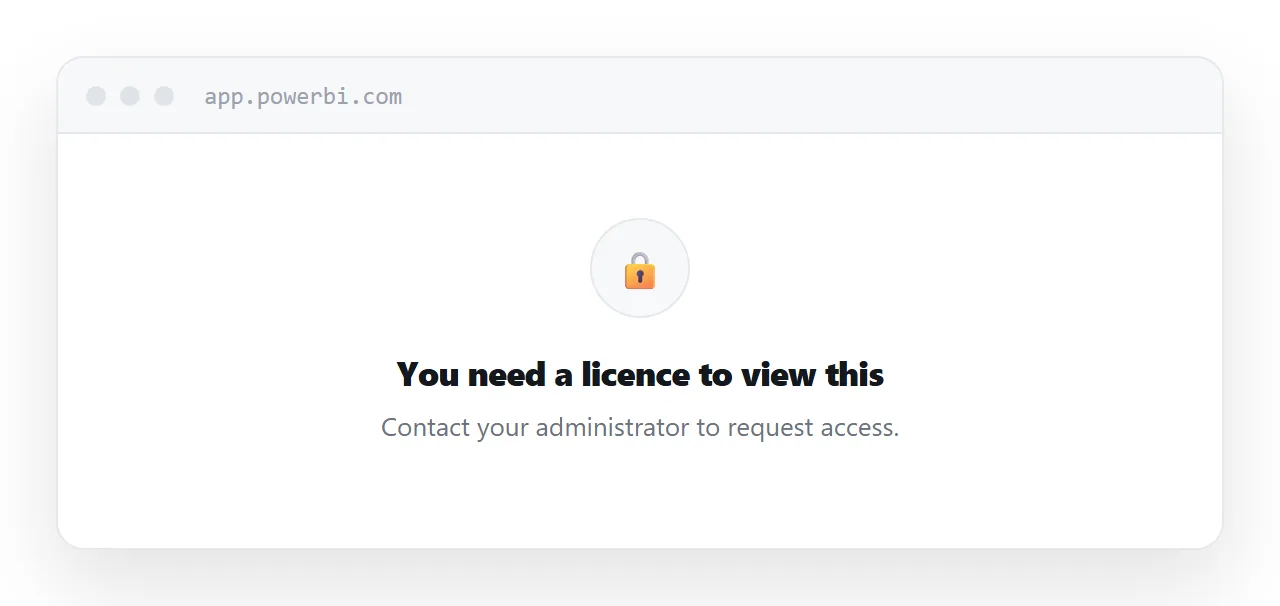
What they see is an access error with no explanation they can act on. What you get is an email saying the link does not work, usually a day later.
Guest access can be configured, and it requires administrator involvement, an invitation the reader has to accept, and often a licence assignment. For one client report that is more process than the report is worth.
Publish to web means public
There is an option that removes the wall entirely, and it is worth understanding precisely.
It makes the report readable by anyone who has the address, with no authentication of any kind. It can be indexed. It can be forwarded. There is no way to know who is reading it.
For genuinely public data, a published statistic, an open dataset, that is fine and useful.
For anything containing client names, revenue, headcount or commercial detail, it is not an option. Organisations have discovered their internal figures in search results this way.
| Internal share | Publish to web | Page at a private address | |
|---|---|---|---|
| Reader needs a licence | Yes | No | No |
| Public to anyone | No | Yes | No |
| Interactive | Yes | Yes | Depends |
| Safe for client data | Yes | No | Yes |
| Effort | Low | Low | Moderate |
The PDF fallback and what it costs
Most teams end up exporting to PDF, and it is a real loss.
Filters stop working. Tooltips are gone. Drill-through is gone. The reader gets a photograph of a dashboard, which is a strange artefact: it looks interactive and is not, and people try to click it.
It also goes stale on arrival and lives in an inbox quoting last month's figures indefinitely.
The practical alternative
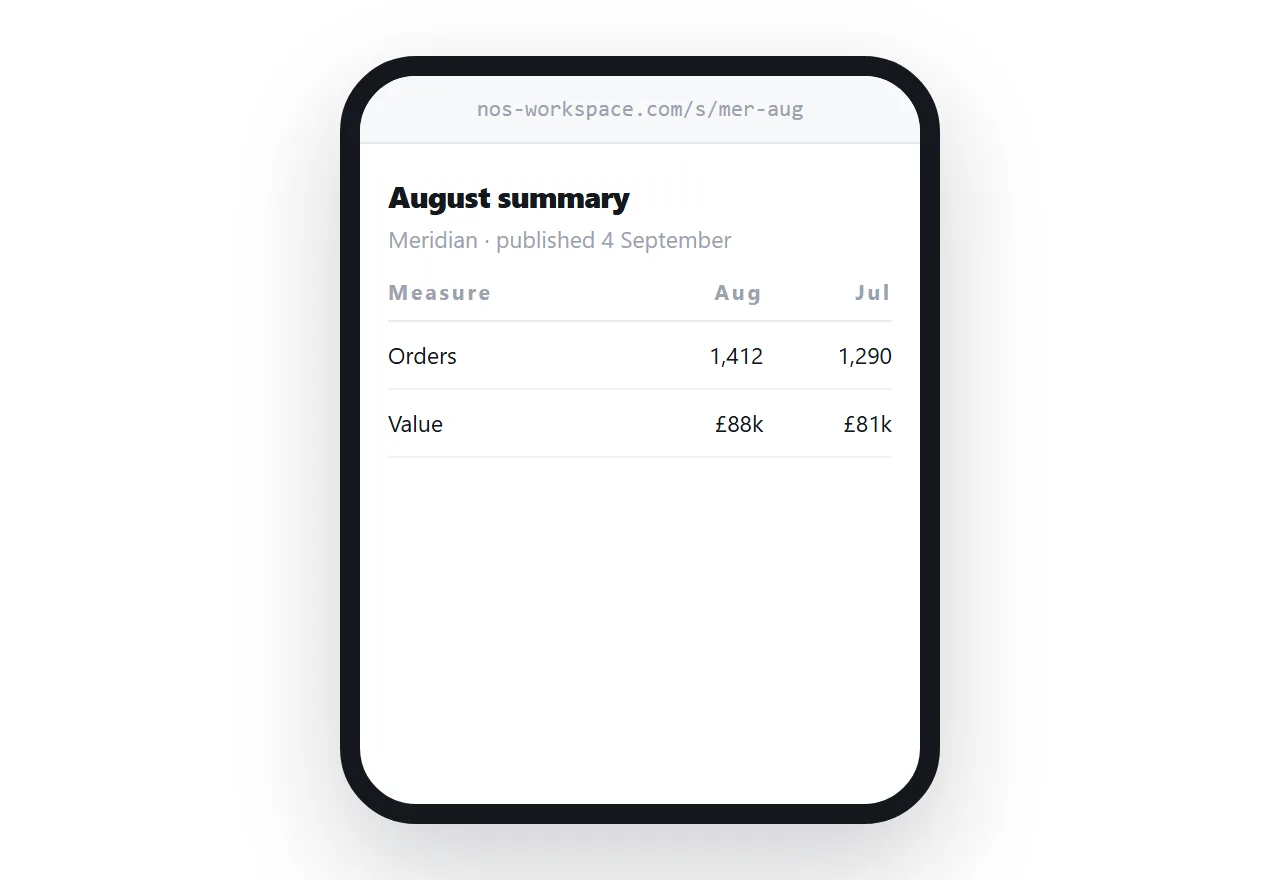
Export the figures that actually matter and publish a page at a private address.
The reader gets the numbers, in real tables they can copy, with the commentary that explains them. No licence, no tenant, no account, opens on a phone.
Each period you update the page rather than sending a new file. The client has one address for the whole engagement and it is always current.
External readers want less than you think
The instinct is to reproduce the full report so nothing is lost.
External readers almost never want it. They want the handful of figures relevant to them, a comparison against last period, and a paragraph saying what happened and why.
The full interactive report is for the analysts inside the organisation who already have access to it. Building a smaller thing for the client is not a compromise; it is the correct artefact.
If this is near what you are doing, How to share an HTML dashboard as a link and HTML client reports as pages, one address per period cover the cases on either side.
Put it at an address
Work out whether the reader is inside the tenant, avoid publish-to-web for anything commercial, export the figures that matter, publish them at a private address, and update in place.
Then the client reads the numbers without buying anything.