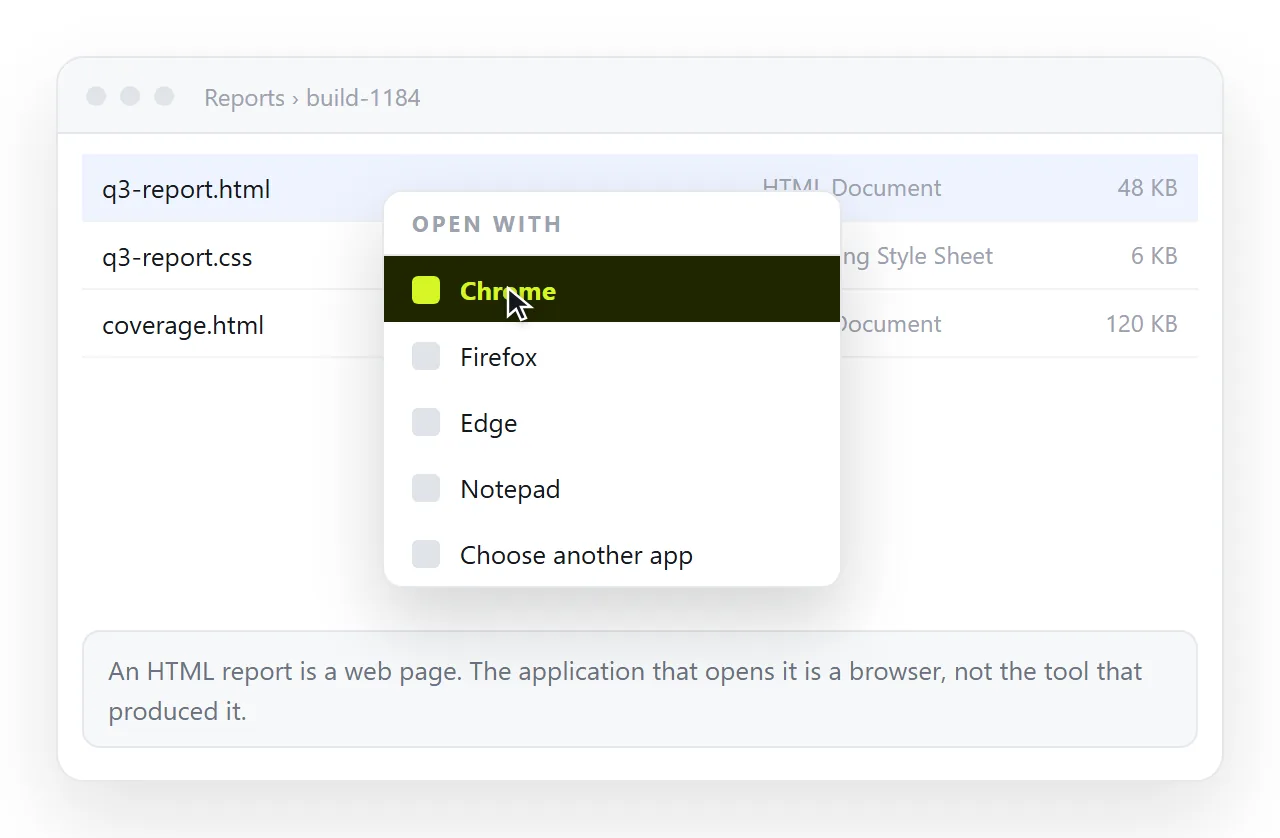
To open an HTML report, right click the file and choose Open with, then a browser. If the tool produced a folder or an archive, keep the whole thing together and open index.html from the top level.
Reports from test runners, coverage tools, security scanners, profilers and BI exports all arrive this way. They are ordinary web pages, and they fail for ordinary web page reasons.
How to open an HTML report without the wrong program
The .html extension belongs to whichever program registered it. On a developer machine that is often a code editor, so double clicking shows you the markup rather than the report.
Right clicking and picking the browser costs one extra click and removes the ambiguity. If you open reports constantly, change the default association once and be done with it.
What a report is actually made of
| Shape | How the tool ships it | Opens standalone |
|---|---|---|
| Single self-contained file | One .html, everything inline |
Yes |
| Folder with an entry point | index.html plus assets folders |
Only from inside the folder |
| Archive | A zip of the folder above | Only after extracting |
| Shell plus a data file | index.html plus data.json |
Often not, from disk |
The last row is the one that produces a blank page. The HTML is a container, and the numbers live in a separate file it fetches when it loads.
Which shape you have is visible before you open anything. One file on its own is self-contained. A file beside assets or static folders needs its neighbours. A file beside data.json fetches at load time.
File size is another tell. A self-contained report with charts is usually large, because the data and the charting library are inside it. A three kilobyte index.html is a shell that expects to load the rest.
Blank page, unstyled page, missing charts
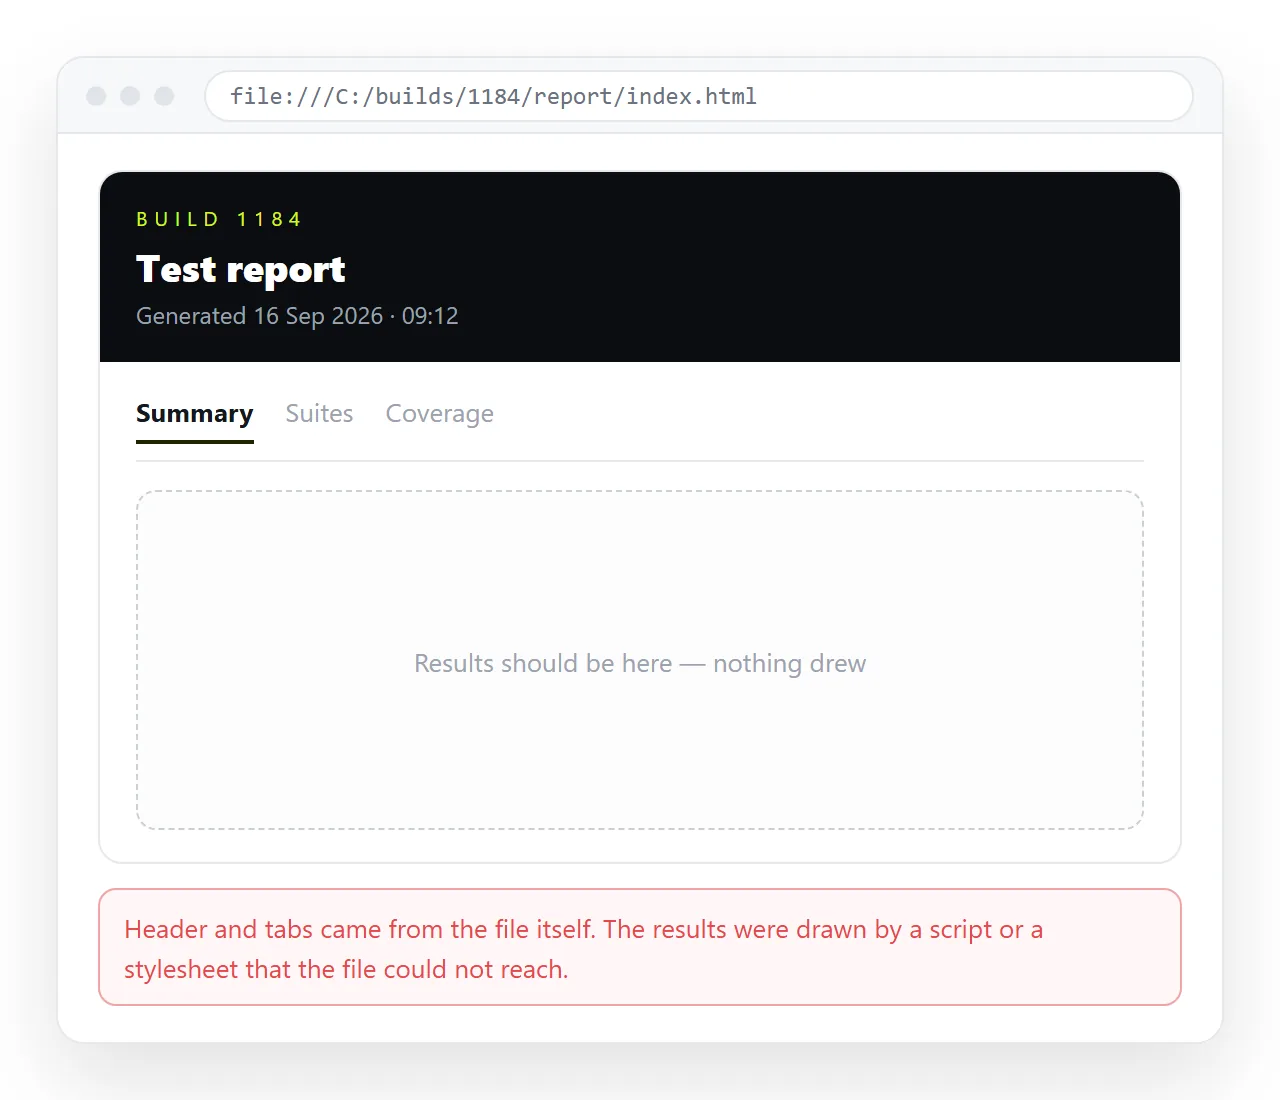
Three symptoms, three different causes. Press F12 and look at the network panel before guessing.
- Unstyled text. The stylesheet did not load. The report was opened away from its folder, or from inside a zip preview.
- Empty image boxes. Same cause, applied to images. Images not showing has the detail.
- Blank content area. The data file was not fetched. Often a browser rule, not a missing file.
- Charts missing, text present. The charting script failed to load, or failed to run.
The blank content area case deserves its own explanation. When a page is opened from disk, the browser gives it the file:// origin, and requests it makes for neighbouring files are treated as cross origin and refused.
The same report served from any address works without changes. The file protocol covers the rule and what it blocks.
Serving the report instead of opening it
If the report needs to be served, the shortest local route is a one line static server in the report folder.
python -m http.server 8000
Then open http://localhost:8000 in a browser. The report now has an origin, its fetches succeed, and the blank area fills in.
That works for you alone, on that machine, while the terminal is open. It does nothing for the colleague who asked for the results.
Passing the report on
The file is the wrong unit to hand over. HTML attachments are stripped by many mail gateways, in chat the file becomes a card nobody clicks, and on a phone it downloads and goes nowhere.
For a self-contained report, the shortest route is an address:
- Open the report and confirm it renders correctly on your machine.
- Copy the complete HTML. Ctrl+U in the browser shows the source, or open the file in an editor.
- Paste it into a NOS document. It renders as a page of its own, dark theme, charts and scripts included.
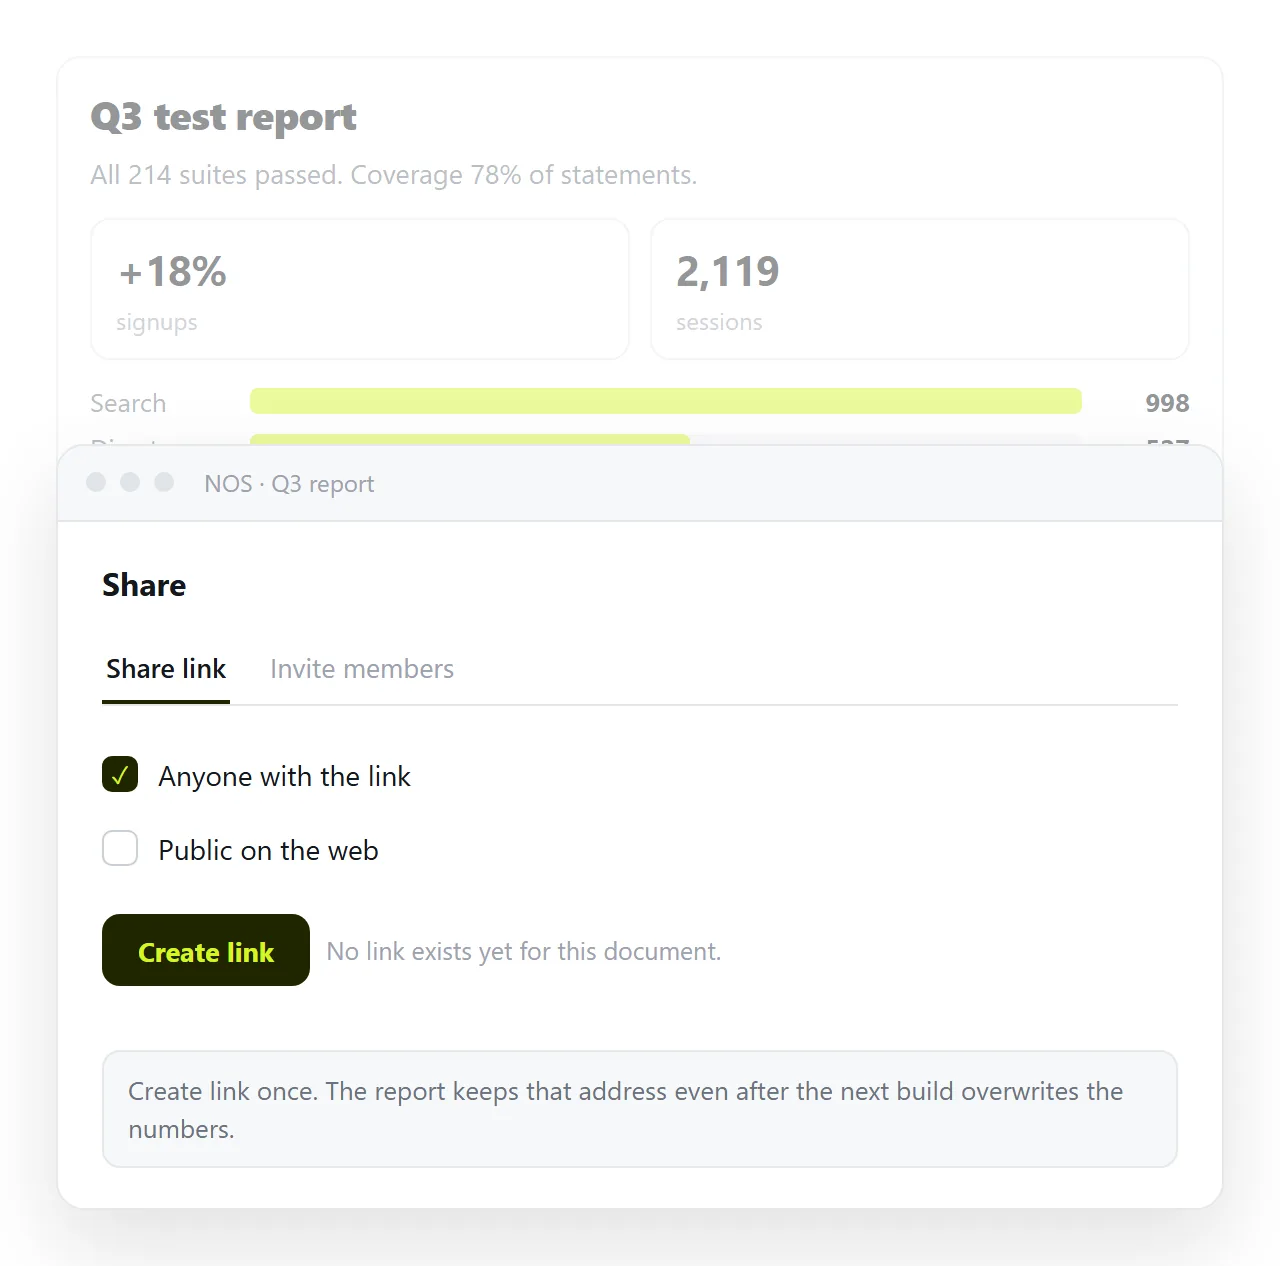
- Share, then Share link, then Create link. Unlisted by default, so only people with the link can open it.
- Send the link. The address stays the same when the next run replaces the contents.
That last point matters for reports specifically, because a report is rarely read once.
A weekly report at a fixed address is something people bookmark and return to. The same report as an attachment is five files in an inbox with no way to tell which one is current.
The free plan covers three documents, which is enough to keep one standing address per recurring report.
Turning a report into a link covers the same route for recurring reports, and why links beat attachments covers the delivery side.
Getting the numbers out
Reports are read, but the tables inside them are often wanted elsewhere.
Select the table in the browser, copy, and paste into a spreadsheet. The row and column structure survives the paste, which is faster than any import. Opening an HTML document in Excel covers the import route and its limits.
Charts do not transfer. They are drawn at load time from data held in the page, so there is no chart object to copy.
If you need the figures behind a chart, look for a data file beside the report, or an export control inside the report itself. Many generators include one.
Failing both, the data is in the page source. Open the file in an editor and search for the series label from the chart legend, and the numbers are usually a few characters away.
A short checklist
- Keep the report with its folder. Copying one file out of five is the most common cause of a broken report.
- Open with a browser, not by double clicking.
- Blank content area means serving, not a missing file.
- Send an address, not the file.
- If the report will be produced again next week, use the same address again.