An HTML canvas is blurry because its drawing buffer is smaller than the box it occupies on screen, and the browser stretches the difference.
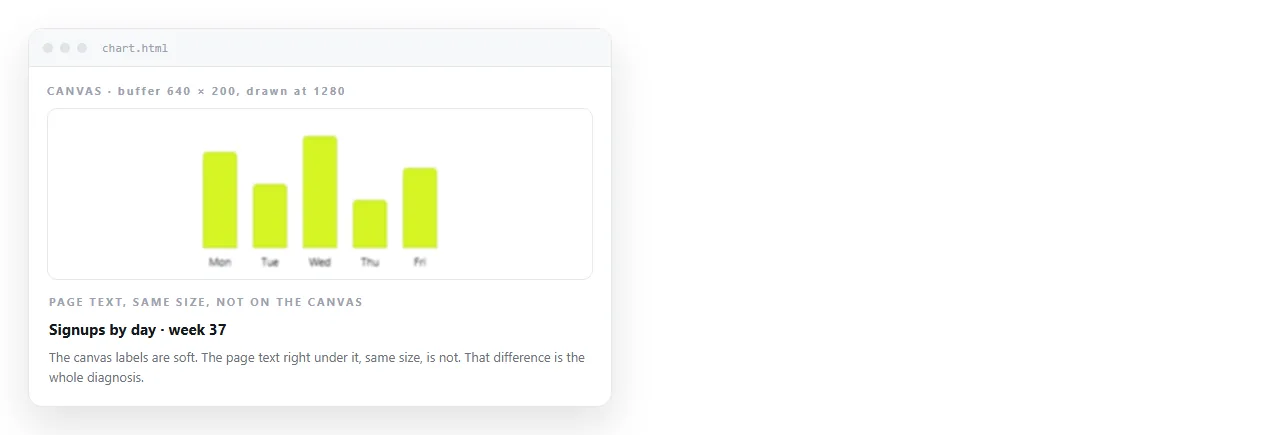
A canvas carries two independent sizes. width and height attributes define the pixel buffer you draw into. CSS width and height define how large that buffer is displayed.
Set only the CSS size and you get the default 300 by 150 buffer blown up to fill the box. That is what soft edges are.
The fix
function fitCanvas(canvas) {
  var ratio = window.devicePixelRatio || 1;
  var box = canvas.getBoundingClientRect();
  canvas.width = Math.round(box.width * ratio);
  canvas.height = Math.round(box.height * ratio);
  var ctx = canvas.getContext('2d');
  ctx.scale(ratio, ratio);
  return ctx;
}
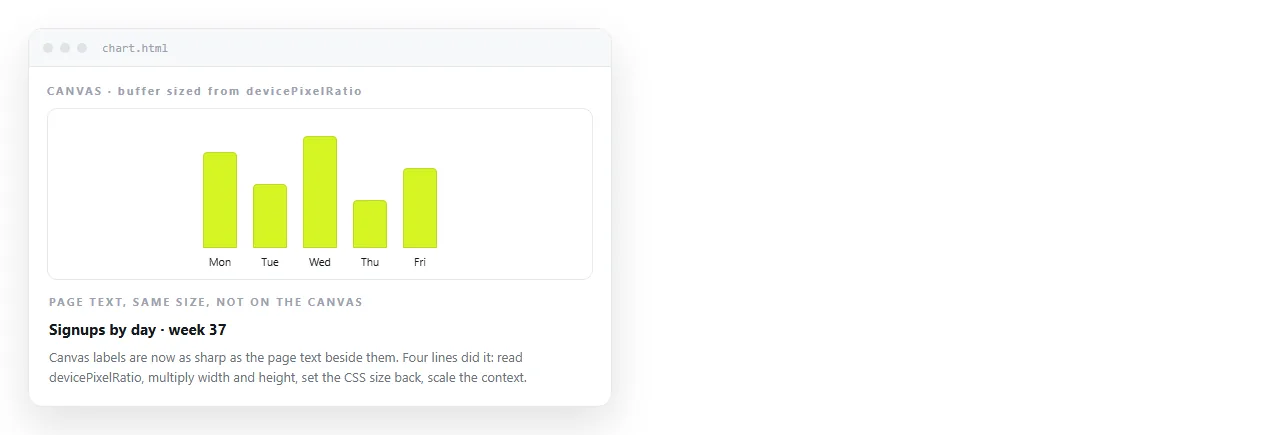
Three things are happening. The buffer is sized to the real box, multiplied by the device pixel ratio, and the context is scaled so your existing coordinates still mean CSS pixels.
That last line is what lets you keep drawing at ctx.fillRect(0, 0, 100, 40) without rewriting every number.
Why devicePixelRatio matters
On a standard display one CSS pixel is one screen pixel and the ratio is 1. On most current laptops and every phone it is 2 or 3.
So a 600 by 300 canvas on a ratio 2 screen has a quarter of the pixels the display can actually show. It is not stretched, but it is under sampled, and text in particular looks soft.
| Setup | Buffer | Displayed at | Result |
|---|---|---|---|
| No sizing at all | 300 x 150 | whatever CSS says | Badly stretched |
| CSS only | 300 x 150 | 600 x 300 | Stretched 2x |
| Attributes only, ratio 1 | 600 x 300 | 600 x 300 | Correct |
| Attributes only, ratio 2 | 600 x 300 | 600 x 300 | Soft, especially text |
| Attributes x ratio, context scaled | 1200 x 600 | 600 x 300 | Crisp |
Changing the buffer clears the canvas
Assigning to canvas.width resets the entire drawing surface, even if you assign the same number back.
So the sizing call has to come before the drawing call, and any resize handler has to redraw:
function render() {
  var ctx = fitCanvas(document.getElementById('chart'));
  drawChart(ctx);
}
render();
window.addEventListener('resize', render);
Throttle that listener if the drawing is expensive. Resize fires continuously while the reader drags a window edge.
Sizing before layout has happened
getBoundingClientRect() returns zeros if the canvas is not laid out yet, which then produces a zero sized buffer and an empty canvas.
That happens when the script runs in the <head>, or when the canvas sits inside a hidden tab.
Move the script to the end of the body or add defer. HTML JavaScript not working covers the ordering rules and how to spot them in the console.
For hidden containers, size the canvas when the container becomes visible, not on load.
Blurry lines that are not a sizing problem
Once the buffer is right, hairlines can still look grey. That is a separate effect.
Canvas coordinates address the boundaries between pixels, not their centres. A one pixel line drawn at y = 10 covers half of row 9 and half of row 10, so both get half the ink.
ctx.beginPath();
ctx.moveTo(0, 10.5);
ctx.lineTo(200, 10.5);
ctx.lineWidth = 1;
ctx.stroke();
The half pixel offset puts the line inside one row. For even line widths the offset is not needed, which is why a 2 pixel rule looks fine untouched.
Text specifically
Canvas text does not benefit from subpixel rendering the way page text does, so it is the first thing to look wrong.
Set the font after scaling the context, and use whole numbers for size. A 13.5px font on a fractional baseline is soft even on a correctly sized canvas.
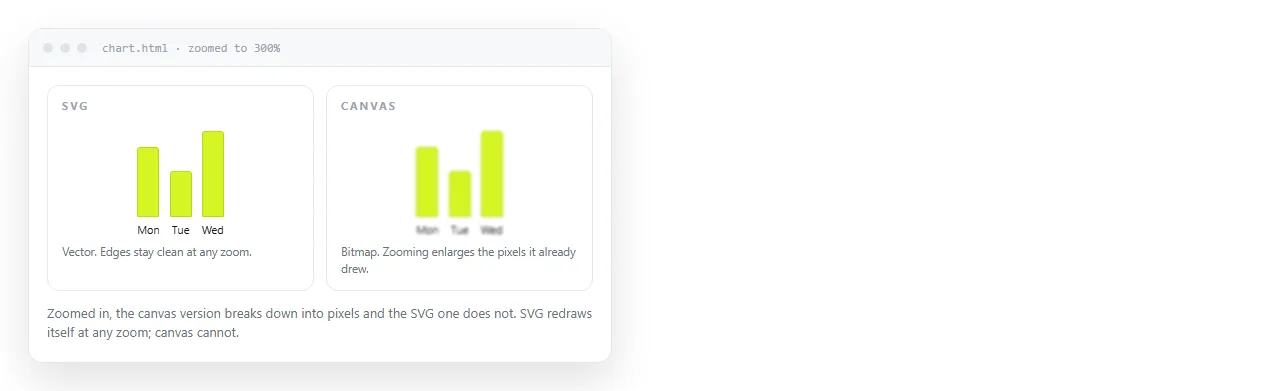
If the canvas exists only to draw a chart with labels, consider whether SVG fits better. SVG is resolution independent by nature, so there is no buffer to size and no ratio to track, and the text is real text that a reader can select.
When you export the canvas
canvas.toDataURL() exports the buffer, not the displayed size. Once you have applied the ratio, exports come out at the higher resolution automatically, which is usually what you want.
Note that drawing a local image onto a canvas and then exporting it fails over the file protocol. The canvas is marked tainted and the export throws a security error. Serving the page removes that.
If the goal is a picture of the page rather than of the canvas, HTML to image does that without touching the canvas API.
Checklist
widthandheightset as attributes, not only in CSS.- Buffer size multiplied by
devicePixelRatio. - Context scaled by the same ratio.
- Drawing happens after sizing, and again on resize.
- Hairlines offset by 0.5, or an even line width used.
- Script runs after the canvas is laid out.
Sending a page with a canvas
A canvas is drawn by script, so the page needs its script to arrive intact. A separate .js file next to the HTML will not travel with an attachment.
Paste the page into a NOS document and it renders at an address of its own with scripts running, so the chart draws for the reader exactly as it does for you. Turning HTML into a link is that step.