A Power BI portfolio is free to build and often not free to show. Power BI Desktop is a free download, but sending someone the live dashboard depends on licenses and settings you may not control.
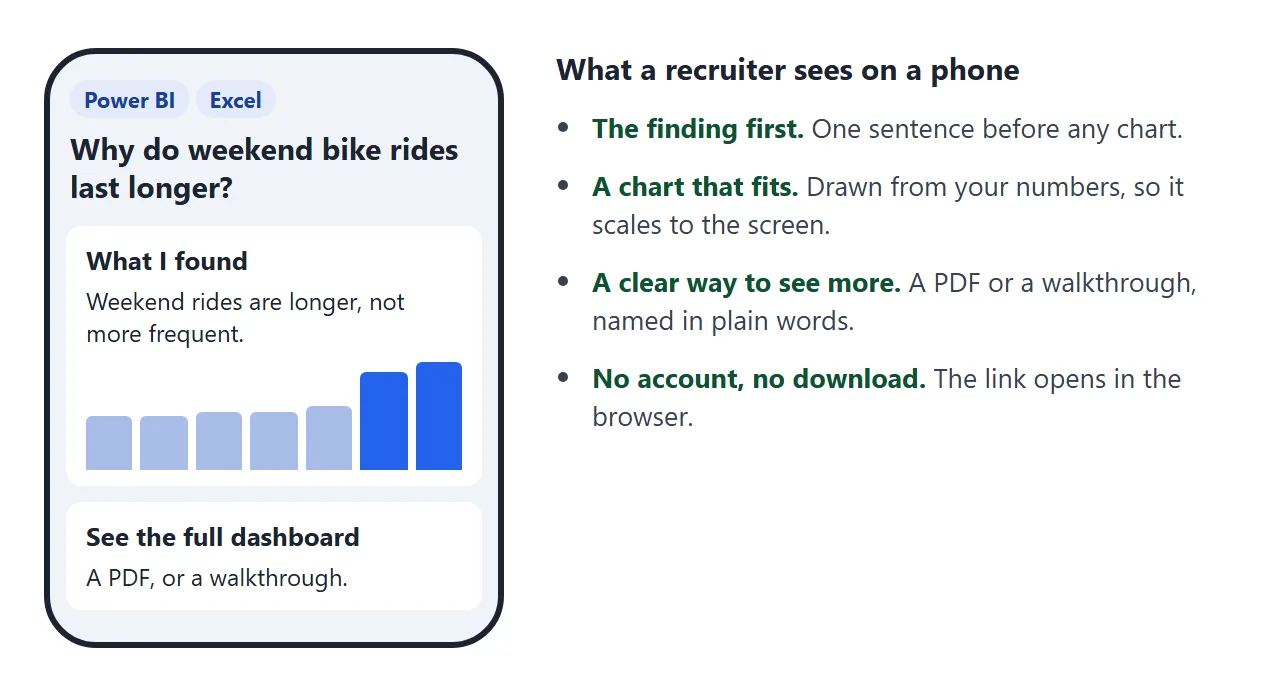
The way around it is a one-page project summary: the question, what you found, a chart redrawn from your numbers, and a plain line on how to see more. You send the link to that page.
One data portfolio guide says: "Use GitHub Pages (free), Wix, or just a simple HTML site. Doesn't need to be fancy." (The Data Hustle) It never mentions Power BI, but a simple page is what a Power BI project needs too.
Here is a summary of that kind, for a made-up student and a made-up data set. Tap the two buttons to switch the picture.
<!doctype html>
<html lang="en">
<head>
<meta charset="utf-8">
<meta name="viewport" content="width=device-width, initial-scale=1">
<title>Bike share project summary</title>
<style>
  * { box-sizing: border-box; }
  body { margin: 0; padding: 14px; font-family: system-ui, sans-serif; background: #f1f4f9; color: #1d2330; line-height: 1.5; }
  .wrap { max-width: 620px; margin: 0 auto; }
  .tag { display: inline-block; font-size: 12px; font-weight: 700; padding: 3px 9px; border-radius: 99px; background: #e3ebfb; color: #1d3f9a; margin: 0 4px 4px 0; }
  h1 { font-size: 24px; line-height: 1.25; margin: 6px 0 4px; }
  .sub { margin: 0 0 14px; font-size: 14px; color: #5b6472; }
  .card { background: #fff; border-radius: 12px; padding: 14px 16px; margin-bottom: 12px; box-shadow: 0 1px 6px rgba(0,0,0,.07); }
  h2 { font-size: 16px; margin: 0 0 6px; }
  p { margin: 0 0 8px; font-size: 15px; }
  .big { font-size: 17px; font-weight: 700; }
  .tabs { display: flex; gap: 6px; margin-bottom: 10px; flex-wrap: wrap; }
  .tabs button { font: inherit; font-size: 13px; font-weight: 700; padding: 7px 12px; border: 0; border-radius: 8px; background: #e0e6ef; color: #1d2330; cursor: pointer; }
  .tabs button[aria-pressed="true"] { background: #2563eb; color: #fff; }
  svg { width: 100%; height: auto; display: block; }
  .cap { font-size: 13px; color: #5b6472; margin: 6px 0 0; }
  ol, ul { margin: 6px 0 0; padding-left: 20px; font-size: 15px; }
  li { margin-bottom: 6px; }
  details { border-top: 1px solid #e3e7ee; padding: 10px 0 2px; margin-top: 8px; }
  summary { cursor: pointer; font-weight: 700; font-size: 15px; }
  .ways { display: grid; gap: 8px; margin-top: 8px; }
  .way { border: 1px solid #d9e0ea; border-radius: 10px; padding: 10px 12px; font-size: 14px; background: #fafbfd; }
  .way b { display: block; font-size: 14px; margin-bottom: 2px; }
  .note { font-size: 13px; color: #5b6472; }
</style>
</head>
<body>
<div class="wrap">
  <span class="tag">Power BI</span><span class="tag">Excel</span><span class="tag">Student project</span>
  <h1>Why do weekend bike rides last longer?</h1>
  <p class="sub">Made-up data set, 12 months of rides for a fictional city bike share. By Dana Whitfield (fictional).</p>

  <div class="card">
    <h2>The question</h2>
    <p>The bike share wants to know whether to add more bikes at weekends. Is it more riders, or longer rides?</p>
    <h2>What I found</h2>
    <p class="big" id="headline"></p>
    <ol id="findings"></ol>
  </div>

  <div class="card">
    <h2>The dashboard, in two pictures</h2>
    <div class="tabs" id="tabs"></div>
    <div id="chart"></div>
    <p class="cap" id="cap"></p>
    <p class="note">These charts are redrawn from the dashboard numbers. The live dashboard is not on this page.</p>
  </div>

  <div class="card">
    <h2>What I did</h2>
    <ul>
      <li>Cleaned 12 monthly files in Power Query and removed rides under one minute.</li>
      <li>Built a date table and measures for average ride length and rides per day.</li>
      <li>Made a two-page report with a weekday filter and a station map.</li>
    </ul>
    <details>
      <summary>One measure I wrote</summary>
      <p class="note">Average ride minutes = AVERAGE(Rides[Minutes]). I checked it against a pivot table in Excel and the two matched.</p>
    </details>
    <details>
      <summary>What I would do next</summary>
      <p class="note">Split members from casual riders. The weekend jump may come from one group.</p>
    </details>
  </div>

  <div class="card">
    <h2>See the full dashboard</h2>
    <div class="ways">
      <div class="way"><b>A PDF of both pages</b>I can send it in reply to an email.</div>
      <div class="way"><b>A walkthrough</b>I can share my screen and click through it in an interview.</div>
      <div class="way"><b>Live link</b>Not available for this project.</div>
    </div>
  </div>
</div>

<script>
  // Edit these lists to change the page.
  const HEADLINE = 'Weekend rides are longer, not more frequent.';
  const FINDINGS = [
    'Average ride length is 19 to 20 minutes on Saturday and Sunday, against 11 to 13 on weekdays.',
    'Rides per day rise by about 8 percent at weekends, a much smaller change than length.',
    'Three stations near the park account for the longest rides.'
  ];
  const PAGES = [
    { tab: 'Page 1: Ride length', cap: 'Average ride length in minutes, by weekday.',
      labels: ['Mon', 'Tue', 'Wed', 'Thu', 'Fri', 'Sat', 'Sun'], values: [11, 11, 12, 12, 13, 19, 20], hi: [5, 6] },
    { tab: 'Page 2: Stations', cap: 'Average ride length in minutes, top five start stations.',
      labels: ['Park N', 'Park S', 'Lake', 'Station', 'Library'], values: [24, 22, 21, 14, 12], hi: [0, 1, 2] }
  ];

  document.getElementById('headline').textContent = HEADLINE;
  const list = document.getElementById('findings');
  FINDINGS.forEach((t) => { const li = document.createElement('li'); li.textContent = t; list.appendChild(li); });

  const NS = 'http://www.w3.org/2000/svg';
  function el(name, attrs, text) {
    const n = document.createElementNS(NS, name);
    Object.keys(attrs).forEach((k) => n.setAttribute(k, attrs[k]));
    if (text !== undefined) n.textContent = text;
    return n;
  }
  function draw(i) {
    const p = PAGES[i], W = 560, H = 270, pad = 20, base = H - 36;
    const max = Math.max.apply(null, p.values) * 1.15;
    const slot = (W - pad * 2) / p.values.length;
    const svg = el('svg', { viewBox: '0 0 ' + W + ' ' + H, role: 'img', 'aria-label': p.cap });
    svg.appendChild(el('line', { x1: pad, y1: base, x2: W - pad, y2: base, stroke: '#c5cdd9' }));
    p.values.forEach((v, k) => {
      const h = (v / max) * (base - 20), x = pad + k * slot + slot * 0.18, w = slot * 0.64;
      svg.appendChild(el('rect', { x: x, y: base - h, width: w, height: h, rx: 4, fill: p.hi.indexOf(k) >= 0 ? '#2563eb' : '#a9bde8' }));
      svg.appendChild(el('text', { x: x + w / 2, y: base - h - 6, 'text-anchor': 'middle', 'font-size': 20, 'font-weight': 700, fill: '#1d2330' }, String(v)));
      svg.appendChild(el('text', { x: x + w / 2, y: base + 24, 'text-anchor': 'middle', 'font-size': 18, fill: '#5b6472' }, p.labels[k]));
    });
    const box = document.getElementById('chart');
    box.replaceChildren(svg);
    document.getElementById('cap').textContent = p.cap;
    document.querySelectorAll('#tabs button').forEach((b, k) => b.setAttribute('aria-pressed', String(k === i)));
  }
  PAGES.forEach((p, i) => {
    const b = document.createElement('button');
    b.type = 'button'; b.textContent = p.tab;
    b.addEventListener('click', () => draw(i));
    document.getElementById('tabs').appendChild(b);
  });
  draw(0);
</script>
</body>
</html>
The two charts are not screenshots. They are drawn from a short list of numbers in the code, so they stay sharp on a phone, and a fix to a number is one edit.
Why a live dashboard is hard to share for free
Microsoft's own documentation, as of October 2026, gives four reasons a Power BI file does not simply travel.
- The file needs Desktop. A
.pbixfile opens in Power BI Desktop, which Microsoft describes as a Windows app. - A Free license does not share. Free users can create reports and dashboards for their own use, but cannot use the sharing features with others.
- Sign-up wants a work or school email. Microsoft says consumer addresses such as Gmail or Hotmail cannot be used directly, and your school or employer must allow self-service sign-up.
- Publish to web is public and gated. It needs a license, and your Power BI admin must enable it.
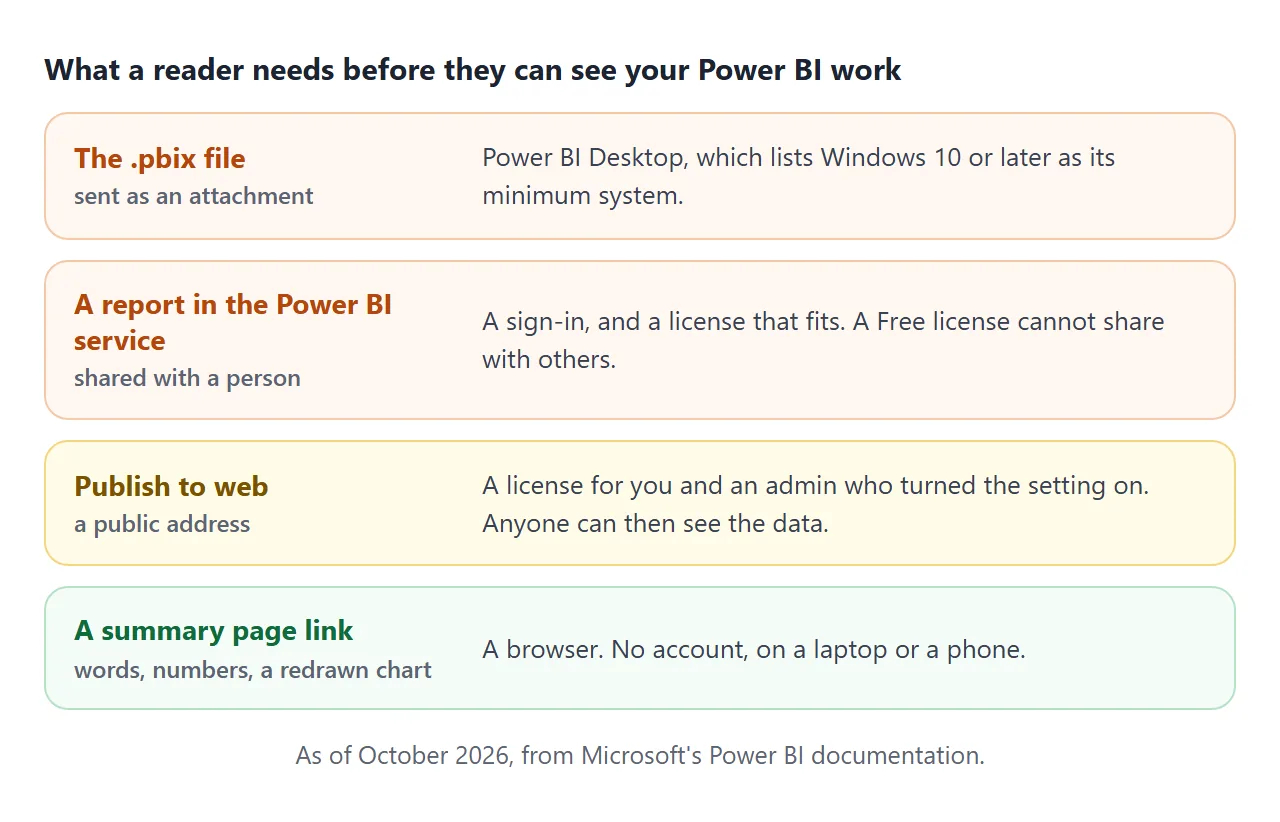
Publish to web has a bigger catch. Microsoft's warning says anyone on the internet can view the report with no sign-in, including the detail-level data behind it. Do not publish confidential or proprietary data.
The same page says the person who made the embed code must keep access to the report for it to keep working. If that account is a school account, ask your school what happens to it when you finish.
If you do have Publish to web and the data is yours to show, use it. Still keep the summary page beside it, because an open report does not tell a reader what to look at.
What goes on the summary page
Keep the page short. It should say what the project found before it shows how it was built.
- The question. One sentence about who needed an answer.
- The finding. One sentence, with a number in it.
- A chart. The one chart that shows the finding, redrawn from your numbers.
- What you did. Three lines: cleaning, measures, the report you built. Name the tools.
- How to see more. A PDF, a walkthrough, or a public address if you have one.
Use data you may show. A made-up or public data set is the safest. Anyone who has the link can open the page, and it has no password.
Make it with AI
Open the AI chat you already use, such as ChatGPT, Claude or Gemini. Paste the prompt below, then your own notes under it.
Make a single-file HTML page that summarises one data project.
Use only the facts and numbers I give below. Do not invent
numbers, tools or results. Sections in this order: tools as
small tags; the question; the finding in one bold sentence;
one bar chart drawn as SVG from the numbers I list; what I did
in three bullets; "See the full dashboard" with the options I
list. Put the chart numbers in one JavaScript list near the
bottom. One column, 16px text or larger, works on a phone.
No outside images, fonts or libraries. Return only the HTML.

My notes:
[question, findings, chart numbers, tools, how a reader can see more]
Then check the result before you copy it:
- Every number and label. Put the page beside your dashboard and compare figure by figure. An AI can round, swap or mislabel a value without telling you.
- The chart. The bars must match the dashboard in order and size.
- Phone width. Make the browser window narrow. The chart and text should still fit.
- Nothing invented. Delete any tool, result or claim you did not give it.
If something is off, say so in the same chat and paste the new version.
Send it as a link
- Copy all of the code the AI returned.
- Paste it into a NOS document. The page renders and its scripts run, so tap the buttons yourself.
- Choose Create share link and copy the address. HTML to link walks through it.
- Put that address where a reader looks.
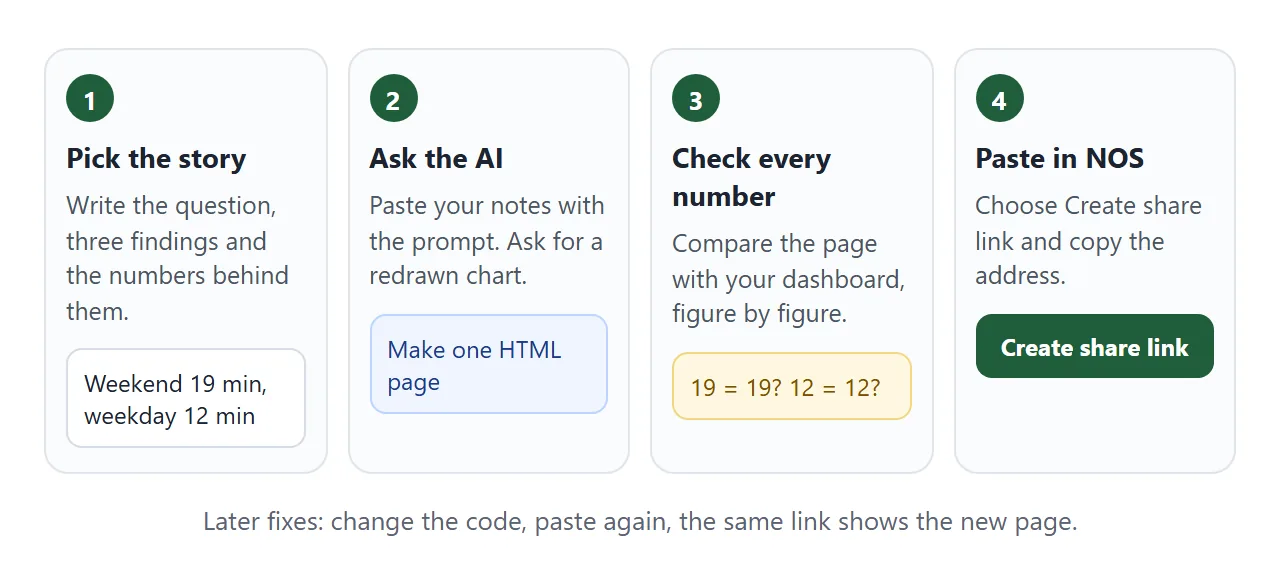
Anyone with the link can open the page in a browser, on a phone or a laptop, without an account. They cannot edit it. If you fix a number later, the same link shows the new version.
Put the address in the website field of an application form, at the top of your resume, or in a printed code on a poster. Linking a portfolio in a resume and QR code link cover those.
If a phone shows code instead of a page, see opening an HTML file on a phone.
Ways to show Power BI work compared
Each route shows something different, and each asks something different of you and of the reader.
| Way | What the reader needs | What you need | What they see |
|---|---|---|---|
Send the .pbix file |
Power BI Desktop | Nothing extra | The report file |
| Share in the Power BI service | A sign-in and a fitting license | A license that can share | The live report |
| Publish to web | A browser | A license, and an admin who enabled it | The live report, public, with its data |
| PDF export | A PDF viewer | Desktop, then File, Export, Export to PDF | Each visible page as a PDF page |
| Summary page link | A browser | A NOS document and a share link | Your words, numbers and a redrawn chart |
A PDF is a good second item on the summary page. Microsoft's PDF page lists visuals that do not export, such as uncertified custom visuals.
It also says a visual you scrolled or drilled into exports in its default state. Open the PDF before you send it.
Exporting Power BI to PDF goes through what the export loses. Sharing Power BI reports with people who have no license covers the other routes.
One page per project, one page for all
A portfolio often has more than one project. As of October 2026, NOS's pricing page lists 3 live share links on the Free plan, and published pages on Free carry a NOS badge. Check the page for what applies when you read this.
So you can give each project its own page, or put every project on one index page and use one link. The demo below keeps each summary inside the index, and the tool buttons filter the list.
<!doctype html>
<html lang="en">
<head>
<meta charset="utf-8">
<meta name="viewport" content="width=device-width, initial-scale=1">
<title>Data projects, by Dana Whitfield</title>
<style>
  * { box-sizing: border-box; }
  body { margin: 0; padding: 14px; font-family: system-ui, sans-serif; background: #f1f4f9; color: #1d2330; line-height: 1.5; }
  .wrap { max-width: 620px; margin: 0 auto; }
  h1 { font-size: 24px; margin: 0 0 2px; }
  .sub { margin: 0 0 12px; font-size: 14px; color: #5b6472; }
  .filters { display: flex; gap: 6px; flex-wrap: wrap; margin-bottom: 12px; }
  .filters button { font: inherit; font-size: 13px; font-weight: 700; padding: 7px 12px; border: 0; border-radius: 8px; background: #e0e6ef; color: #1d2330; cursor: pointer; }
  .filters button[aria-pressed="true"] { background: #2563eb; color: #fff; }
  .proj { background: #fff; border-radius: 12px; padding: 14px 16px; margin-bottom: 10px; box-shadow: 0 1px 6px rgba(0,0,0,.07); }
  .proj h2 { font-size: 17px; margin: 0 0 4px; }
  .proj p { margin: 0 0 8px; font-size: 15px; }
  .tag { display: inline-block; font-size: 12px; font-weight: 700; padding: 3px 9px; border-radius: 99px; background: #e3ebfb; color: #1d3f9a; margin: 0 4px 4px 0; }
  .more { font: inherit; font-size: 14px; font-weight: 700; padding: 0; border: 0; background: none; color: #2563eb; cursor: pointer; }
  .detail { margin-top: 8px; padding-top: 8px; border-top: 1px solid #e3e7ee; font-size: 14px; }
  .detail dt { font-weight: 700; }
  .detail dd { margin: 0 0 6px; }
  .empty { font-size: 14px; color: #5b6472; }
</style>
</head>
<body>
<div class="wrap">
  <h1>Data projects</h1>
  <p class="sub">Dana Whitfield (fictional), studying business analytics. Each project has a one-page summary.</p>
  <div class="filters" id="filters"></div>
  <div id="list"></div>
</div>

<script>
  // Edit this list to change the page. One entry per project.
  const PROJECTS = [
    { title: 'Bike share: longer weekend rides', tools: ['Power BI', 'Excel'],
      line: 'Weekend rides last about 8 minutes longer than weekday rides.',
      question: 'Do weekends need more bikes, or different stations?',
      next: 'Split members from casual riders.' },
    { title: 'Campus cafe: which items sell together', tools: ['SQL', 'Excel'],
      line: 'Coffee and a pastry are bought together far more often than coffee and a sandwich.',
      question: 'Which two items should share a combo price?',
      next: 'Test the combo for one week.' },
    { title: 'Library loans by month', tools: ['Power BI'],
      line: 'Loans peak in the two weeks before exams and fall in the break.',
      question: 'When should the library extend its opening hours?',
      next: 'Add loans by faculty.' }
  ];
  const TOOLS = ['All'].concat(Array.from(new Set(PROJECTS.flatMap((p) => p.tools))));
  let current = 'All';

  const filters = document.getElementById('filters');
  const list = document.getElementById('list');

  function add(parent, tag, cls, text) {
    const n = document.createElement(tag);
    if (cls) n.className = cls;
    if (text) n.textContent = text;
    parent.appendChild(n);
    return n;
  }

  function render() {
    list.replaceChildren();
    filters.querySelectorAll('button').forEach((b) => b.setAttribute('aria-pressed', String(b.textContent === current)));
    const shown = PROJECTS.filter((p) => current === 'All' || p.tools.indexOf(current) >= 0);
    if (!shown.length) add(list, 'p', 'empty', 'No projects with this tool yet.');
    shown.forEach((p) => {
      const card = add(list, 'div', 'proj');
      add(card, 'h2', '', p.title);
      p.tools.forEach((t) => add(card, 'span', 'tag', t));
      add(card, 'p', '', p.line);
      const btn = add(card, 'button', 'more', 'Read the summary');
      btn.type = 'button';
      btn.setAttribute('aria-expanded', 'false');
      const d = add(card, 'dl', 'detail');
      d.hidden = true;
      add(d, 'dt', '', 'Question'); add(d, 'dd', '', p.question);
      add(d, 'dt', '', 'Next step'); add(d, 'dd', '', p.next);
      btn.addEventListener('click', () => {
        d.hidden = !d.hidden;
        btn.setAttribute('aria-expanded', String(!d.hidden));
        btn.textContent = d.hidden ? 'Read the summary' : 'Hide the summary';
      });
    });
  }

  TOOLS.forEach((t) => {
    const b = add(filters, 'button', '', t);
    b.type = 'button';
    b.addEventListener('click', () => { current = t; render(); });
  });
  render();
</script>
</body>
</html>
Ask the AI for this one by changing the prompt: "an index of my projects, one card each, with tool filters and a Read the summary button that opens the question and next step."
When it does not work
| Symptom | Cause | Fix |
|---|---|---|
| Publish to web is missing or greyed out | Your admin has not enabled it, or has blocked public access | Ask your admin, or rely on the summary page |
| Power BI will not accept your Gmail address | Consumer addresses cannot be used directly | Use a work or school account, or skip the live dashboard |
| The chart shows a different number | The AI rounded or copied a value wrongly | Compare with the dashboard, fix the list, paste again |
| A picture of your dashboard is missing | Pictures hosted elsewhere are blocked | Ask for a chart drawn in the page itself |
| A visual is an error box in the PDF | Some visuals do not export | Check Microsoft's list, change the visual, or redraw it |
| The public Power BI address stopped working | The embed code was deleted, or its creator lost access | Check Manage embed codes in Settings |
| A phone shows code, not a page | The file was sent as an attachment | Send the link, not the file |
If the page works and you want more to put on it, student portfolio covers what to show when you have no clients yet.