An annual report published as pages opens in a tap, lets a reader reach one section directly, and reports back on which sections anyone cared about.
The statutory document still exists. It stops being the only way in.
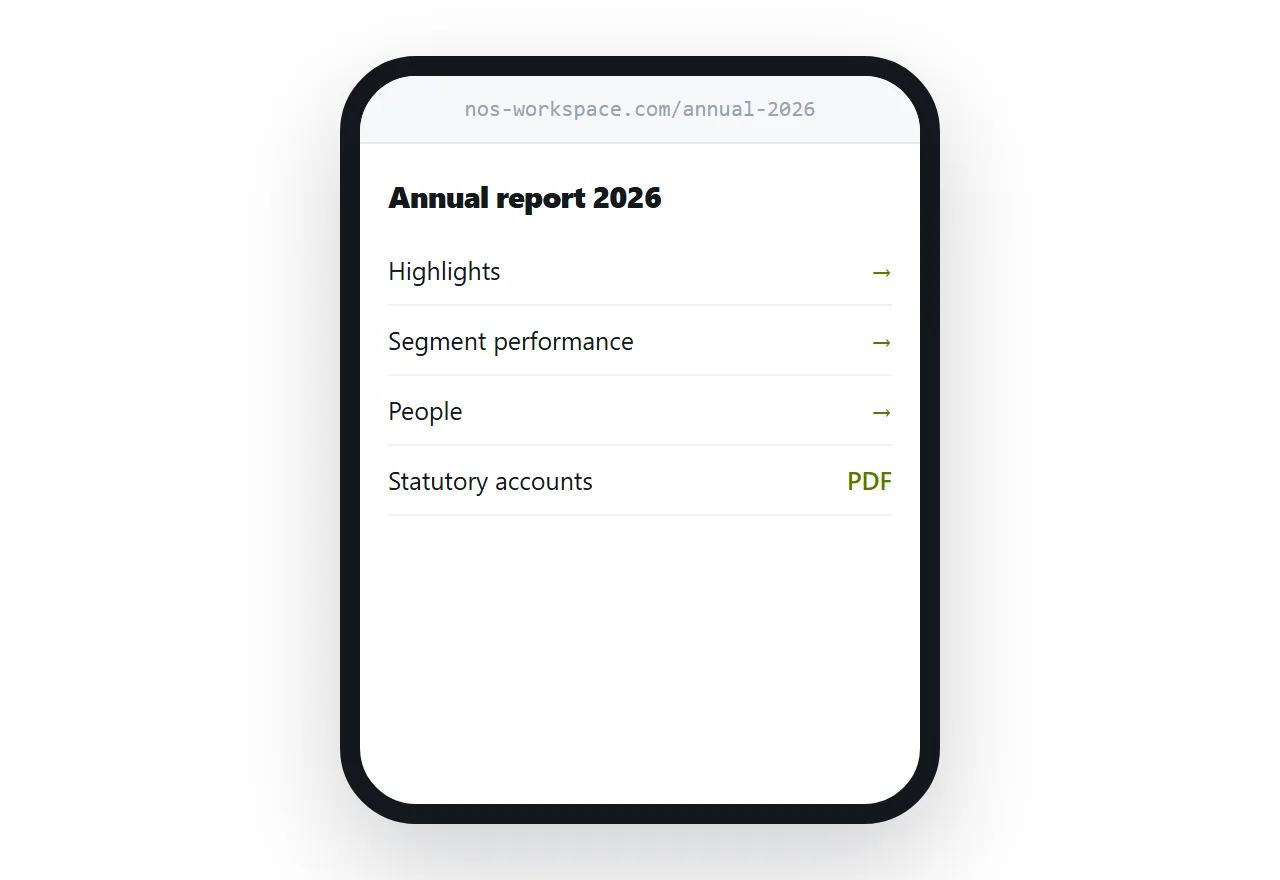
This guide covers splitting it up, presenting figures properly, and what to keep as a document.
Nobody reads it cover to cover
The honest picture of how an annual report is read: a journalist wants one figure, an analyst wants the segment breakdown, an employee wants the section mentioning their division, a potential hire wants to know what the company says about itself.
Four readers, four destinations, none of them the front cover.
A single downloaded document serves all of them badly. Each one downloads forty megabytes, waits, then scrolls looking for the part they came for.
Sections at their own addresses serve all of them well. Each arrives at what they wanted, and the contents page carries the whole.
Figures belong in tables, not in pictures
This is the change that gets the most quiet appreciation.
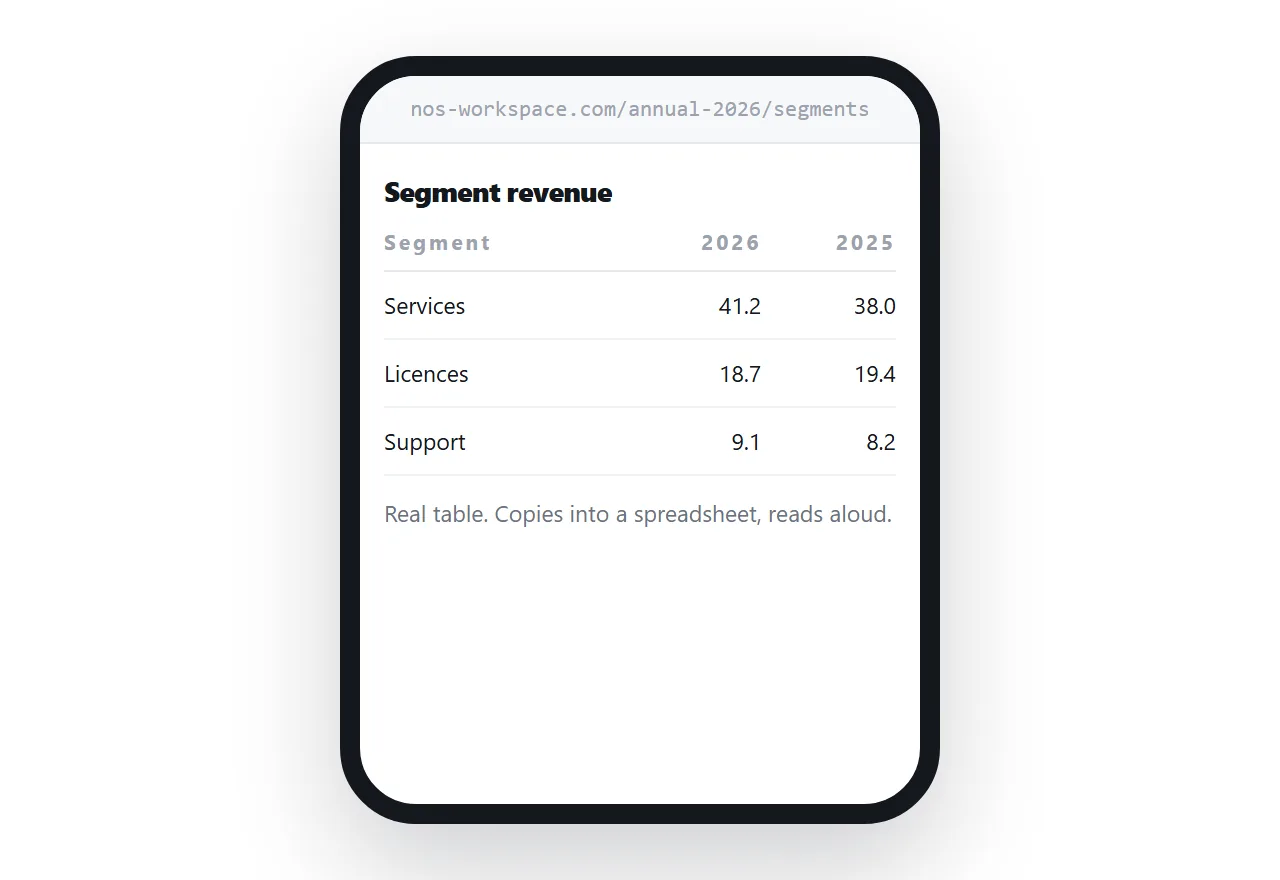
Financial figures exported as images cannot be copied, cannot be searched, cannot be read by a screen reader, and shrink into illegibility on a phone. Analysts retype them, and retyping produces errors that get attributed to you.
A real table copies cleanly into a spreadsheet, is searchable, reads properly aloud, and can be made to scroll sideways on a narrow screen while keeping the row labels in place.
| Figures as an image | Figures as a table | |
|---|---|---|
| Copy into a spreadsheet | Retyped by hand | Direct |
| Searchable | No | Yes |
| Screen reader | Silent | Reads the figures |
| On a phone | Scaled to nothing | Scrolls sideways |
Put the highlights where they are found
The summary is the most-read part and it is usually behind a cover, a chairman's letter and a contents page.
On the web there is no reason for that order. Put the highlights at the top of the entry page, with the numbers that matter visible without scrolling, and link everything else from there.
The readers who want the full narrative will find it. The four readers above get what they came for in ten seconds.
Keep the document as well
None of this is an argument for abandoning the document.
It is needed for filing, for archives, for regulators, and for the people who genuinely print it and mark it up. Publish it at a permanent address alongside the pages and link to it clearly.
The rule is both, with the pages as the way in and the document as the record.
What the address tells you
A downloaded file reports a download. That is the end of the information.
Sections at addresses report which sections were opened, how far people read, and what they went to next. Most organisations find their report is read far more unevenly than they assumed, with two or three sections carrying almost all the attention.
That is the most useful thing the format gives you, because it changes what gets written the following year.
If this is near what you are doing, How to open an HTML report and HTML client reports as pages, one address per period cover the cases on either side. How to host release notes is also close.
Put it at an address
Split it into sections, lead with the highlights, use real tables for the figures, keep the statutory document at a permanent address, and read the numbers on what was read.
Then the report answers the question the reader actually arrived with.