To measure HTML performance on a single page, you do not need an outside service. The browser has a clock built in: performance.now() times any piece of code, performance.mark() and performance.measure() store named timings, and a few more lines catch freezes and oversized images.
Try it first. Press the button, then tick Include layout and press it again.
<!doctype html>
<html lang="en">
<head>
<meta charset="utf-8">
<meta name="viewport" content="width=device-width, initial-scale=1">
<title>Time a piece of code</title>
<style>
  body { margin: 0; padding: 14px; font-family: system-ui, sans-serif; background: #f4f5f7; color: #1d2330; }
  .bar { display: flex; flex-wrap: wrap; gap: 8px; align-items: center; }
  button { font: inherit; padding: 8px 14px; border: 0; border-radius: 8px; background: #2563eb; color: #fff; cursor: pointer; }
  label { font-size: 14px; }
  #out { margin: 12px 0 6px; font: 600 15px ui-monospace, Consolas, monospace; }
  #log { margin: 0; padding-left: 20px; font: 13px ui-monospace, Consolas, monospace; color: #4b5563; min-height: 90px; }
  #list { height: 90px; overflow: auto; margin: 10px 0 0; padding: 6px 6px 6px 28px; background: #fff; border-radius: 8px; font-size: 13px; }
</style>
</head>
<body>
<div class="bar">
  <button id="run">Build 3,000 rows</button>
  <label><input type="checkbox" id="layout"> Include layout</label>
</div>
<div id="out">Press the button.</div>
<ol id="log"></ol>
<ol id="list"></ol>

<script>
  const list = document.getElementById('list');
  const out = document.getElementById('out');
  const log = document.getElementById('log');

  document.getElementById('run').addEventListener('click', () => {
    const t0 = performance.now();          // a start time in milliseconds
    performance.mark('build-start');       // the same moment, as a named mark

    list.textContent = '';
    for (let i = 1; i <= 3000; i++) {
      const li = document.createElement('li');
      li.textContent = 'Row ' + i;
      list.append(li);
    }
    // Reading a size makes the browser do layout now, inside the timing
    const layout = document.getElementById('layout').checked;
    if (layout) list.offsetHeight;

    performance.mark('build-end');
    const m = performance.measure('build', {
      start: 'build-start', end: 'build-end', detail: { layout }
    });
    const t1 = performance.now();

    out.textContent = 'now(): ' + (t1 - t0).toFixed(1) + ' ms   measure: ' + m.duration.toFixed(1) + ' ms';

    // Every measure named "build" is kept in the timeline; show the last four
    log.innerHTML = performance.getEntriesByName('build').slice(-4)
      .map(e => '<li>' + e.duration.toFixed(1) + ' ms' + (e.detail.layout ? ' with layout' : '') + '</li>')
      .join('');
  });
</script>
</body>
</html>
Both numbers on the first line come from the same clock. The list underneath is read back from the browser's own record of every measure named build.
performance.now(): a stopwatch for code
performance.now() returns the number of milliseconds since the page started, with a fractional part. Take one reading before the work and one after, and subtract:
const t0 = performance.now();
doTheWork();
console.log(performance.now() - t0, 'ms');
Unlike Date.now(), it never goes backwards when the computer clock changes. Browsers do round it, to make timing attacks harder. In our test on a plain page, Chromium moved in 0.1 ms steps, and Firefox and WebKit in 1 ms steps.
So a 0.3 ms function can read as 0 or 1. Time a bigger batch of work, or run it in a loop a thousand times and divide.
Marks and measures: timings with names
A mark is a named moment. A measure is the time between two marks. The browser keeps both in a timeline you can read back later, which is handy when the start and end happen in different functions.
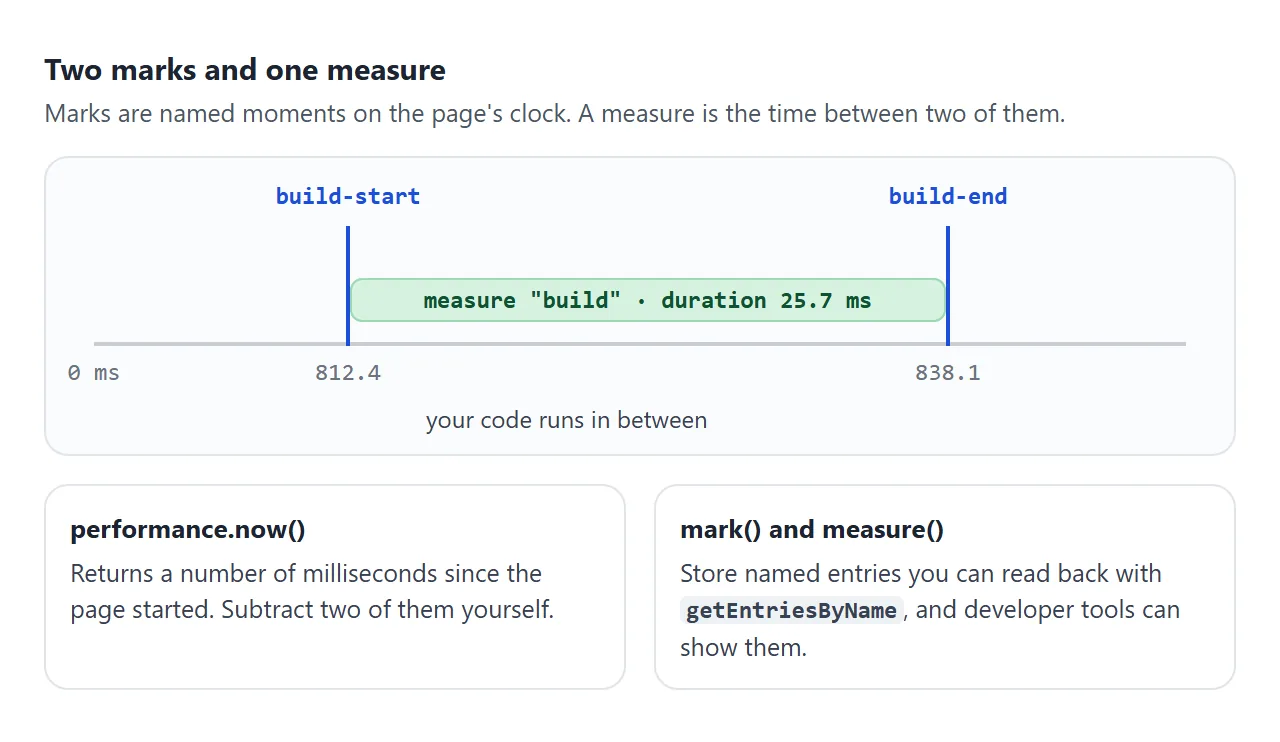
performance.mark('build-start');
buildList();
performance.mark('build-end');
const m = performance.measure('build', 'build-start', 'build-end');
m.duration;                             // milliseconds
performance.getEntriesByName('build');  // every "build" measure so far
Leave out the end mark and the measure ends now. Pass an object instead, and you can attach extra data in detail, as the first example does to label runs with layout. All three engines we tested accepted the object form.
Entries pile up until you remove them. Call performance.clearMarks() and performance.clearMeasures() when you reset. Chrome DevTools also draws marks and measures in its Performance panel recordings.
What your timing leaves out
In the first example, building 3,000 rows took 4-5 ms in Chromium. With Include layout ticked, the same click took 31-40 ms. The extra time is layout: working out where every row goes.
Normally the browser lays out after your script finishes, before it paints. That work falls outside your marks. Reading a size, such as offsetHeight, forces layout to happen right there, inside the timing.
Neither number is wrong. The first is your script. The second is closer to what the user waits for. Know which one you are looking at.
Layout thrashing: read everything, then write
Reading a size is cheap when the layout is up to date. After a style change it is not, so the browser must lay out again before it can answer. Do that in a loop and you get layout thrashing: one full layout per element.
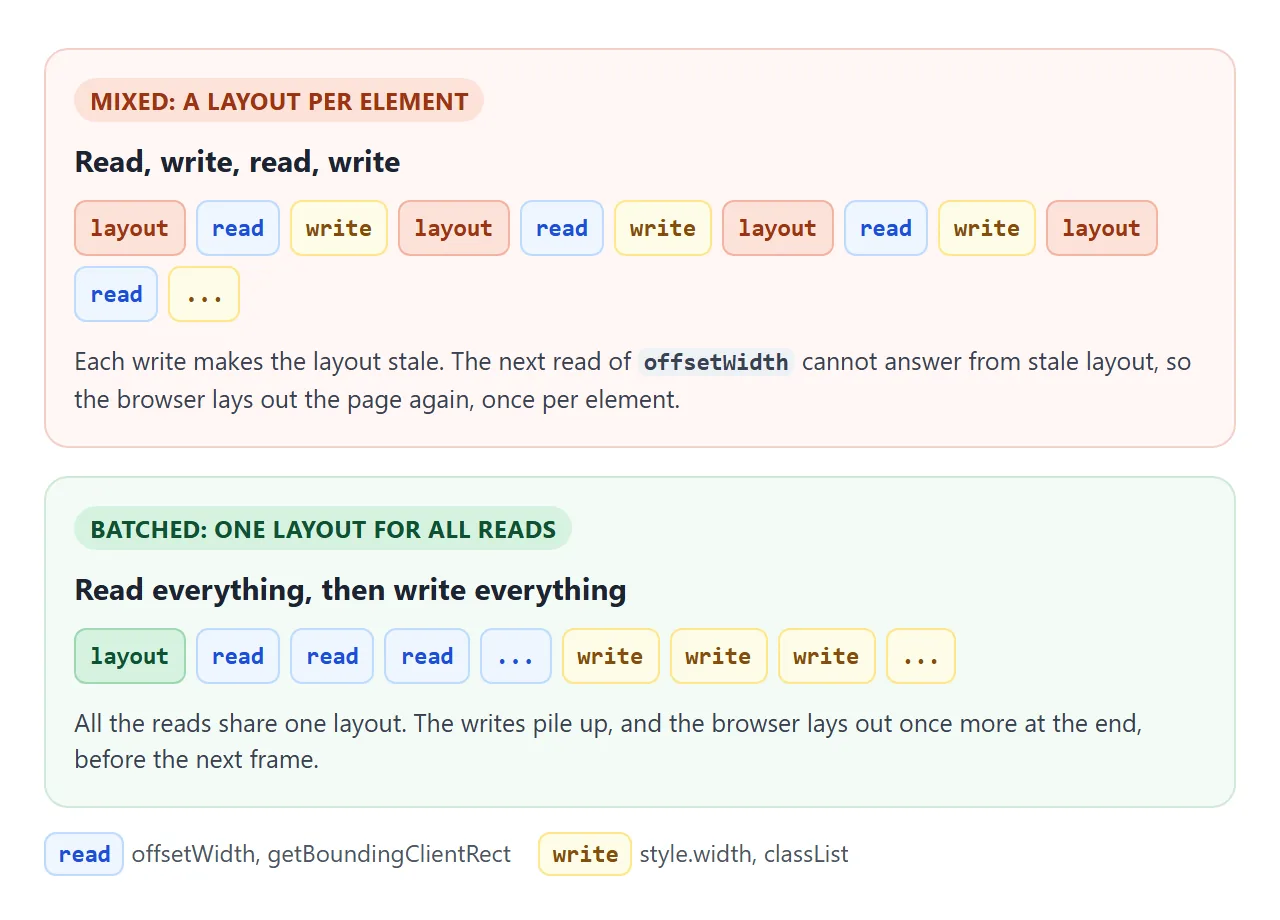
Both buttons below change the widths of 800 bars to the same values. Only the order of reads and writes differs.
<!doctype html>
<html lang="en">
<head>
<meta charset="utf-8">
<meta name="viewport" content="width=device-width, initial-scale=1">
<title>Layout thrashing: read, write, read, write</title>
<style>
  body { margin: 0; padding: 14px; font-family: system-ui, sans-serif; background: #f4f5f7; color: #1d2330; }
  .bar { display: flex; flex-wrap: wrap; gap: 8px; }
  button { font: inherit; padding: 8px 12px; border: 0; border-radius: 8px; color: #fff; cursor: pointer; }
  #mixed { background: #c2410c; }
  #batched { background: #15803d; }
  table { margin: 12px 0; border-collapse: collapse; font-size: 14px; }
  td { padding: 3px 12px 3px 0; }
  td + td { font: 600 14px ui-monospace, Consolas, monospace; }
  #bars { height: 190px; overflow: hidden; background: #fff; border-radius: 8px; padding: 6px; }
  #bars div { height: 2px; margin-bottom: 1px; background: #93c5fd; }
</style>
</head>
<body>
<div class="bar">
  <button id="mixed">Read, write, read, write</button>
  <button id="batched">Read all, then write all</button>
</div>
<table>
  <tr><td>Mixed</td><td id="tMixed">-</td></tr>
  <tr><td>Batched</td><td id="tBatched">-</td></tr>
</table>
<div id="bars"></div>

<script>
  const box = document.getElementById('bars');
  for (let i = 0; i < 800; i++) {
    const d = document.createElement('div');
    d.style.width = (20 + (i * 7) % 200) + 'px';
    box.append(d);
  }
  const bars = [...box.children];
  const next = (w) => 20 + (w + 13) % 200;  // the new width, from the old one

  // Bad: each write makes the layout stale, so the next read lays out again
  function mixed() {
    for (const bar of bars) {
      const w = bar.offsetWidth;              // read (forces layout)
      bar.style.width = next(w) + 'px';       // write (invalidates layout)
    }
  }

  // Good: one layout for all the reads, then only writes
  function batched() {
    const widths = bars.map(bar => bar.offsetWidth);
    bars.forEach((bar, i) => { bar.style.width = next(widths[i]) + 'px'; });
  }

  function time(fn, cell) {
    box.offsetWidth;                          // start from a fresh layout
    const t0 = performance.now();
    fn();
    box.offsetWidth;                          // include the final layout in both
    document.getElementById(cell).textContent = (performance.now() - t0).toFixed(1) + ' ms';
  }
  document.getElementById('mixed').addEventListener('click', () => time(mixed, 'tMixed'));
  document.getElementById('batched').addEventListener('click', () => time(batched, 'tBatched'));
</script>
</body>
</html>
The fix is to split the loop into two passes:
const widths = bars.map(bar => bar.offsetWidth);          // all reads
bars.forEach((bar, i) => bar.style.width = next(widths[i]) + 'px');  // all writes
What we measured with this example, three runs each, in the Playwright builds of each engine on one Windows PC:
| Engine | Read, write, read, write | Read all, then write all |
|---|---|---|
| Chromium | 158-165 ms | 1.4-1.8 ms |
| Firefox | 25-29 ms | 3 ms |
| WebKit | 26-31 ms | 2-3 ms |
Your numbers will differ with the device. The gap between the two columns is the point. Reads include offsetWidth, offsetHeight, getBoundingClientRect() and size values from getComputedStyle(). Writes include style and class changes. For work spread over frames, put the writes in requestAnimationFrame.
Long tasks: when the page freezes
The main thread runs your JavaScript, handles clicks and paints frames, one thing at a time. A long task is any task over 50 ms. While it runs, the page cannot respond or redraw.
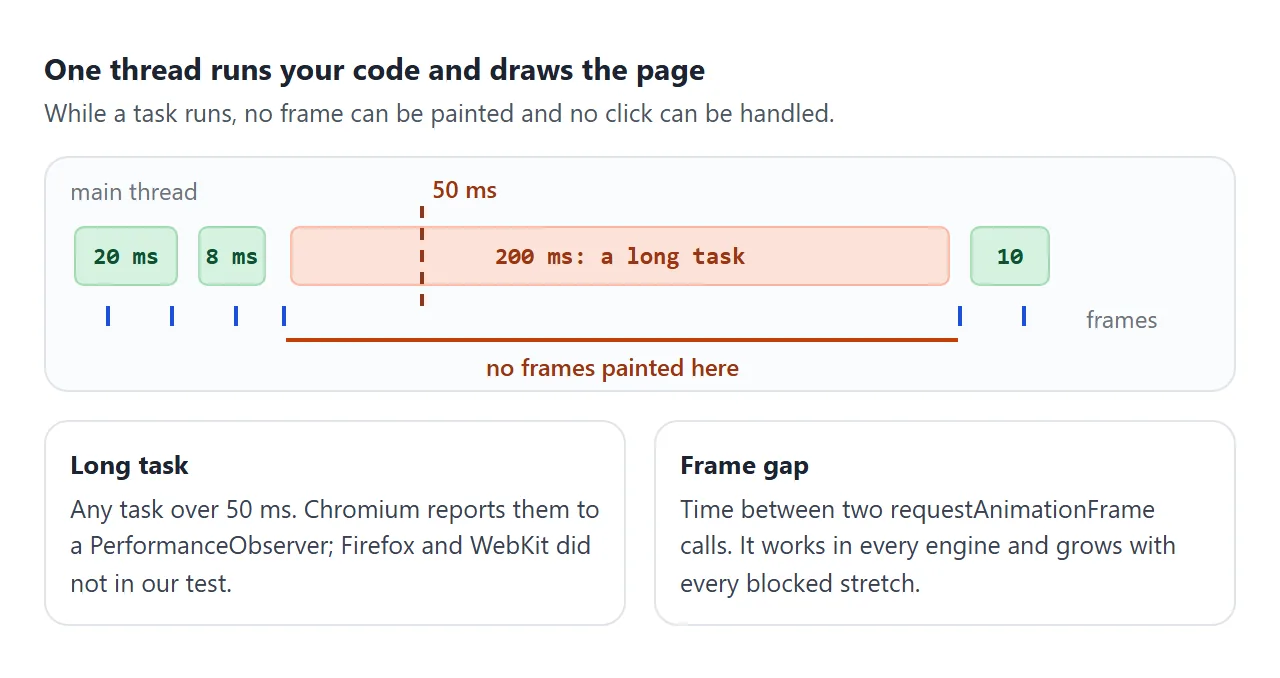
Where the browser supports it, a PerformanceObserver reports each long task:
if (PerformanceObserver.supportedEntryTypes.includes('longtask')) {
  new PerformanceObserver(list => {
    for (const e of list.getEntries()) console.log('long task', e.duration);
  }).observe({ type: 'longtask' });
}
We tested Chromium, Firefox and WebKit through Playwright. Only Chromium listed longtask and reported entries; the other two reported nothing and threw no error. That is why the check above comes first.
A check that worked in all three is the gap between animation frames. Record the timestamp in each requestAnimationFrame call. A gap far above the usual frame time means something held the thread.
Browsers pause these frames in background tabs, so a huge gap can also mean the tab was hidden.
To fix a long task, split it into chunks, move heavy math to a Web Worker, or skip rendering off-screen parts with content-visibility.
Image sizes: file pixels against screen pixels
An image can be slow without any script. The usual cause is a file far wider than the space it is shown in. The browser downloads and decodes every pixel, then throws most of them away.
The check is two numbers. img.naturalWidth is the width of the file. The width the screen needs is the displayed width times devicePixelRatio: a 100 px slot on a screen with a ratio of 3 needs 300 file pixels to look sharp.
const need = img.clientWidth * devicePixelRatio;
const ratio = img.naturalWidth / need;   // well above 1: too big; below 1: blurry
No single file fits every screen. srcset lets you list a few widths and have the browser pick one.
A finished example: a live measurement panel
This panel puts everything above on one page. It reads the load milestones from the navigation timing entry, counts long tasks where the browser reports them, tracks the slowest frame gap, and checks three images.
<!doctype html>
<html lang="en">
<head>
<meta charset="utf-8">
<meta name="viewport" content="width=device-width, initial-scale=1">
<title>A live measurement panel</title>
<style>
  body { margin: 0; padding: 14px; font-family: system-ui, sans-serif; background: #f4f5f7; color: #1d2330; }
  .bar { display: flex; flex-wrap: wrap; gap: 8px; }
  button { font: inherit; font-size: 14px; padding: 8px 12px; border: 0; border-radius: 8px; background: #2563eb; color: #fff; cursor: pointer; }
  #block { background: #c2410c; }
  #reset { background: #6b7280; }
  .panel { margin: 12px 0; padding: 10px 14px; border-radius: 10px; background: #111827; color: #e5e7eb; }
  .panel table { width: 100%; border-collapse: collapse; font-size: 14px; }
  .panel td { padding: 4px 0; vertical-align: top; }
  .panel td + td { text-align: right; font: 600 14px ui-monospace, Consolas, monospace; color: #86efac; }
  .imgs { display: flex; flex-wrap: wrap; gap: 12px; }
  figure { margin: 0; width: 100px; font-size: 12px; line-height: 1.35; }
  figure img { display: block; width: 100px; height: 62px; border-radius: 6px; }
  .big { color: #c2410c; font-weight: 600; }
  .small { color: #b45309; font-weight: 600; }
  .ok { color: #15803d; font-weight: 600; }
</style>
</head>
<body>
<div class="bar">
  <button id="block">Block for 200 ms</button>
  <button id="short">Run a 20 ms job</button>
  <button id="reset">Reset</button>
</div>

<div class="panel">
  <table>
    <tr><td>HTML parsed (DOMContentLoaded)</td><td id="ready">-</td></tr>
    <tr><td>Page loaded (load)</td><td id="loaded">-</td></tr>
    <tr><td>Long tasks (over 50 ms)</td><td id="long">none yet</td></tr>
    <tr><td>Slowest frame gap</td><td id="gap">-</td></tr>
    <tr><td>Last measure</td><td id="measure">-</td></tr>
    <tr><td>Device pixel ratio</td><td id="dpr">-</td></tr>
  </table>
</div>

<div class="imgs">
  <figure><img alt="Large photo"></figure>
  <figure><img alt="Medium photo"></figure>
  <figure><img alt="Tiny photo"></figure>
</div>

<script>
  const $ = (id) => document.getElementById(id);

  // 1. Page load milestones, from the navigation timing entry.
  // Read them after load: while this script runs, they are still 0.
  addEventListener('load', () => {
    const nav = performance.getEntriesByType('navigation')[0];
    if (!nav) { $('ready').textContent = $('loaded').textContent = 'no entry'; return; }
    $('ready').textContent = nav.domContentLoadedEventEnd.toFixed(0) + ' ms';
    $('loaded').textContent = nav.loadEventStart.toFixed(0) + ' ms';
  });

  // 2. Long tasks: reported by the browser, where it supports them
  let count = 0, longest = 0;
  if (PerformanceObserver.supportedEntryTypes.includes('longtask')) {
    new PerformanceObserver((list) => {
      for (const e of list.getEntries()) { count++; longest = Math.max(longest, e.duration); }
      $('long').textContent = count + ', longest ' + longest.toFixed(0) + ' ms';
    }).observe({ type: 'longtask' });
  } else {
    $('long').textContent = 'not reported here';
  }

  // 3. Frame gaps: works everywhere. A long gap means the page could not paint
  let last = 0, worst = 0;
  function frame(t) {
    if (last) worst = Math.max(worst, t - last);
    last = t;
    $('gap').textContent = worst.toFixed(0) + ' ms';
    requestAnimationFrame(frame);
  }
  requestAnimationFrame(frame);

  // 4. Your own code, timed with marks and a measure
  function job(name, ms) {
    performance.mark(name + '-start');
    const t = performance.now();
    while (performance.now() - t < ms) {}   // busy work that holds the main thread
    const m = performance.measure(name, name + '-start');  // no end mark = now
    $('measure').textContent = name + ' ' + m.duration.toFixed(0) + ' ms';
  }
  $('block').addEventListener('click', () => job('block', 200));
  $('short').addEventListener('click', () => job('short-job', 20));
  $('reset').addEventListener('click', () => {
    count = longest = worst = 0;
    $('long').textContent = 'none yet';
    $('measure').textContent = '-';
    performance.clearMarks(); performance.clearMeasures();
  });

  // 5. Image sizes: file pixels against the pixels the screen needs
  // (stand-in photos drawn on a canvas, so the demo needs no image files)
  function photo(w, h) {
    const c = document.createElement('canvas');
    c.width = w; c.height = h;
    const g = c.getContext('2d');
    const grad = g.createLinearGradient(0, 0, w, h);
    grad.addColorStop(0, '#60a5fa'); grad.addColorStop(1, '#f59e0b');
    g.fillStyle = grad; g.fillRect(0, 0, w, h);
    return c.toDataURL('image/jpeg', 0.85);
  }
  const imgs = [...document.querySelectorAll('figure img')];
  const sizes = [[1600, 1000], [200, 125], [60, 38]];

  function checkImage(img) {
    const need = Math.round(img.clientWidth * devicePixelRatio);
    const ratio = img.naturalWidth / need;
    const [cls, word] = ratio > 2 ? ['big', 'too big'] : ratio < 1 ? ['small', 'too small'] : ['ok', 'fits'];
    img.nextElementSibling.innerHTML = 'file ' + img.naturalWidth + ' px wide<br>' +
      'screen needs ' + need + ' px<br><span class="' + cls + '">' + word + '</span>';
  }
  imgs.forEach((img, i) => {
    img.after(document.createElement('figcaption'));
    img.addEventListener('load', () => checkImage(img));
    img.src = photo(...sizes[i]);
  });
  $('dpr').textContent = devicePixelRatio;
  addEventListener('resize', () => { imgs.forEach(checkImage); $('dpr').textContent = devicePixelRatio; });
</script>
</body>
</html>
- Load times:
getEntriesByType('navigation')givesdomContentLoadedEventEndandloadEventStart. Read them in aloadlistener; while your script runs they are still 0. - Long tasks and frame gaps: the observer and the frame loop from the section above.
- The 20 ms job: it shows up as a measure, but not as a long task, because it is under 50 ms.
- Images: our demo calls a file too big when it has more than twice the pixels the screen needs.
To use it on your own page, copy the script and point the image check at your img elements.
When it does not work
| What you see | Cause | Fix |
|---|---|---|
| Every timing is 0 or 1 ms | The browser rounds the clock | Time more work, or loop and divide |
| The timing looks tiny, but the page still hangs | Layout and paint happen after your end mark | Read offsetHeight before the end mark |
| A loop over elements is slow | Reads and writes alternate | Read all sizes first, then write |
| No long tasks are ever reported | The browser does not support longtask |
Check supported types, and use frame gaps |
| DOMContentLoaded shows 0 ms | Read before the event happened | Read it in a load listener |
| No navigation entry at all | Some frames have none (WebKit in a srcdoc iframe, in our test) | Show a fallback instead of a number |
| Frame gap jumps to seconds | The tab was hidden, so frames paused | Reset the counter when the page is visible again |
| Measures keep piling up | Entries stay until cleared | clearMarks() and clearMeasures() |
Share it as a link
Performance numbers depend on the device, so the useful test is on someone else's phone. A screenshot shows your numbers, not theirs, and an .html attachment may open as plain code.
To send the working panel, paste the page into a NOS document and choose Create share link. HTML to link walks through it.
The page renders as written and its scripts run, so each person who opens it sees the timings on their own device. If you change the code later, the same link shows the new version.