Dash is Plotly's open-source Python framework for data apps and dashboards. When people search "plotly dash html", they usually mean dash.html: the module that lets you write html.Div and html.H1 in Python instead of writing tags.
Dash turns those components into a web page, but the app is a Python server. Saving the page does not give you a working file.
For a single HTML file, you rebuild the app with Plotly.js, the chart library Dash itself uses. Here is Dash's minimal app done that way:
<!doctype html>
<html lang="en">
<head>
<meta charset="utf-8">
<meta name="viewport" content="width=device-width, initial-scale=1">
<title>Minimal Dash app as one HTML file</title>
<!-- Plotly.js, the library dcc.Graph uses, pinned to one version -->
<script src="https://cdn.jsdelivr.net/npm/plotly.js-dist-min@4.1.1/plotly.min.js"></script>
<style>
  body { margin: 0; padding: 16px; font-family: system-ui, sans-serif; color: #222; }
  h1 { text-align: center; font-size: 22px; margin: 4px 0 14px; }
  select { font: inherit; padding: 6px 8px; border-radius: 6px; border: 1px solid #c8ccd4; }
  #graph-content { height: 360px; }
</style>
</head>
<body>
<h1>Title of Dash App</h1>
<select id="dropdown-selection">
  <option>North</option>
  <option>South</option>
  <option>East</option>
</select>
<div id="graph-content"></div>

<script>
  // Sample data written into the page (the Python app reads a CSV)
  const years = [2019, 2020, 2021, 2022, 2023, 2024];
  const sales = {
    North: [12, 15, 14, 19, 23, 26],
    South: [20, 18, 21, 22, 21, 24],
    East:  [5, 9, 13, 16, 22, 30]
  };

  const dropdown = document.getElementById('dropdown-selection');

  // The @callback: runs on every change, redraws the graph
  function updateGraph() {
    const value = dropdown.value;
    Plotly.react('graph-content',
      [{ x: years, y: sales[value], mode: 'lines' }],
      { margin: { t: 20, r: 10, b: 40, l: 40 }, yaxis: { title: { text: 'sales' } } },
      { responsive: true, displaylogo: false });
  }

  dropdown.addEventListener('change', updateGraph);
  updateGraph();  // Dash also calls callbacks once when the app starts
</script>
</body>
</html>
The Python version, from the Dash docs, is the same three parts: a heading, a dropdown and a graph, plus one callback.
from dash import Dash, html, dcc, callback, Output, Input
import plotly.express as px
import pandas as pd

df = pd.read_csv('...')
app = Dash()

app.layout = [
    html.H1(children='Title of Dash App', style={'textAlign': 'center'}),
    dcc.Dropdown(df.country.unique(), 'Canada', id='dropdown-selection'),
    dcc.Graph(id='graph-content')
]

@callback(Output('graph-content', 'figure'),
          Input('dropdown-selection', 'value'))
def update_graph(value):
    dff = df[df.country == value]
    return px.line(dff, x='year', y='pop')

if __name__ == '__main__':
    app.run(debug=True)
What dash.html is, and how it maps to tags
The Dash docs say dash.html has a component for every HTML tag. html.Div becomes a <div>, html.H1 an <h1>, and so on. Each component is described through keyword arguments, which become the element's attributes.
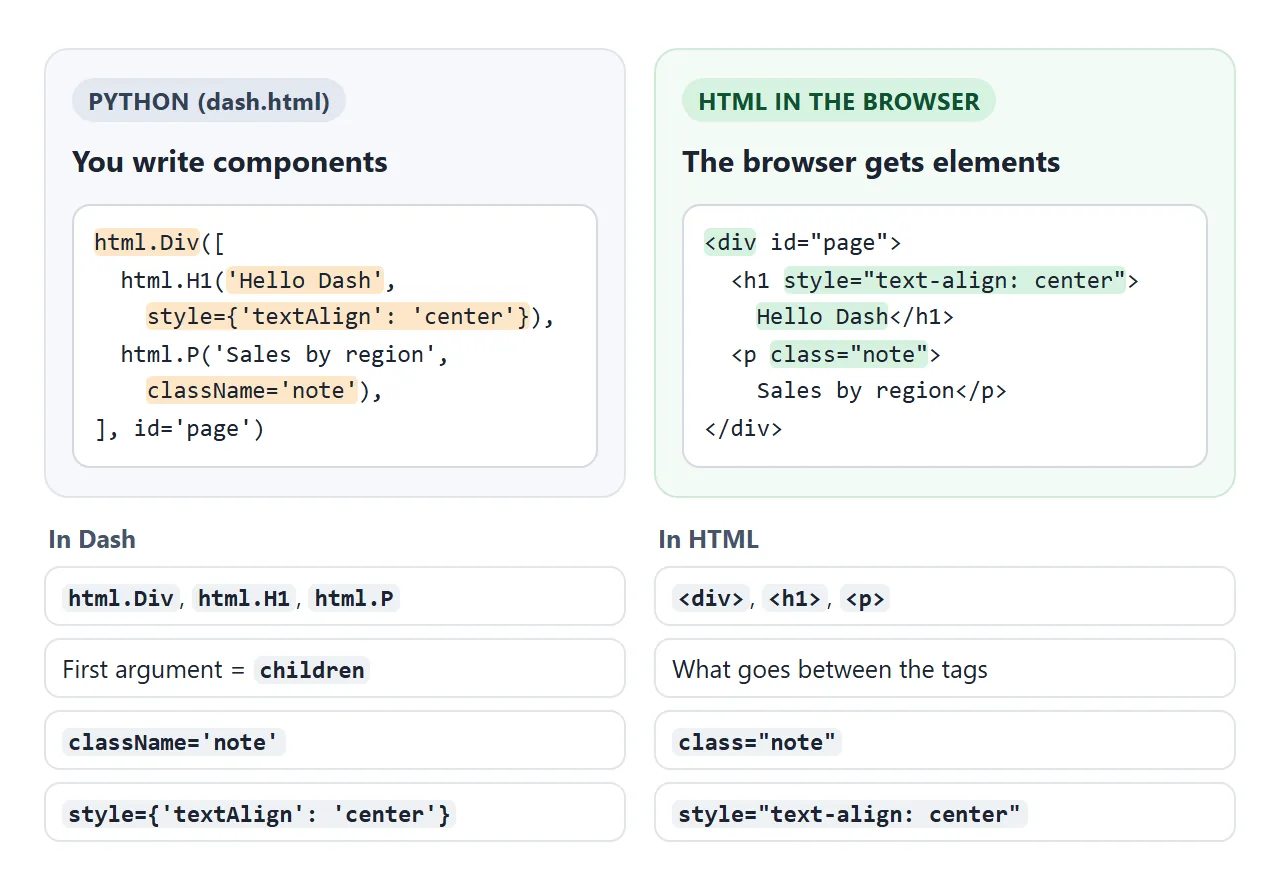
Three differences catch people when they move between the two:
| HTML | Dash |
|---|---|
| Content between the tags | children, always the first argument |
class="note" |
className='note' |
style="text-align: center" |
style={'textAlign': 'center'} |
width: 20px in a style |
'width': 20 (a number means pixels) |
An id attribute |
id='...', which callbacks also use |
The dcc module is different. Its components, such as dcc.Dropdown and dcc.Graph, are interactive and are generated with JavaScript, HTML and CSS through React. dcc.Graph draws with Plotly.js, so in a plain HTML file you call Plotly.js directly.
Why a Dash app is not one HTML file
You install Dash with pip install dash and start the script with Python. The minimal app reports that Dash is running on http://127.0.0.1:8050/. That address is a server on your own computer.
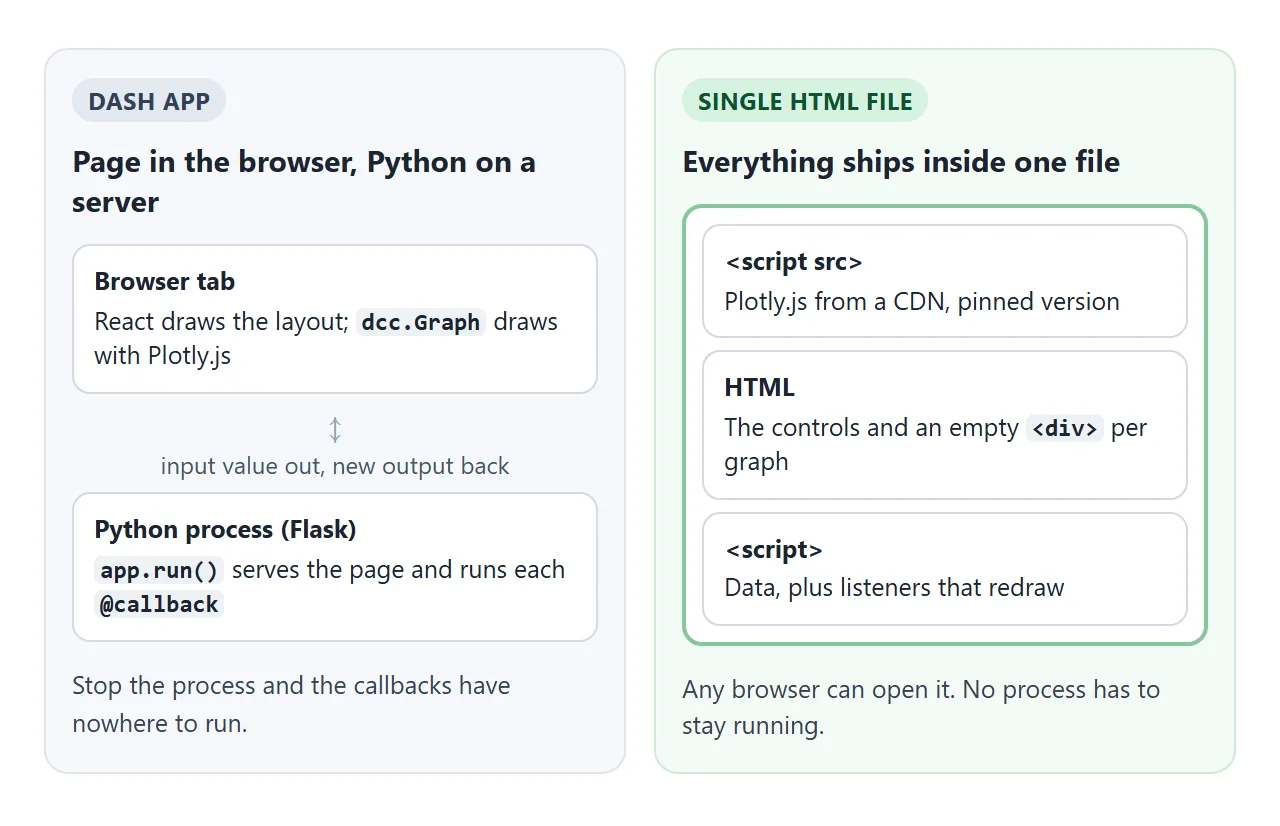
The browser tab shows the layout. The callbacks, though, run in Python on the server.
Each time an input changes, the browser sends the new value and waits for the result. That is why the Dash docs say that to share an app you need to deploy it to a server.
You can change the page Dash serves, through app.index_string and an assets folder for your own CSS and JavaScript. That still customises a page the server sends; it does not remove the server.
Callbacks become event listeners
A Dash callback is a function Dash calls whenever an input component's property changes, to update a property of another component.
When the app starts, Dash also calls every callback once with the initial values. In plain JavaScript, that is a listener plus one first call.
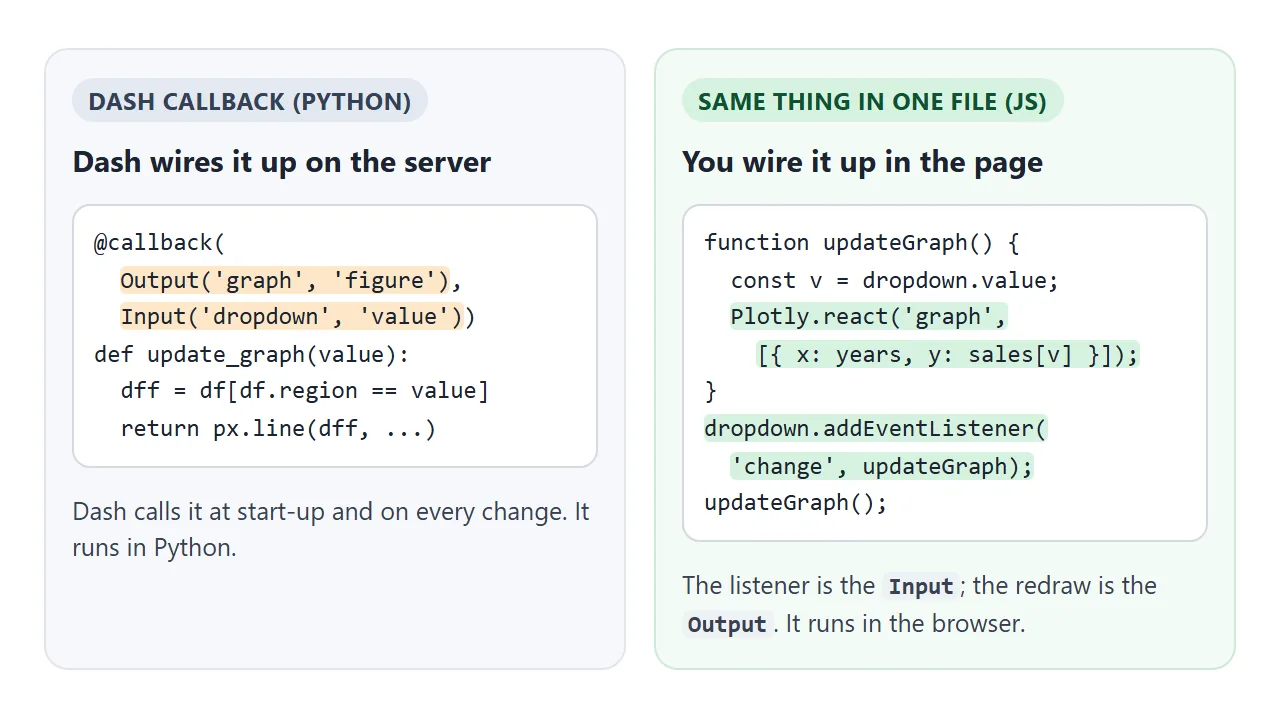
This is the example from Dash's "Basic Callbacks" page, rebuilt without any library:
<!doctype html>
<html lang="en">
<head>
<meta charset="utf-8">
<meta name="viewport" content="width=device-width, initial-scale=1">
<title>A Dash callback in plain JavaScript</title>
<style>
  body { margin: 0; padding: 18px; font-family: system-ui, sans-serif; color: #222; }
  h6 { font-size: 15px; margin: 0 0 12px; }
  input { font: inherit; padding: 6px 8px; border: 1px solid #c8ccd4; border-radius: 6px; max-width: 100%; box-sizing: border-box; }
  #my-output { margin-top: 14px; font-size: 18px; }
  .calls { margin-top: 18px; font-size: 13px; color: #666; }
</style>
</head>
<body>
<h6>Change the value in the text box to see callbacks in action!</h6>
<div>Input: <input id="my-input" value="initial value" type="text"></div>
<br>
<div id="my-output"></div>
<p class="calls">Callback has run <b id="calls">0</b> times.</p>

<script>
  const input = document.getElementById('my-input');
  const output = document.getElementById('my-output');
  const calls = document.getElementById('calls');
  let count = 0;

  // Output('my-output', 'children'), Input('my-input', 'value')
  function updateOutput() {
    output.textContent = 'Output: ' + input.value;
    calls.textContent = ++count;
  }

  input.addEventListener('input', updateOutput);
  updateOutput();  // the initial call Dash makes on page load
</script>
</body>
</html>
To convert a small app:
- Load Plotly.js. Add a script tag for
plotly.js-dist-minfrom a CDN, with a pinned version. - Write the layout as HTML. Each
html.component becomes its tag,classNamebecomesclass, and the style dictionary becomes CSS. - Give each
dcc.Grapha div. An empty<div>with anidand a height. - Turn each callback into a function. It reads the input values and draws the output with
Plotly.react. - Call it on change and on load. One
inputorchangelistener per Input, plus one call at the end of the script.
The script tag used on this page:
<script src="https://cdn.jsdelivr.net/npm/plotly.js-dist-min@4.1.1/plotly.min.js"></script>
Plotly.newPlot draws a new chart and overwrites any chart already in the div. Plotly.react takes the same arguments, and when called again on the same div it updates the chart more efficiently. That makes it the natural match for a callback.
Only need the chart? Export it with write_html
If the app is really one figure, you may not need Dash at all. In plotly.py, any figure saves as an HTML file with write_html, and the docs say the file opens in any web browser with the chart still interactive.
fig.write_html('chart.html', include_plotlyjs=True)
The include_plotlyjs argument decides where the library comes from:
| Value | What the file does |
|---|---|
True |
Includes Plotly.js (about 3MB) and works offline |
'cdn' |
Loads Plotly.js from a CDN; about 3MB smaller, needs a connection |
A URL ending in .js |
Loads Plotly.js from that address |
False |
No Plotly.js; for pages that already load it |
To pick the host yourself, pass a URL:
fig.write_html('chart.html',
    include_plotlyjs='https://cdn.jsdelivr.net/npm/plotly.js-dist-min@4.1.1/plotly.min.js')
Sharing a Plotly export covers where to send that file, and Plotly JS charts covers making the chart readable on a phone.
A finished example: a small dashboard
This puts several callbacks together: a region filter, a year slider, two numbers, a bar chart and a line chart. Clicking a bar picks the product the line chart shows.
<!doctype html>
<html lang="en">
<head>
<meta charset="utf-8">
<meta name="viewport" content="width=device-width, initial-scale=1">
<title>Small Dash-style dashboard in one HTML file</title>
<script src="https://cdn.jsdelivr.net/npm/plotly.js-dist-min@4.1.1/plotly.min.js"></script>
<style>
  body { margin: 0; padding: 16px; font-family: system-ui, sans-serif; color: #222; background: #f6f7f9; }
  h1 { font-size: 20px; margin: 0 0 12px; }
  .controls { display: flex; flex-wrap: wrap; gap: 14px; align-items: center; margin-bottom: 12px; font-size: 14px; }
  select, input { font: inherit; }
  .kpis { display: grid; grid-template-columns: 1fr 1fr; gap: 10px; margin-bottom: 12px; }
  .kpi { background: #fff; border-radius: 10px; padding: 10px 12px; box-shadow: 0 1px 2px rgba(0,0,0,.08); }
  .kpi b { display: block; font-size: 24px; }
  .kpi span { font-size: 13px; color: #666; }
  .card { background: #fff; border-radius: 10px; padding: 8px; margin-bottom: 12px; box-shadow: 0 1px 2px rgba(0,0,0,.08); }
  .graph { height: 260px; }
  .hint { font-size: 13px; color: #666; margin: 2px 4px 6px; }
</style>
</head>
<body>
<h1>Sales by product</h1>
<div class="controls">
  <label>Region
    <select id="region">
      <option>All</option><option>North</option><option>South</option>
    </select>
  </label>
  <label>From <input id="from" type="range" min="2019" max="2023" value="2019"> <span id="from-label">2019</span></label>
</div>
<div class="kpis">
  <div class="kpi"><b id="total">0</b><span>units in range</span></div>
  <div class="kpi"><b id="best">-</b><span>best product</span></div>
</div>
<div class="card">
  <p class="hint">Click a bar to show that product below.</p>
  <div id="bars" class="graph"></div>
</div>
<div class="card">
  <div id="line" class="graph"></div>
</div>

<script>
  // Sample data: units per product, per region, per year (2019-2024)
  const years = [2019, 2020, 2021, 2022, 2023, 2024];
  const data = {
    North: { Lamps: [8, 9, 11, 12, 15, 17], Chairs: [14, 13, 12, 12, 11, 10], Desks: [3, 5, 6, 9, 10, 12] },
    South: { Lamps: [6, 6, 7, 7, 8, 9], Chairs: [10, 12, 15, 16, 18, 21], Desks: [4, 4, 5, 6, 6, 7] }
  };
  const products = ['Lamps', 'Chairs', 'Desks'];
  const config = { responsive: true, displaylogo: false };
  const margin = { t: 10, r: 10, b: 40, l: 40 };

  const region = document.getElementById('region');
  const from = document.getElementById('from');
  let picked = 'Lamps';  // state kept between runs, like dcc.Store

  // Units for one product in the chosen region, one number per year
  function series(product) {
    const regions = region.value === 'All' ? ['North', 'South'] : [region.value];
    return years.map((y, i) => regions.reduce((sum, r) => sum + data[r][product][i], 0));
  }

  // One function redraws everything, like a callback with several Outputs
  function render() {
    const start = years.indexOf(+from.value);
    document.getElementById('from-label').textContent = from.value;

    const totals = products.map(p => series(p).slice(start).reduce((a, b) => a + b, 0));
    document.getElementById('total').textContent = totals.reduce((a, b) => a + b, 0);
    document.getElementById('best').textContent = products[totals.indexOf(Math.max(...totals))];

    Plotly.react('bars',
      [{ type: 'bar', x: products, y: totals,
         marker: { color: products.map(p => p === picked ? '#2563eb' : '#a5b4fc') } }],
      { margin }, config);

    Plotly.react('line',
      [{ x: years.slice(start), y: series(picked).slice(start), mode: 'lines+markers', name: picked }],
      { margin: { ...margin, t: 36 }, xaxis: { dtick: 1 },
        title: { text: picked + ' per year', font: { size: 14 } } }, config);
  }

  region.addEventListener('change', render);
  from.addEventListener('input', render);
  render();

  // Like clickData on dcc.Graph: a click on a bar picks the product
  document.getElementById('bars').on('plotly_click', e => {
    picked = e.points[0].x;
    render();
  });
</script>
</body>
</html>
- One function, several Outputs:
render()recomputes the numbers and callsPlotly.reactfor both charts. - Clicks as input: in Dash, a click arrives as
clickDataondcc.Graph. In Plotly.js, it is theplotly_clickevent on the chart's div. - State between runs: the picked product lives in a variable outside
render(), so it survives each redraw. - Data in the page: the rows are written into the script, where the Python app would read a CSV.
Deploying the real Dash app
When the app needs Python on every change, such as reading a database or running a model, keep it in Dash and put it on a server.
Plotly's docs name two platforms of its own: Plotly Cloud, which is free to start on its Free plan, and Dash Enterprise.
If you want a plain HTML version instead, single HTML file apps explains what fits in one file.
When it does not work
| What you see | Cause | Fix |
|---|---|---|
| A saved copy of the Dash page does not respond | Callbacks run in Python on the server | Rebuild in plain HTML with Plotly.js |
Others cannot open 127.0.0.1:8050 |
That address is your own computer | Deploy the app, or share a plain HTML version |
SyntaxError on html.Div(class=...) |
class is a reserved word in Python |
Use className |
| A style key has no effect | Dash style keys are camelCase | textAlign, not text-align |
HTML tags show as text in dcc.Markdown |
dangerously_allow_html is False by default |
Set it to True only for markup you trust |
Plotly is not defined |
The Plotly.js script is missing or loads after your code | Put the script tag above your own script |
| The chart redraws from scratch on every change | Using Plotly.newPlot in a callback |
Use Plotly.react |
| The exported chart is several megabytes | include_plotlyjs=True bundles the library |
Pass 'cdn' or a .js URL |
| The exported chart does not appear offline | It loads Plotly.js from the network | Export with include_plotlyjs=True |
Share it as a link
A dashboard is meant to be filtered and clicked. A screenshot freezes one view, and sending the Python means the other person has to install it and run a server first.
To send the plain HTML version, paste the page into a NOS document and choose Create share link. HTML to link walks through it. Scripts from cdn.jsdelivr.net load there, so Plotly.js works as written.
The page renders and its scripts run, so the people you send it to can use the filters and click the bars without an account. If you change the code later, the same link shows the new version.