Chart.js is an open-source JavaScript library that draws charts on an HTML <canvas>. In a single HTML file you need three things: a canvas, one script tag that loads Chart.js from a CDN, and a few lines that call new Chart().
There is nothing to install and no build step.
Here is the whole thing. Change a number in data and the bars follow.
<!doctype html>
<html lang="en">
<head>
<meta charset="utf-8">
<meta name="viewport" content="width=device-width, initial-scale=1">
<title>Chart.js bar chart</title>
<style>
  body { margin: 0; padding: 16px; font-family: system-ui, sans-serif; background: #fff; }
  /* the chart sizes itself to this box: position relative, nothing else inside */
  .chart-box { position: relative; max-width: 640px; margin: 0 auto; }
</style>
</head>
<body>
<div class="chart-box">
  <canvas id="myChart"></canvas>
</div>

<!-- 1. load Chart.js (pinned version) before your own script -->
<script src="https://cdn.jsdelivr.net/npm/chart.js@4.5.1/dist/chart.umd.min.js"></script>

<!-- 2. then draw the chart on the canvas -->
<script>
  const canvas = document.getElementById('myChart');

  new Chart(canvas, {
    type: 'bar',
    data: {
      labels: ['Mon', 'Tue', 'Wed', 'Thu', 'Fri'],
      datasets: [{
        label: 'Orders',
        data: [12, 19, 7, 15, 22],
        backgroundColor: '#3b82f6'
      }]
    },
    options: {
      scales: { y: { beginAtZero: true } }
    }
  });
</script>
</body>
</html>
The Chart.js docs say it is licensed under the MIT license and renders on canvas rather than SVG. If you want a chart with no library at all, an HTML bar chart shows the plain HTML and CSS way.
The smallest working file
Copy this into an empty .html file and open it in a browser:
<!doctype html>
<meta charset="utf-8">
<div style="position: relative">
  <canvas id="myChart"></canvas>
</div>

<script src="https://cdn.jsdelivr.net/npm/chart.js@4.5.1/dist/chart.umd.min.js"></script>
<script>
  new Chart(document.getElementById('myChart'), {
    type: 'bar',
    data: {
      labels: ['Mon', 'Tue', 'Wed'],
      datasets: [{ label: 'Orders', data: [12, 19, 7] }]
    }
  });
</script>
- The canvas is where Chart.js draws. Give it an
idso your script can find it. - The first script tag loads
chart.umd.min.js. This build puts one global,Chart, on the page. - The second script tag creates the chart. The config has a
type, thedataand optionaloptions.
Change type to 'line', 'pie' or 'doughnut' and the same data draws as that chart. The docs describe pie and doughnut as the same chart class with a different cutout default.
Where the script tags go
Classic script tags run from top to bottom. Your code must come after the Chart.js tag, and the canvas must already exist when your code runs.
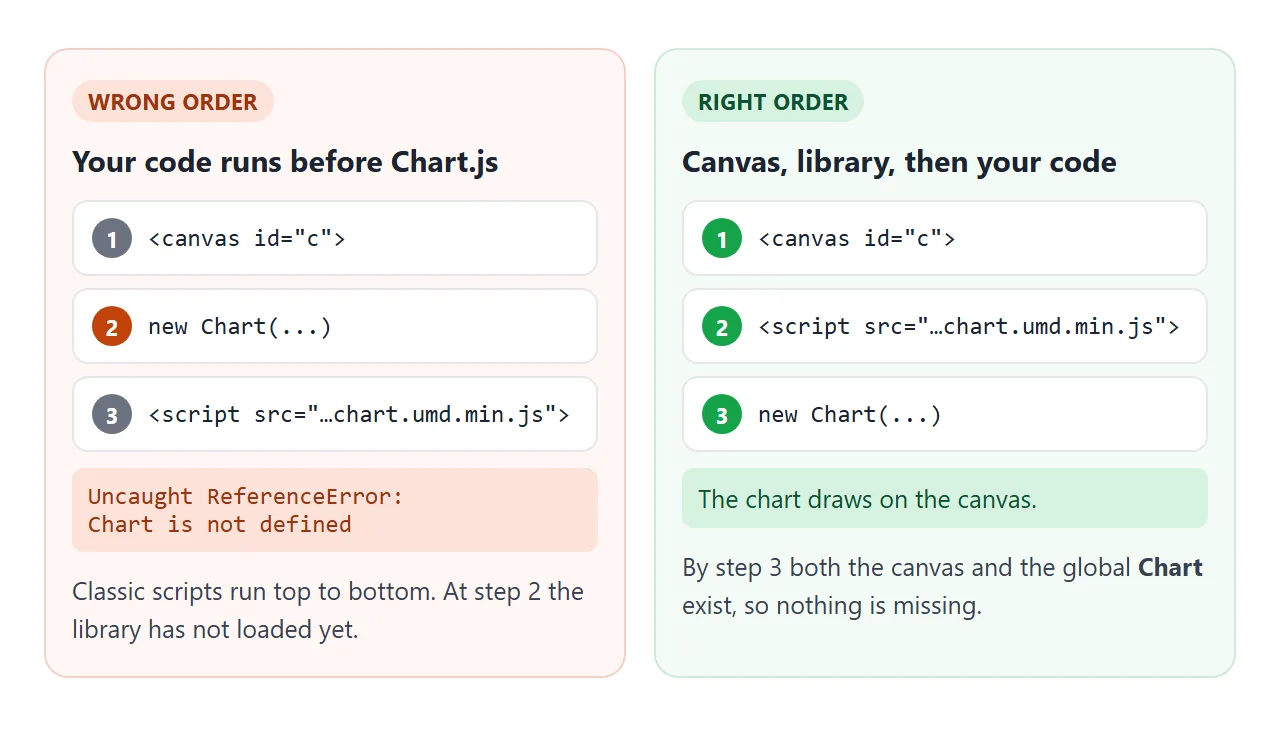
Both mistakes are easy to spot in the console:
- Your code above the Chart.js tag throws
Chart is not defined. - Your code in the
<head>, before the canvas, logs a "Failed to create chart" error, because the canvas is not there yet.
Putting both script tags at the end of the <body> avoids both. HTML JavaScript not working covers the console in more detail.
Which CDN address to use
The Chart.js installation page lists jsDelivr and cdnjs. Its getting-started example uses an address with no version:
<script src="https://cdn.jsdelivr.net/npm/chart.js"></script>
jsDelivr's own docs say leaving the version out loads the latest one and is not recommended for production. A pinned address keeps your page the same until you choose to upgrade:
<script src="https://cdn.jsdelivr.net/npm/chart.js@4.5.1/dist/chart.umd.min.js"></script>
<!-- or -->
<script src="https://cdnjs.cloudflare.com/ajax/libs/Chart.js/4.5.1/chart.umd.min.js"></script>
On 1 October 2026 the latest version on npm is 4.5.1, and both addresses above load it.
Controlling the chart size
Chart.js sizes the chart from the canvas's parent, not from the canvas. Its docs ask for a parent that is relatively positioned and holds only the canvas. A height set on the canvas itself either stops resizing or blurs the drawing.
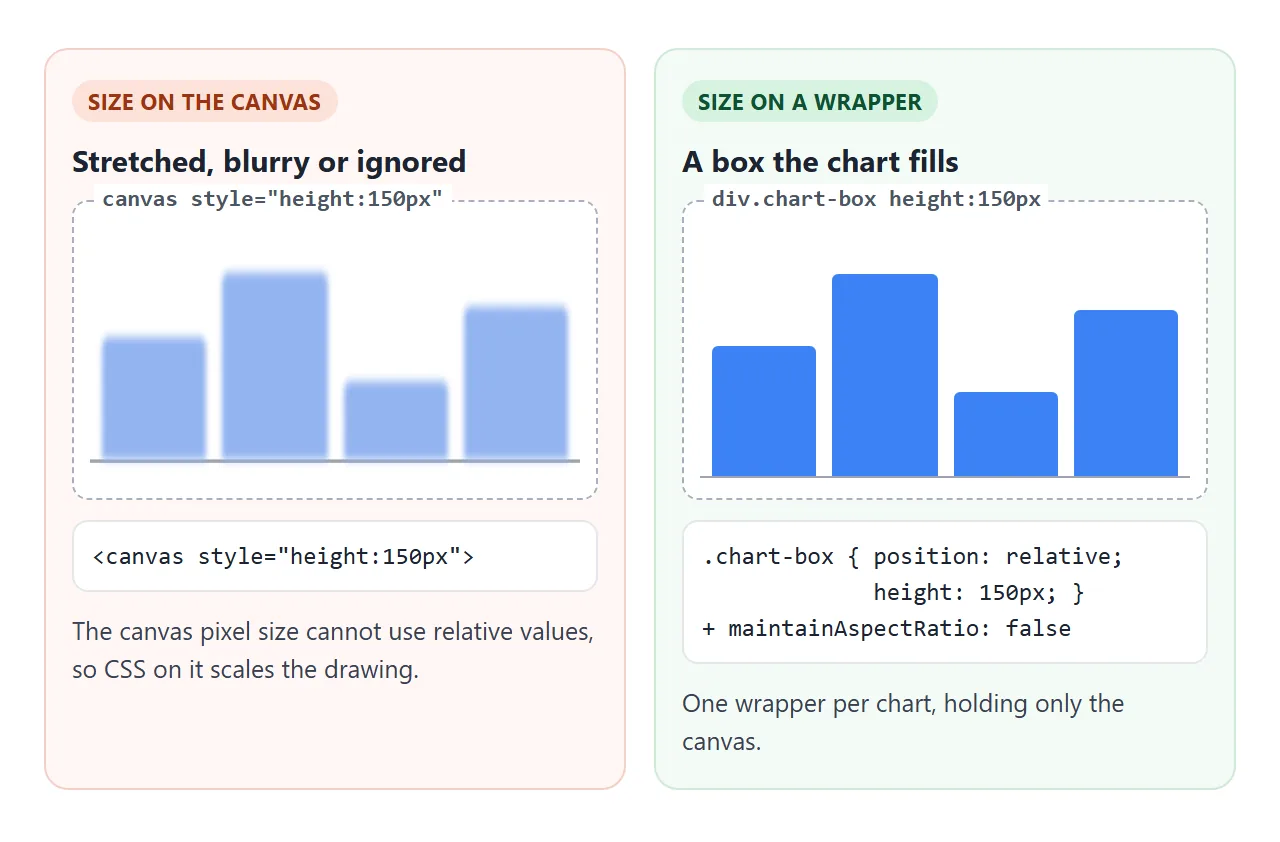
By default bar and line charts keep a 2:1 shape, and pie and doughnut charts keep 1:1. To fill a box of a fixed height instead, size the wrapper and turn the ratio off:
<div style="position: relative; height: 260px">
  <canvas id="sales"></canvas>
</div>
<script>
  new Chart(document.getElementById('sales'), {
    type: 'bar',
    data: { labels: ['Jan', 'Feb'], datasets: [{ data: [8, 12] }] },
    options: { maintainAspectRatio: false }
  });
</script>
Because the docs ask for a parent dedicated to the canvas, use one wrapper per chart and keep headings and text outside it.
Changing the data after the chart is drawn
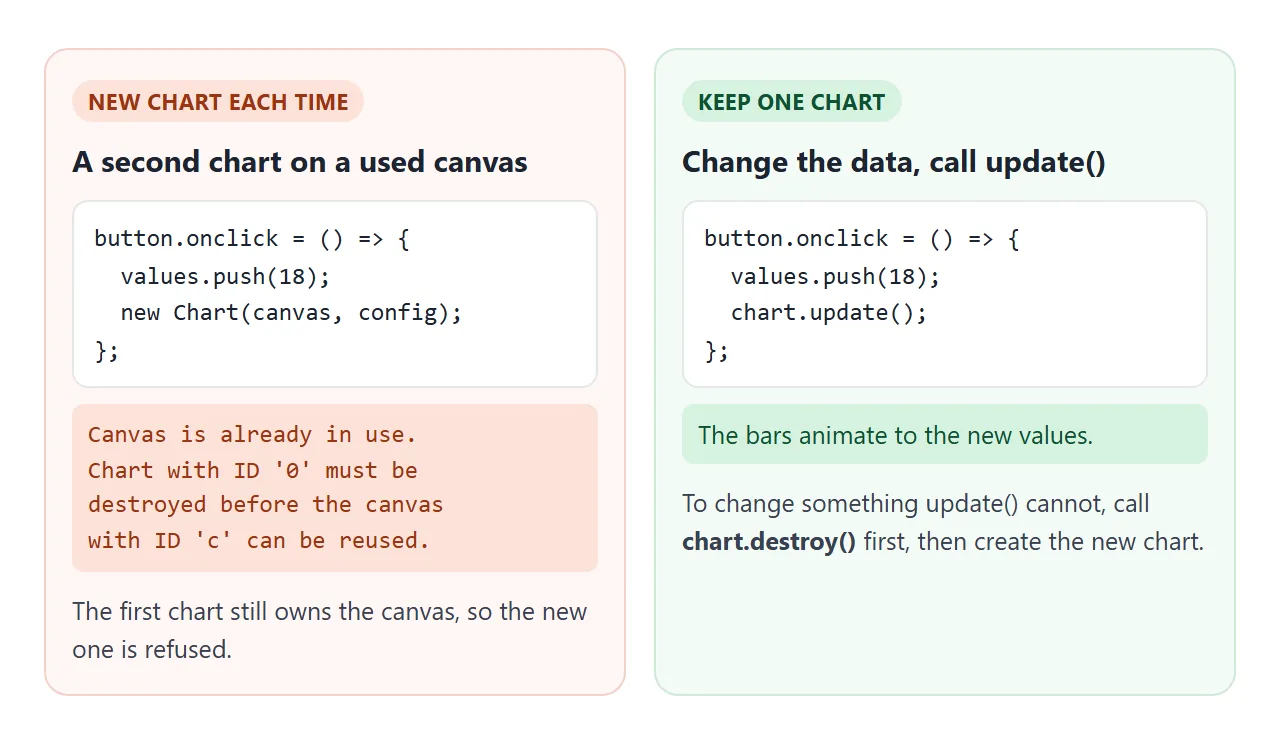
A chart does not watch your arrays. Change chart.data, then call chart.update() and the chart redraws, with an animation by default.
<!doctype html>
<html lang="en">
<head>
<meta charset="utf-8">
<meta name="viewport" content="width=device-width, initial-scale=1">
<title>Change a Chart.js chart</title>
<style>
  body { margin: 0; padding: 14px; font-family: system-ui, sans-serif; background: #f6f7f9; color: #1d2330; }
  .chart-box { position: relative; height: 260px; background: #fff; border-radius: 10px; }
  form, .row { display: flex; flex-wrap: wrap; gap: 8px; margin-top: 12px; align-items: center; }
  input { width: 90px; padding: 7px 8px; font: inherit; border: 1px solid #c9ced6; border-radius: 6px; }
  button { padding: 7px 12px; font: inherit; border: 0; border-radius: 6px; background: #2563eb; color: #fff; cursor: pointer; }
  button.alt { background: #e5e7eb; color: #1d2330; }
  #status { margin: 10px 0 0; font-size: 14px; color: #4b5563; }
</style>
</head>
<body>
<div class="chart-box"><canvas id="sales"></canvas></div>

<form id="add">
  <input id="label" placeholder="Label" value="Jun" required>
  <input id="value" type="number" placeholder="Value" value="18" required>
  <button>Add point</button>
</form>
<div class="row">
  <button class="alt" id="remove" type="button">Remove last</button>
  <button class="alt" id="type" type="button">Switch to line</button>
</div>
<p id="status"></p>

<script src="https://cdn.jsdelivr.net/npm/chart.js@4.5.1/dist/chart.umd.min.js"></script>
<script>
  const canvas = document.getElementById('sales');
  const info = document.getElementById('status');
  const labels = ['Jan', 'Feb', 'Mar', 'Apr', 'May'];
  const values = [8, 12, 9, 14, 11];
  let type = 'bar';
  let chart = draw();

  function draw() {
    return new Chart(canvas, {
      type,
      data: { labels, datasets: [{ label: 'Sales', data: values, backgroundColor: '#3b82f6', borderColor: '#2563eb' }] },
      // fill the 260px box instead of keeping the 2:1 shape
      options: { maintainAspectRatio: false, scales: { y: { beginAtZero: true } } }
    });
  }

  function report() { info.textContent = labels.length + ' points, ' + type + ' chart'; }

  // change the arrays, then call update(): no new Chart needed
  document.getElementById('add').addEventListener('submit', (e) => {
    e.preventDefault();  // handle the form here, do not send it anywhere
    labels.push(document.getElementById('label').value);
    values.push(Number(document.getElementById('value').value));
    chart.update();
    report();
  });

  document.getElementById('remove').addEventListener('click', () => {
    labels.pop();
    values.pop();
    chart.update();
    report();
  });

  // a new chart on the same canvas needs destroy() first
  document.getElementById('type').addEventListener('click', (e) => {
    type = type === 'bar' ? 'line' : 'bar';
    e.target.textContent = 'Switch to ' + (type === 'bar' ? 'line' : 'bar');
    chart.destroy();
    chart = draw();
    report();
  });

  report();
</script>
</body>
</html>
Calling new Chart() again on the same canvas does not work. The first chart still owns the canvas, and Chart.js throws "Canvas is already in use".
| You want to | Do this |
|---|---|
| Add or remove points | Change chart.data, then chart.update() |
| Change colours or options | Change chart.options, then chart.update() |
| Start over on the same canvas | chart.destroy(), then new Chart() |
| Find a chart you did not keep | Chart.getChart('canvasId') |
The form in the example calls preventDefault(), so it only updates the page and sends nothing to a server.
A finished example: a small dashboard
Two charts, range buttons and a download button. Each canvas has its own 240px wrapper, and every button only changes data and calls update().
<!doctype html>
<html lang="en">
<head>
<meta charset="utf-8">
<meta name="viewport" content="width=device-width, initial-scale=1">
<title>Chart.js dashboard</title>
<style>
  body { margin: 0; padding: 14px; font-family: system-ui, sans-serif; background: #eef0f3; color: #1d2330; }
  h1 { font-size: 18px; margin: 0 0 10px; }
  .bar { display: flex; flex-wrap: wrap; gap: 6px; margin-bottom: 12px; }
  .bar button { padding: 6px 11px; font: inherit; font-size: 14px; border: 1px solid #c9ced6; border-radius: 99px; background: #fff; color: #1d2330; cursor: pointer; }
  .bar button.on { background: #1d2330; color: #fff; border-color: #1d2330; }
  .bar .save { margin-left: auto; background: #2563eb; color: #fff; border-color: #2563eb; }
  .grid { display: grid; grid-template-columns: 2fr 1fr; gap: 12px; }
  .card { background: #fff; border-radius: 12px; padding: 12px; min-width: 0; }
  .card h2 { font-size: 14px; margin: 0 0 8px; color: #4b5563; }
  /* each canvas gets its own box with a fixed height */
  .chart-box { position: relative; height: 240px; }
  .total { font-size: 22px; font-weight: 700; margin: 8px 0 0; }
  @media (max-width: 560px) { .grid { grid-template-columns: 1fr; } }
</style>
</head>
<body>
<h1>Shop dashboard</h1>
<div class="bar">
  <button data-range="7" class="on">7 days</button>
  <button data-range="14">14 days</button>
  <button data-range="30">30 days</button>
  <button class="save" id="save">Save as PNG</button>
</div>
<div class="grid">
  <div class="card">
    <h2>Visitors and orders</h2>
    <div class="chart-box"><canvas id="trend"></canvas></div>
  </div>
  <div class="card">
    <h2>Orders by channel</h2>
    <div class="chart-box"><canvas id="channels"></canvas></div>
    <p class="total" id="total"></p>
  </div>
</div>

<script src="https://cdn.jsdelivr.net/npm/chart.js@4.5.1/dist/chart.umd.min.js"></script>
<script>
  // made-up data for 30 days
  const visitors = [], orders = [];
  for (let i = 0; i < 30; i++) {
    visitors.push(300 + Math.round(120 * Math.sin(i / 3)) + i * 6);
    orders.push(Math.round(visitors[i] * (0.05 + 0.02 * Math.cos(i / 4))));
  }

  const trend = new Chart(document.getElementById('trend'), {
    type: 'line',
    data: { labels: [], datasets: [
      { label: 'Visitors', data: [], borderColor: '#2563eb', backgroundColor: '#2563eb', yAxisID: 'y' },
      { label: 'Orders', data: [], borderColor: '#f97316', backgroundColor: '#f97316', yAxisID: 'y1' }
    ] },
    options: {
      maintainAspectRatio: false,
      interaction: { mode: 'index', intersect: false },  // one tooltip for both lines
      scales: {
        y: { beginAtZero: true, position: 'left' },
        y1: { beginAtZero: true, position: 'right', grid: { drawOnChartArea: false } }
      }
    }
  });

  const channels = new Chart(document.getElementById('channels'), {
    type: 'doughnut',
    data: { labels: ['Search', 'Social', 'Email'], datasets: [{ data: [], backgroundColor: ['#2563eb', '#f97316', '#10b981'] }] },
    options: { maintainAspectRatio: false, plugins: { legend: { position: 'bottom' } } }
  });

  function show(days) {
    const from = 30 - days;
    trend.data.labels = Array.from({ length: days }, (_, i) => 'Day ' + (from + i + 1));
    trend.data.datasets[0].data = visitors.slice(from);
    trend.data.datasets[1].data = orders.slice(from);
    trend.update();

    const sum = trend.data.datasets[1].data.reduce((a, b) => a + b, 0);
    const search = Math.round(sum * 0.5), social = Math.round(sum * 0.3);
    channels.data.datasets[0].data = [search, social, sum - search - social];
    channels.update();
    document.getElementById('total').textContent = sum + ' orders';
  }

  document.querySelectorAll('[data-range]').forEach((btn) => {
    btn.addEventListener('click', () => {
      document.querySelector('.on').classList.remove('on');
      btn.classList.add('on');
      show(Number(btn.dataset.range));
    });
  });

  // toBase64Image() returns the chart as it looks now, as a PNG data URL
  document.getElementById('save').addEventListener('click', () => {
    const a = document.createElement('a');
    a.href = trend.toBase64Image();
    a.download = 'trend.png';
    a.click();
  });

  show(7);
</script>
</body>
</html>
- Two y axes: each dataset names its axis with
yAxisID, and the second axis sits on the right. - One tooltip for both lines:
interaction: { mode: 'index' }shows every line at that point. - Save as PNG:
chart.toBase64Image()returns the chart as a data URL, used as thehrefof a download link.
On a narrow screen the two cards stack, and both charts resize because their wrappers do.
Chart.js with npm and a bundler
In a project with a bundler, you install the package and import it instead of using a script tag. The Chart.js integration page gives this quick start:
// npm install chart.js
import Chart from 'chart.js/auto';
That import only works through a bundler. In a plain HTML file, a module script with import Chart from 'chart.js' fails with "Failed to resolve module specifier", because the browser does not know where chart.js lives. For a single file, use the script tag.
When it does not work
| What you see | Cause | Fix |
|---|---|---|
Chart is not defined |
Your code runs before the Chart.js tag, or the CDN address is wrong | Put the Chart.js tag first and check the address |
| "Failed to create chart" in the console | The script runs before the canvas exists, or the id is wrong | Move the scripts below the canvas and match the id |
| "Canvas is already in use" | new Chart() called twice on one canvas |
Keep the chart and call update(), or destroy() first |
| New numbers do not appear | The data changed but nothing redrew | Call chart.update() |
| Chart is stretched, blurry or will not resize | Height set on the canvas | Size a wrapper div and set maintainAspectRatio: false |
| "Failed to resolve module specifier" | A bundler import in a plain HTML file | Use the chart.umd.min.js script tag |
Share it as a link
A Chart.js chart is easier to show than to describe. A screenshot loses the tooltips, and an .html file sent as an attachment may open as plain code, or not at all, on a phone.
To send the working version, paste the page into a NOS document and choose Create share link. HTML to link walks through it.
The page renders as written, its scripts run and Chart.js loads from jsDelivr, so the people you send it to can hover the points and press the buttons themselves.
Anyone with the link can open it without an account. If you change the data later, the same link shows the new version. Sharing an interactive chart covers more ways to send one.