Highcharts is a JavaScript charting library, and "Highcharts Angular" is its official wrapper for Angular projects. The chart itself does not need Angular. A script tag, a <div> and one call to Highcharts.chart() draw it in a plain HTML file.
Try it. This is the whole file, and the chart is live.
<!doctype html>
<html lang="en">
<head>
<meta charset="utf-8">
<meta name="viewport" content="width=device-width, initial-scale=1">
<title>Highcharts in one file</title>
<style>
  body { margin: 0; padding: 12px; font-family: system-ui, sans-serif; background: #fff; }
  #chart { width: 100%; height: 320px; }  /* the chart fills this box */
</style>
</head>
<body>
<div id="chart"></div>

<!-- 1. load the library first (pinned version) -->
<script src="https://cdn.jsdelivr.net/npm/highcharts@13.1.1/highcharts.js"></script>
<script>
  // 2. the options object: this is the part you reuse in any framework
  const options = {
    chart: { type: 'line' },
    title: { text: 'Visits per weekday' },
    xAxis: { categories: ['Mon', 'Tue', 'Wed', 'Thu', 'Fri'] },
    yAxis: { title: { text: 'Visits' } },
    series: [{ name: 'This week', data: [120, 180, 150, 210, 260] }]
  };

  // 3. draw it into the div with id="chart"
  Highcharts.chart('chart', options);
</script>
</body>
</html>
Build the chart this way first. When it looks right, the options object moves into Angular unchanged.
Where Angular fits in
Angular is a framework that compiles your app with a build step. The Highcharts wrapper for it, highcharts-angular, is installed with npm and used inside Angular components.
A plain HTML file has no build step. It loads the library with a script tag and runs it directly.
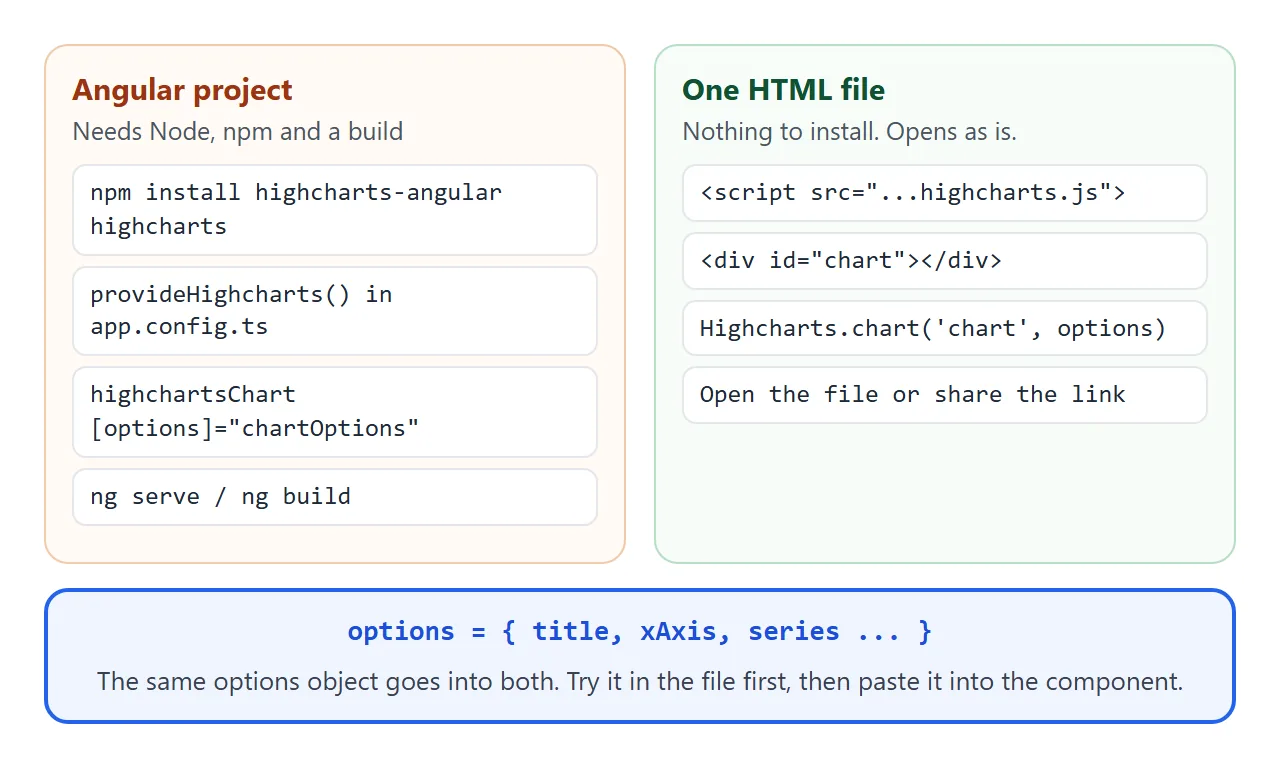
The part that is identical in both is the options object: title, axes and series. That is why a single file is a good place to design the chart.
The three parts of a chart
Every Highcharts page in a single file has the same three parts.
- A container. A
<div>with anid. The chart is drawn inside it. - The library. A
<script src="...highcharts.js">tag. - A call.
Highcharts.chart('chart', options), where the first argument is the container's id.
The options object describes everything else. title.text sets the heading, xAxis.categories the labels along the bottom, and series an array of data sets, each with a name and a data array.
Try another chart type
The chart type is one option, chart.type. The same series can be a line, a column, a bar or an area. In the example below, a button calls chart.update(), which changes an option on the chart that is already on screen and redraws it.
<!doctype html>
<html lang="en">
<head>
<meta charset="utf-8">
<meta name="viewport" content="width=device-width, initial-scale=1">
<title>Same data, different chart type</title>
<style>
  body { margin: 0; padding: 12px; font-family: system-ui, sans-serif; background: #fff; }
  .bar { display: flex; flex-wrap: wrap; gap: 8px; margin-bottom: 8px; }
  button {
    font: inherit; padding: 6px 12px; border: 1px solid #c7ccd4; border-radius: 8px;
    background: #f6f7f9; cursor: pointer;
  }
  button[aria-pressed="true"] { background: #1d4ed8; border-color: #1d4ed8; color: #fff; }
  #chart { width: 100%; height: 320px; }
</style>
</head>
<body>
<div class="bar" id="bar">
  <button data-type="line" aria-pressed="true">line</button>
  <button data-type="column" aria-pressed="false">column</button>
  <button data-type="bar" aria-pressed="false">bar</button>
  <button data-type="area" aria-pressed="false">area</button>
</div>
<div id="chart"></div>

<script src="https://cdn.jsdelivr.net/npm/highcharts@13.1.1/highcharts.js"></script>
<script>
  const chart = Highcharts.chart('chart', {
    chart: { type: 'line' },
    title: { text: 'Orders per month' },
    xAxis: { categories: ['Jan', 'Feb', 'Mar', 'Apr', 'May', 'Jun'] },
    yAxis: { title: { text: 'Orders' } },
    series: [{ name: '2026', data: [32, 41, 38, 55, 62, 70] }]
  });

  // chart.update() changes an option on the live chart and redraws it
  document.getElementById('bar').addEventListener('click', (e) => {
    const btn = e.target.closest('button');
    if (!btn) return;
    chart.update({ chart: { type: btn.dataset.type } });
    document.querySelectorAll('#bar button').forEach((b) =>
      b.setAttribute('aria-pressed', String(b === btn)));
  });
</script>
</body>
</html>
You do not rebuild the chart or touch the data. Only one option changes.
The script order mistake
A script runs the moment the browser reaches it. If your code calls Highcharts.chart() before the library's script tag, Highcharts does not exist yet, and the console shows a ReferenceError.
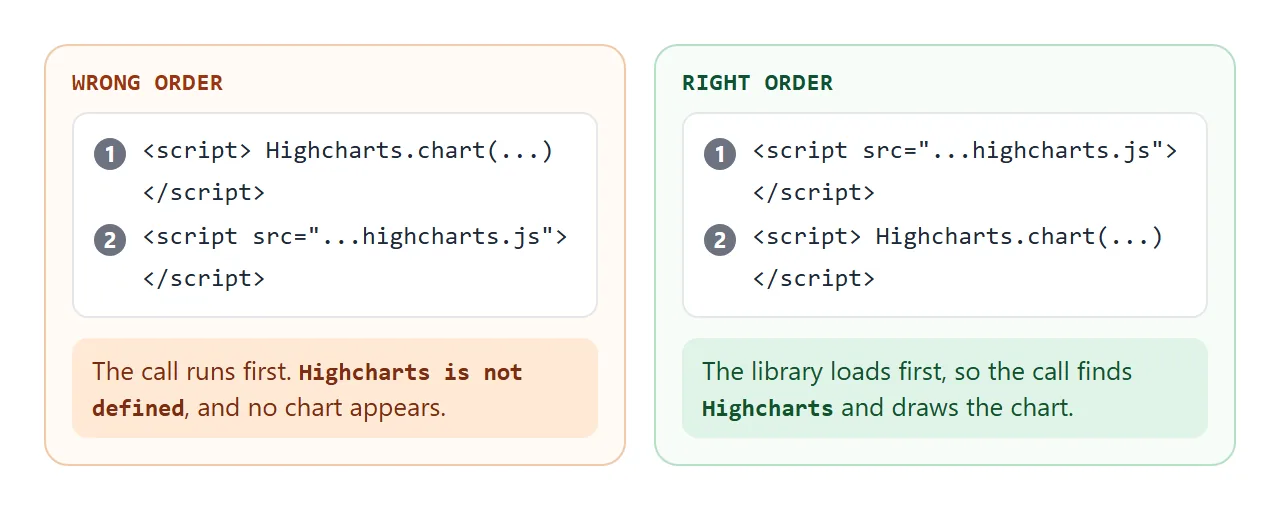
Put the library tag first, then your code. The code must also come after the container div, or sit inside a DOMContentLoaded listener the way the Highcharts docs do. Otherwise Highcharts cannot find the element and reports error 13, "Rendering div not found".
Load the library only once. Including it twice produces error 16, "Highcharts already defined in the page".
Give the container a height
A chart is drawn inside its container, and the height comes from the container too. When the option chart.height is left empty, Highcharts uses the container's height, or 400 pixels if that height is 0.
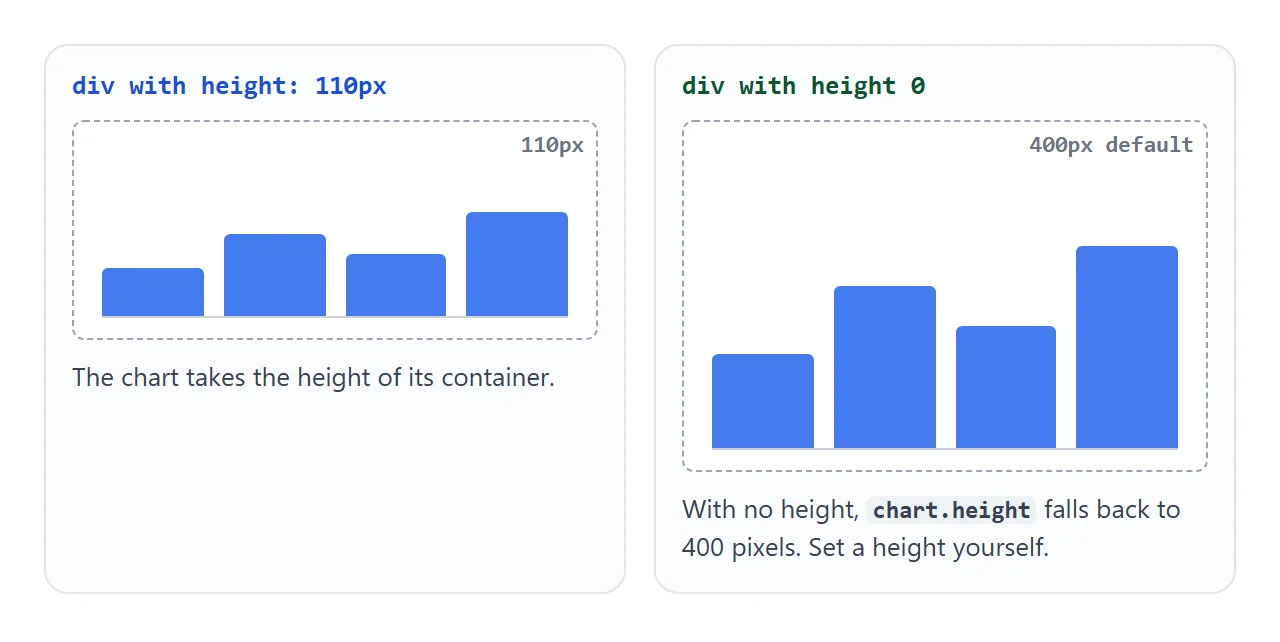
Set a height on the div, as the examples do with height: 320px. Then the chart is the size you chose on a laptop and on a phone.
Move the same options into Angular
This part needs Node, npm and an Angular build, so it does not run in a plain HTML file. It is shown here so you can see what carries over.
The Highcharts Angular README installs the wrapper and the library together:
npm install highcharts-angular highcharts --save
Then register it once in app.config.ts:
import { provideHighcharts } from 'highcharts-angular';

export const appConfig: ApplicationConfig = {
  providers: [provideHighcharts()],
};
In a component, the options object is bound to a div with the highchartsChart directive:
import { Component } from '@angular/core';
import { HighchartsChartDirective } from 'highcharts-angular';

@Component({
  template: '<div highchartsChart [options]="chartOptions" class="chart"></div>',
  styles: ['.chart { width: 100%; height: 400px; display: block; }'],
  imports: [HighchartsChartDirective],
})
export class AppComponent {
  chartOptions: Highcharts.Options = {
    series: [{ type: 'line', data: [1, 2, 3] }],
  };
}
Paste the options you tuned in the HTML file into chartOptions. The container still needs a width and a height in CSS, as in the styles line above.
According to the package metadata on npm, the current wrapper expects Angular 19 or newer and Highcharts 12.2 or newer.
A finished example: chart the numbers you paste
This page adds three things to the basics. A form takes label, number lines and redraws the chart on submit. The same numbers appear in a table under the chart. And a second script tag loads the Highcharts accessibility module.
<!doctype html>
<html lang="en">
<head>
<meta charset="utf-8">
<meta name="viewport" content="width=device-width, initial-scale=1">
<title>Chart from pasted numbers</title>
<style>
  body { margin: 0; padding: 12px; font-family: system-ui, sans-serif; background: #fff; color: #1d2330; }
  h1 { font-size: 18px; margin: 0 0 8px; }
  form { display: grid; gap: 8px; margin-bottom: 10px; }
  textarea {
    font: 14px/1.4 ui-monospace, Consolas, monospace; padding: 8px; height: 96px;
    border: 1px solid #c7ccd4; border-radius: 8px; resize: vertical;
  }
  button {
    font: inherit; padding: 8px 14px; border: 0; border-radius: 8px;
    background: #1d4ed8; color: #fff; cursor: pointer; justify-self: start;
  }
  #msg { font-size: 13px; color: #9a3412; min-height: 18px; }
  #chart { width: 100%; height: 280px; }
  table { border-collapse: collapse; width: 100%; font-size: 14px; margin-top: 8px; }
  th, td { border-bottom: 1px solid #e1e4ea; padding: 4px 8px; text-align: left; }
  td:last-child, th:last-child { text-align: right; }
</style>
</head>
<body>
<h1>Paste "label, number" lines</h1>
<form id="form">
  <textarea id="data" aria-label="Data, one label and number per line">Q1, 120
Q2, 150
Q3, 90
Q4, 210</textarea>
  <button type="submit">Draw chart</button>
  <div id="msg" role="status"></div>
</form>

<div id="chart"></div>
<table id="tbl"><thead><tr><th>Label</th><th>Value</th></tr></thead><tbody></tbody></table>

<script src="https://cdn.jsdelivr.net/npm/highcharts@13.1.1/highcharts.js"></script>
<script src="https://cdn.jsdelivr.net/npm/highcharts@13.1.1/modules/accessibility.js"></script>
<script>
  const msg = document.getElementById('msg');

  function parse(text) {
    const rows = [];
    for (const line of text.split('\n')) {
      if (!line.trim()) continue;
      const i = line.lastIndexOf(',');
      const value = Number(line.slice(i + 1));
      if (i < 1 || !Number.isFinite(value)) throw new Error('Bad line: "' + line.trim() + '"');
      rows.push([line.slice(0, i).trim(), value]);
    }
    if (!rows.length) throw new Error('Add at least one line.');
    return rows;
  }

  function draw(rows) {
    Highcharts.chart('chart', {
      chart: { type: 'column' },
      title: { text: 'Your numbers' },
      xAxis: { categories: rows.map((r) => r[0]) },
      yAxis: { title: { text: 'Value' } },
      legend: { enabled: false },
      series: [{ name: 'Value', data: rows.map((r) => r[1]) }]
    });
    // the same numbers as a table: readable without the chart and easy to copy
    document.querySelector('#tbl tbody').innerHTML = rows
      .map((r) => '<tr><td></td><td>' + r[1] + '</td></tr>').join('');
    document.querySelectorAll('#tbl tbody tr').forEach((tr, n) => {
      tr.firstChild.textContent = rows[n][0];  // textContent: table cells never parse pasted text as HTML
    });
  }

  document.getElementById('form').addEventListener('submit', (e) => {
    e.preventDefault();  // handled inside the page, nothing is sent anywhere
    try {
      draw(parse(document.getElementById('data').value));
      msg.textContent = '';
    } catch (err) {
      msg.textContent = err.message;
    }
  });

  draw(parse(document.getElementById('data').value));
</script>
</body>
</html>
- The form stays in the page. The submit listener calls
preventDefault(), reads the textarea and draws the chart. - A table sits under the chart. Anyone can read or copy the figures without hovering.
- The accessibility module is a separate file. The Highcharts docs say it is not included by default and recommend adding it.
For charts with no library at all, see a line chart in plain SVG and a bar chart from a table.
Licence and CDN: read before you publish
Highcharts may need a licence, depending on how you use it. The header of the library file says "A commercial license may be required depending on use" and points to the licence page on highcharts.com.
Check that page for your case before putting a chart on a public site.
The examples load the library from jsDelivr with a pinned version, 13.1.1. The Highcharts docs say a CDN suits demos, prototypes and simple static pages. For production they suggest npm or self-hosted files.
When it does not work
| Symptom | Cause | Fix |
|---|---|---|
| Blank area, console says Highcharts is not defined | The library tag is missing, blocked, or after your code | Put the highcharts.js tag first |
| Error 13, Rendering div not found | The id in the call matches no element, or the code runs before the div | Match the id, and place the script after the div |
| Error 16, Highcharts already defined | The library is included twice | Include it once |
| Chart is 400 pixels tall when you wanted less | The container has no height | Give the div an explicit height |
| Chart works in a file but not in Angular | The npm packages or provideHighcharts() are missing | Install both packages and register the provider |
| A button or module does nothing | Its script file is missing | Load the module file after highcharts.js |
| Nothing at all, no console message | JavaScript did not run | See JavaScript not working in HTML |
Share it as a link
A chart is better shown than described. A screenshot loses the hover labels and the buttons, and an attached .html file may open as plain code on a phone. Sharing an interactive chart covers what survives on a small screen.
To send the working version, paste the page into a NOS document and choose Create share link. HTML to link walks through it. The page renders as written and its scripts run, including the Highcharts file from jsDelivr.
The people you send it to can switch the chart type and paste numbers themselves. If you change the code later, the same link shows the new version.