The <meter> element draws a gauge for a value inside a known range: disk space used, a test score, battery level, password strength. You give it value, min and max.
Add low, high and optimum, and the browser colours the bar green, yellow or red depending on where the value sits.
<meter min="0" max="100" low="30" high="70" optimum="90" value="60"></meter>
Move the sliders below and watch the colour. The line underneath shows the attributes the browser is actually using.
<!doctype html>
<html lang="en">
<head>
<meta charset="utf-8">
<meta name="viewport" content="width=device-width, initial-scale=1">
<title>meter playground</title>
<style>
  body { margin: 0; padding: 16px; font-family: system-ui, sans-serif; background: #f4f5f7; color: #1d2330; }
  .panel { background: #fff; border-radius: 12px; padding: 16px; box-shadow: 0 4px 14px rgba(0, 0, 0, .08); }
  meter { width: 100%; height: 24px; }
  code { font: 13px ui-monospace, Consolas, monospace; background: #eef1f5; border-radius: 4px; padding: 2px 5px; word-break: break-all; }
  label { display: grid; grid-template-columns: 76px 1fr 34px; align-items: center; gap: 8px; margin: 8px 0; font-size: 14px; }
  input[type=range] { width: 100%; }
  output { font-weight: 700; text-align: right; }
  #region { margin: 10px 0 0; font-size: 14px; }
  #region b { padding: 2px 8px; border-radius: 6px; }
  .optimum b { background: #dcfce7; color: #166534; }
  .suboptimal b { background: #fef3c7; color: #92400e; }
  .bad b { background: #fee2e2; color: #991b1b; }
</style>
</head>
<body>
<div class="panel">
  <meter id="m" min="0" max="100" value="60" low="30" high="70" optimum="90"></meter>
  <p id="region"></p>
  <label>value <input type="range" id="value" min="0" max="100" value="60"><output></output></label>
  <label>low <input type="range" id="low" min="0" max="100" value="30"><output></output></label>
  <label>high <input type="range" id="high" min="0" max="100" value="70"><output></output></label>
  <label>optimum <input type="range" id="optimum" min="0" max="100" value="90"><output></output></label>
  <p><code id="code"></code></p>
</div>

<script>
  const m = document.getElementById('m');
  const names = ['value', 'low', 'high', 'optimum'];

  // Which region the value is in, the way Chromium decides it.
  function region(v, low, high, opt) {
    if (opt < low) return v <= low ? 'optimum' : v <= high ? 'suboptimal' : 'bad';
    if (opt > high) return v >= high ? 'optimum' : v >= low ? 'suboptimal' : 'bad';
    return v >= low && v <= high ? 'optimum' : 'suboptimal';
  }
  const words = { optimum: 'optimum (green)', suboptimal: 'suboptimal (yellow)', bad: 'even less good (red)' };

  function update() {
    names.forEach((n) => {
      const input = document.getElementById(n);
      m.setAttribute(n, input.value);
      input.nextElementSibling.textContent = input.value;
    });
    // read back from the element: the browser clamps low, high and optimum
    const r = region(m.value, m.low, m.high, m.optimum);
    const box = document.getElementById('region');
    box.className = r;
    box.innerHTML = 'Region: <b>' + words[r] + '</b>';
    document.getElementById('code').textContent =
      '<meter min="0" max="100" value="' + m.value + '" low="' + m.low +
      '" high="' + m.high + '" optimum="' + m.optimum + '">';
  }
  names.forEach((n) => document.getElementById(n).addEventListener('input', update));
  update();
</script>
</body>
</html>
The six attributes
| Attribute | Default | What it does |
|---|---|---|
value |
0 | The current reading. Clamped to the range |
min |
0 | Bottom of the range |
max |
1 | Top of the range |
low |
same as min |
Values below this are in the low region |
high |
same as max |
Values above this are in the high region |
optimum |
halfway between min and max |
Which region counts as good |
Note the default max of 1. <meter value="60"> on its own draws a full bar, because 60 is clamped down to 1. Always set max when your numbers are not fractions of 1.
The browser also clamps the other numbers. low and optimum are kept between min and max, and high is never allowed below low. Reading meter.value or meter.high in JavaScript returns the clamped number.
How the browser picks the colour
low and high cut the range into three regions. optimum does not draw anything. It only says which region is the good one.
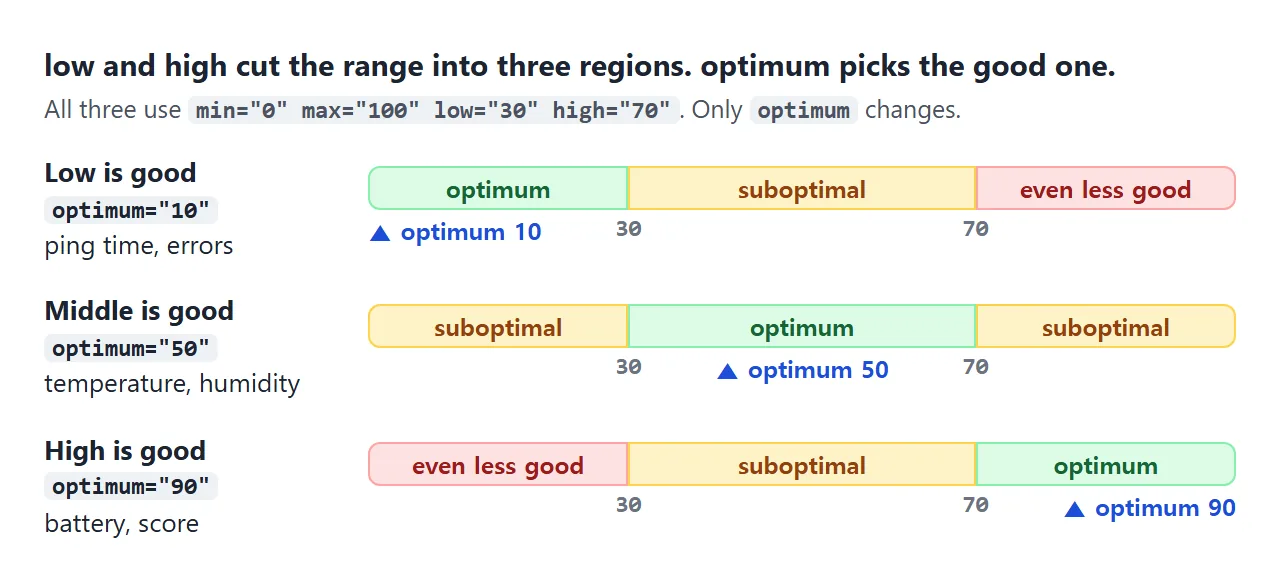
- optimum below
low(low is good, like response time): the low region is optimum, the middle is suboptimal, the high region is "even less good". - optimum between
lowandhigh(the middle is good, like room temperature): the middle is optimum and both ends are suboptimal. - optimum above
high(high is good, like battery): the high region is optimum and the low region is "even less good".
In Chrome, the three states show as green, yellow and red. Other browsers use their own shades, but the regions are the same.
This is why a meter with only value, min and max stays green. With no low or high, the whole range is one region, and every value lands in it.
meter vs progress
The two bars look alike, but they answer different questions. <progress> says how much of a task is done: a download, a step in a form. <meter> says what level something is at, and that level can go up or down.
<!doctype html>
<html lang="en">
<head>
<meta charset="utf-8">
<meta name="viewport" content="width=device-width, initial-scale=1">
<title>meter vs progress</title>
<style>
body { margin: 0; padding: 14px; font-family: system-ui, sans-serif; background: #f4f5f7; color: #1d2330; }
.grid { display: grid; grid-template-columns: repeat(auto-fit, minmax(240px, 1fr)); gap: 12px; }
.card { background: #fff; border-radius: 12px; padding: 14px; box-shadow: 0 4px 14px rgba(0, 0, 0, .08); }
h3 { margin: 0 0 4px; font: 700 15px ui-monospace, Consolas, monospace; }
.card p { margin: 6px 0; font-size: 13px; color: #4b5261; line-height: 1.45; }
meter, progress { width: 100%; height: 20px; }
.row { display: flex; gap: 8px; align-items: center; margin-top: 8px; font-size: 13px; }
button { font: inherit; padding: 6px 12px; border-radius: 8px; border: 1px solid #c9cdd4; background: #fff; cursor: pointer; }
</style>
</head>
<body>
<div class="grid">
<div class="card">
<h3><meter></h3>
<p>A level inside a known range. It can go up or down, and it never "finishes".</p>
<label for="disk">Disk used: <span id="diskText">64 of 128 GB</span></label>
<meter id="disk" min="0" max="128" low="80" high="110" optimum="20" value="64"></meter>
<div class="row">
<button id="less">− 16 GB</button>
<button id="more">+ 16 GB</button>
</div>
<p>Low use is good here (<code>optimum="20"</code>), so the bar turns yellow, then red, as the disk fills.</p>
</div>
<div class="card">
<h3><progress></h3>
<p>How much of a task is done. It moves one way and ends at 100%.</p>
<label for="up">Upload: <span id="upText">0%</span></label>
<progress id="up" max="100" value="0"></progress>
<div class="row"><button id="start">Start upload</button></div>
<p>No <code>value</code> at all means "working, amount unknown":</p>
<progress aria-label="Loading"></progress>
</div>
</div>
<script>
// meter: set the level directly, up or down
const disk = document.getElementById('disk');
function setDisk(gb) {
disk.value = gb; // values past min or max are clamped
document.getElementById('diskText').textContent = disk.value + ' of 128 GB';
}
document.getElementById('less').addEventListener('click', () => setDisk(disk.value - 16));
document.getElementById('more').addEventListener('click', () => setDisk(disk.value + 16));
// progress: count up to the end of a (pretend) task
const up = document.getElementById('up');
let timer;
document.getElementById('start').addEventListener('click', () => {
clearInterval(timer);
up.value = 0;
timer = setInterval(() => {
up.value += 5;
document.getElementById('upText').textContent = up.value === 100 ? 'Done' : up.value + '%';
if (up.value >= 100) clearInterval(timer);
}, 120);
});
</script>
</body>
</html>
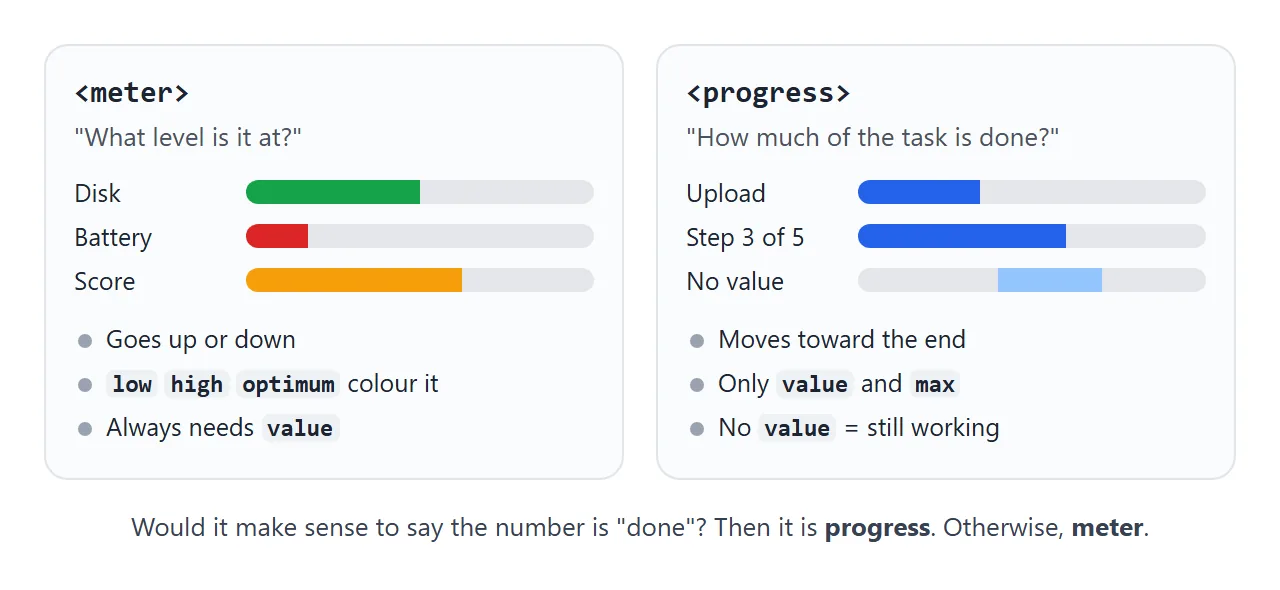
<progress> has only value and max, no colour regions. Leaving its value off makes it indeterminate, which a meter cannot do.
A loading bar built with <meter> tells assistive technology it is a measurement, not a task. For bars that track a task, see the HTML progress bar guide.
Labels and fallback text
A meter needs a name, the same as a form field. Use a <label for> pointing at the meter's id, or aria-label when there is no visible text. aria-label explains when each fits.
Text between the tags is fallback content:
<meter min="0" max="10" value="3">3 out of 10</meter>
Browsers that support <meter> do not display it. Show the number or a word next to the bar as normal text too. Colour alone does not tell everyone what the level means.
Styling a meter, and where it stops
width and height work as usual. Colour is the hard part. Setting background on the meter in Chrome paints behind the bar and switches it to a plainer built-in look. It does not recolour the bar.
To change the bar colours, style the browser's pseudo-elements:
meter { appearance: none; width: 100%; height: 10px; }

/* Chrome, Edge, Safari */
meter::-webkit-meter-bar { background: #e5e7eb; border: 0; border-radius: 5px; }
meter::-webkit-meter-optimum-value { background: #16a34a; }
meter::-webkit-meter-suboptimum-value { background: #f59e0b; }
meter::-webkit-meter-even-less-good-value { background: #dc2626; }

/* Firefox: the filled part */
meter::-moz-meter-bar { border-radius: 5px; }
These pseudo-elements are not in any standard, so check them in each browser you care about. If you need a gradient, labels inside the bar or a round dial, a <meter> will not get you there.
A finished example: password strength meter
This meter scores a password against five rules, from 0 to 5. With optimum="5", low="2.5" and high="4.5", scores 0 to 2 are red, 3 and 4 are yellow, and 5 is green. Nothing leaves the page.
<!doctype html>
<html lang="en">
<head>
<meta charset="utf-8">
<meta name="viewport" content="width=device-width, initial-scale=1">
<title>Password strength meter</title>
<style>
  body { margin: 0; padding: 16px; font-family: system-ui, sans-serif; background: #f4f5f7; color: #1d2330; }
  .panel { max-width: 420px; background: #fff; border-radius: 12px; padding: 18px; box-shadow: 0 4px 14px rgba(0, 0, 0, .08); }
  label { font-weight: 600; font-size: 14px; }
  input { display: block; box-sizing: border-box; width: 100%; margin: 6px 0 10px; padding: 10px 12px; font: 16px system-ui, sans-serif; border: 1px solid #c9cdd4; border-radius: 8px; }

  /* The meter: drop the native look, then colour each region */
  meter { appearance: none; display: block; width: 100%; height: 10px; }
  meter::-webkit-meter-bar { background: #e5e7eb; border: 0; border-radius: 5px; height: 10px; }
  meter::-webkit-meter-optimum-value { background: #16a34a; border-radius: 5px; }
  meter::-webkit-meter-suboptimum-value { background: #f59e0b; border-radius: 5px; }
  meter::-webkit-meter-even-less-good-value { background: #dc2626; border-radius: 5px; }
  meter::-moz-meter-bar { border-radius: 5px; }  /* Firefox: the filled part */

  #strength { margin: 8px 0 12px; font-size: 14px; font-weight: 600; min-height: 1.2em; }
  ul { margin: 0; padding: 0; list-style: none; font-size: 13px; }
  li { margin: 4px 0; color: #6b7280; }
  li::before { content: "\2717  "; color: #dc2626; }
  li.ok { color: #166534; }
  li.ok::before { content: "\2713  "; color: #16a34a; }
</style>
</head>
<body>
<div class="panel">
  <label for="pw">New password</label>
  <input id="pw" type="password" autocomplete="new-password" aria-describedby="strength">
  <!-- 5 rules = score 0-5. Below 2.5 is red, 2.5-4.5 yellow, 5 green. -->
  <meter id="bar" min="0" max="5" low="2.5" high="4.5" optimum="5" value="0" aria-label="Password strength"></meter>
  <p id="strength" aria-live="polite">Type a password</p>
  <ul id="rules">
    <li data-rule="len8">At least 8 characters</li>
    <li data-rule="len12">At least 12 characters</li>
    <li data-rule="cases">Upper and lower case letters</li>
    <li data-rule="digit">A number</li>
    <li data-rule="symbol">A symbol, such as ! or #</li>
  </ul>
</div>

<script>
  const tests = {
    len8: (p) => p.length >= 8,
    len12: (p) => p.length >= 12,
    cases: (p) => /[a-z]/.test(p) && /[A-Z]/.test(p),
    digit: (p) => /\d/.test(p),
    symbol: (p) => /[^A-Za-z0-9\s]/.test(p),
  };
  const labels = ['Very weak', 'Weak', 'Weak', 'Fair', 'Good', 'Strong'];
  const pw = document.getElementById('pw');
  const bar = document.getElementById('bar');
  const text = document.getElementById('strength');

  pw.addEventListener('input', () => {
    let score = 0;
    document.querySelectorAll('#rules li').forEach((li) => {
      const ok = tests[li.dataset.rule](pw.value);
      li.classList.toggle('ok', ok);
      if (ok) score++;
    });
    bar.value = score;
    // the words carry the meaning, not only the colour
    text.textContent = pw.value ? 'Strength: ' + labels[score] : 'Type a password';
  });
</script>
</body>
</html>
- The rules are small tests on the typed text: length, mixed case, a digit, a symbol.
- The score is the number of rules passed. It goes straight into
bar.value. - The words go in a paragraph with
aria-live="polite", so a screen reader announces "Strength: Good" as the user types. The input points at it witharia-describedby.
Rules like these are a rough guide for the person typing, not a security check. The server still decides what passwords it accepts. For the form side, see HTML form validation.
Building a custom gauge with role="meter"
When you want full control of the look, draw the gauge with two divs and give the outer one the meter role and its numbers.
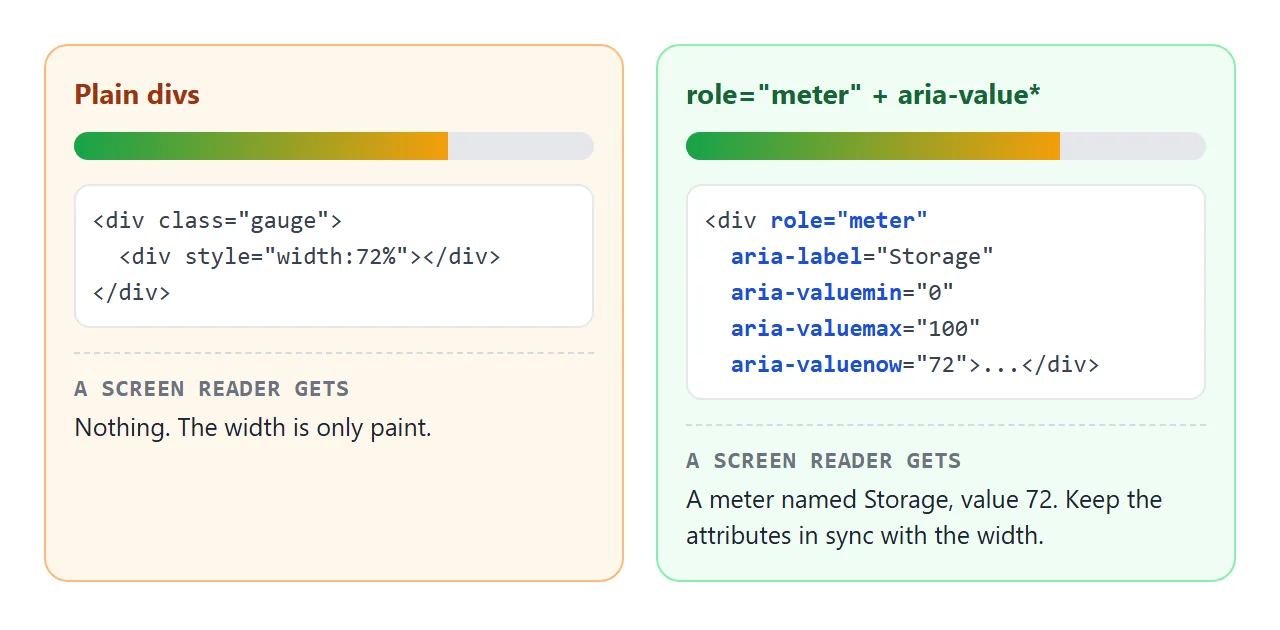
<div class="gauge" role="meter" aria-label="Storage"
     aria-valuemin="0" aria-valuemax="100" aria-valuenow="72">
  <div class="fill" style="width: 72%"></div>
</div>
When the value changes, update aria-valuenow and the width together. Add aria-valuetext when a word says it better than the number, such as aria-valuetext="72 of 100 GB". Without these attributes, a screen reader finds only an empty div.
When it does not work
| What you see | Cause | Fix |
|---|---|---|
| The colour never changes | No low and high, so the range is one region |
Add low and high, then set optimum in the good region |
| Green when it should be red | optimum is on the wrong side |
Put optimum below low if low is good, above high if high is good |
| The bar is always full | max left at its default of 1 |
Set max, for example max="100" |
| The value stops at the end | Values outside min and max are clamped |
Widen the range, or check the number you pass in |
background or color does not recolour the bar |
The bar is drawn by the browser | Use the ::-webkit-meter-* and ::-moz-meter-bar pseudo-elements |
| A loading bar says "meter" to a screen reader | <meter> used for task progress |
Use <progress> |
| A div gauge is silent to a screen reader | No role or values | Add role="meter", aria-valuenow, aria-valuemin, aria-valuemax and a label |
Share it as a link
A gauge is meant to move. A screenshot shows one colour at one value, and an .html attachment may open as plain code on a phone.
To send the working version, paste the page into a NOS document and choose Create share link. HTML to link walks through it. The page renders as written and its scripts run, so the people you send it to can type a password or drag the sliders themselves. If you change the code later, the same link shows the new version.