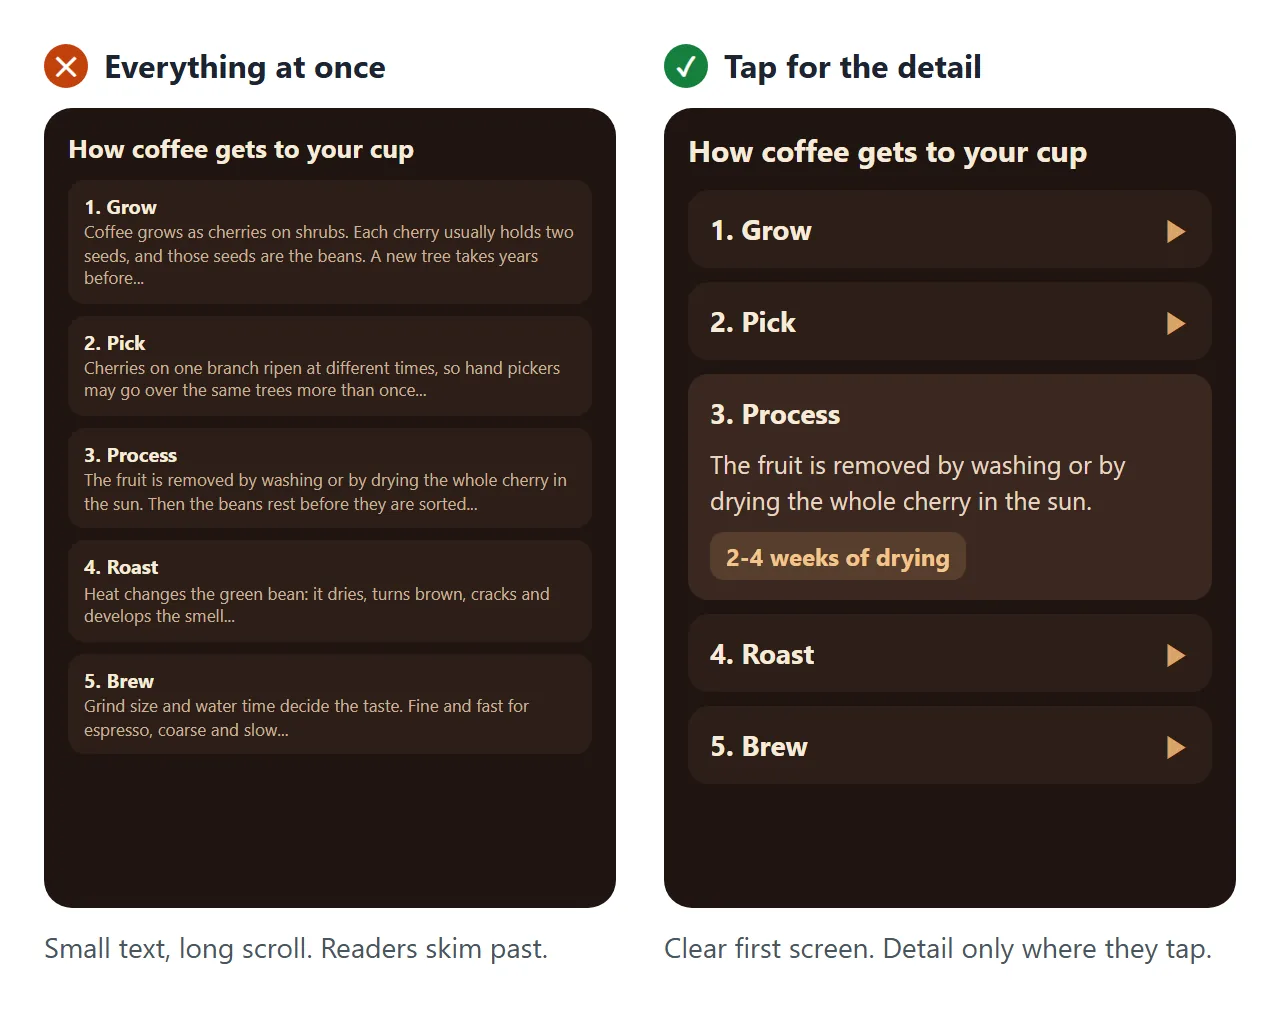
You make an infographic and it ends up crowded. Every number, every note, every step, all on one long image.
People scroll past it. The one figure they wanted is somewhere in the middle, in small type.
An interactive infographic splits that in two. The first screen shows the big picture. Readers tap the part they care about and the detail opens right there.
These days you do not need a design tool for that. People ask ChatGPT, Claude or Gemini for it and get a working page in one reply.
Here is one. Tap a step to open it.
<!doctype html>
<html lang="en">
<head>
<meta charset="utf-8">
<meta name="viewport" content="width=device-width, initial-scale=1">
<title>From farm to cup</title>
<style>
* { box-sizing: border-box; }
body { margin: 0; background: #1f1410; color: #f6ead9; font-family: system-ui, -apple-system, "Segoe UI", sans-serif; }
.page { max-width: 560px; margin: 0 auto; padding: 26px 18px 24px; }
.eyebrow { font-size: 12px; letter-spacing: .14em; color: #d9a46a; text-transform: uppercase; }
h1 { margin: 6px 0 4px; font-size: 27px; line-height: 1.15; }
.sub { margin: 0 0 18px; color: #c7b29b; font-size: 14.5px; }
.path { position: relative; padding-left: 26px; }
.path::before { content: ""; position: absolute; left: 10px; top: 10px; bottom: 10px; width: 3px; border-radius: 2px; background: linear-gradient(#7fb069, #d9a46a, #8b5a3c); }
.step { position: relative; margin-bottom: 10px; }
.step::before { content: ""; position: absolute; left: -22px; top: 20px; width: 13px; height: 13px; border-radius: 50%; background: #1f1410; border: 3px solid var(--c); transition: background .2s; }
.step.open::before { background: var(--c); }
.step button { width: 100%; display: flex; align-items: center; gap: 12px; padding: 12px 14px; border: 0; border-radius: 16px; background: #2c1e17; color: inherit; font: inherit; text-align: left; cursor: pointer; transition: background .2s; }
.step.open button { background: #3a2820; }
.step svg { width: 38px; height: 38px; flex: none; }
.step b { display: block; font-size: 16.5px; }
.step small { color: #c7b29b; font-size: 13px; }
.step .arrow { margin-left: auto; transition: transform .25s; color: #d9a46a; }
.step.open .arrow { transform: rotate(90deg); }
.detail { display: grid; grid-template-rows: 0fr; transition: grid-template-rows .3s ease; }
.step.open .detail { grid-template-rows: 1fr; }
.detail > div { overflow: hidden; }
.detail p { margin: 10px 14px 4px; font-size: 14.5px; line-height: 1.55; color: #e6d6c2; }
.fig { display: inline-flex; align-items: baseline; gap: 6px; margin: 4px 14px 12px; padding: 6px 12px; border-radius: 10px; background: rgba(217, 164, 106, .15); color: #f2c48d; font-size: 13px; }
.fig b { font-size: 20px; }
.src { margin-top: 16px; font-size: 12px; color: #9c8670; }
</style>
</head>
<body>
<main class="page">
<div class="eyebrow">Interactive infographic</div>
<h1>How coffee gets from the farm to your cup</h1>
<p class="sub">Tap a step to open it.</p>
<div class="path" id="path"></div>
<p class="src">Figures are illustrative examples for this template. Replace them with numbers from your own source.</p>
</main>
<script>
const STEPS = [
{ c: '#7fb069', t: 'Grow', s: 'Coffee cherries on the tree', fig: ['3-4', 'years before a new tree fruits'], p: 'Coffee grows as cherries on shrubs. Each cherry usually holds two seeds, and those seeds are the beans.',
icon: '<circle cx="19" cy="19" r="19" fill="#2f4a26"/><circle cx="14" cy="21" r="6" fill="#c0392b"/><circle cx="24" cy="18" r="6" fill="#e74c3c"/><path d="M19 6 q6 4 2 10" stroke="#7fb069" stroke-width="2.5" fill="none"/>' },
{ c: '#a3b86c', t: 'Pick', s: 'Ripe cherries by hand or machine', fig: ['Several', 'passes over the same trees'], p: 'Cherries on one branch ripen at different times, so hand pickers may go over the same trees more than once.',
icon: '<circle cx="19" cy="19" r="19" fill="#3d4a24"/><path d="M11 24 q8 -14 16 0 z" fill="#d9a46a"/><circle cx="19" cy="15" r="4" fill="#e74c3c"/>' },
{ c: '#d9a46a', t: 'Process', s: 'Remove the fruit, dry the beans', fig: ['2-4', 'weeks of drying for natural process'], p: 'The fruit is removed by washing or by drying the whole cherry in the sun. Then the beans rest before they are sorted and bagged.',
icon: '<circle cx="19" cy="19" r="19" fill="#4a3620"/><circle cx="19" cy="19" r="8" fill="#f2c48d"/><path d="M19 6v4M19 28v4M6 19h4M28 19h4" stroke="#f2c48d" stroke-width="2.5"/>' },
{ c: '#b0703f', t: 'Roast', s: 'Green beans turn brown', fig: ['10-16', 'minutes in a typical roast'], p: 'Heat changes the green bean: it dries, turns brown, cracks and develops the smell people think of as coffee.',
icon: '<circle cx="19" cy="19" r="19" fill="#4a2a1a"/><ellipse cx="19" cy="19" rx="7" ry="10" fill="#8b5a3c" transform="rotate(30 19 19)"/><path d="M15 12 q6 7 0 14" stroke="#3a1f12" stroke-width="2" fill="none" transform="rotate(30 19 19)"/>' },
{ c: '#8b5a3c', t: 'Brew', s: 'Grind, add water, wait', fig: ['4', 'minutes for a classic French press'], p: 'Grind size and water time decide the taste. Fine and fast for espresso, coarse and slow for a French press.',
icon: '<circle cx="19" cy="19" r="19" fill="#3a2117"/><path d="M11 15 h14 v8 a7 7 0 0 1 -14 0 z" fill="#f6ead9"/><path d="M25 17 q5 0 5 4 t-5 4" stroke="#f6ead9" stroke-width="2.5" fill="none"/>' },
];
const path = document.getElementById('path');
STEPS.forEach((st, i) => {
const el = document.createElement('div');
el.className = 'step'; el.style.setProperty('--c', st.c);
el.innerHTML = '<button aria-expanded="false"><svg viewBox="0 0 38 38" aria-hidden="true">' + st.icon + '</svg><span><b>' + (i + 1) + '. ' + st.t + '</b><small>' + st.s + '</small></span><span class="arrow">▶</span></button>' +
'<div class="detail"><div><p>' + st.p + '</p><span class="fig"><b>' + st.fig[0] + '</b>' + st.fig[1] + '</span></div></div>';
el.querySelector('button').onclick = () => {
const was = el.classList.contains('open');
path.querySelectorAll('.step').forEach((s) => { s.classList.remove('open'); s.querySelector('button').setAttribute('aria-expanded', 'false'); });
if (!was) { el.classList.add('open'); el.querySelector('button').setAttribute('aria-expanded', 'true'); }
};
path.append(el);
});
path.querySelector('.step button').click();
</script>
</body>
</html>
Three things that make it readable
1. One question per infographic. "How does coffee get to my cup?" is one question. Add prices, health effects and brewing tips, and it becomes a wall again. Write the question at the top and cut anything that does not answer it.
2. Big picture first, detail on tap. The first screen should make sense with no taps at all: a title, five labels, a few large numbers. The explanation sits behind each tap for the people who want it.
3. Every number shows where it came from. A small source line under the chart is what makes people trust it. It also stops you from sharing a figure the AI made up.
Make it with AI
Open ChatGPT, Claude or Gemini and paste this. Change the words in capitals and paste your own facts at the end.
Make one complete HTML file: an interactive infographic.
Question it answers: YOUR QUESTION
Layout: a title, then STEPS OR CATEGORIES as large
tappable cards. Tapping a card opens a short
explanation and one key number. Only one open at a
time. Add a small "Source:" line at the bottom.
Rules: works on a phone, large text, all CSS and
JavaScript inside the file, no images from other
sites, draw any icons with SVG.
Use only the numbers I give you. Do not round them
and do not add any. If a number is missing, write TODO.
Facts and numbers: PASTE THEM HERE
"Do not round them and do not add any" matters most. An AI fills gaps with numbers that look plausible, and a wrong number in a nice chart is still wrong.
Infographics are not only for explaining a process. Here the same prompt is used for a small business's year in numbers, with a bar chart you can tap month by month.
<!doctype html>
<html lang="en">
<head>
<meta charset="utf-8">
<meta name="viewport" content="width=device-width, initial-scale=1">
<title>Little Fern Cafe - our year in numbers</title>
<style>
  * { box-sizing: border-box; }
  body { margin: 0; background: #f4f7f2; color: #1e3326; font-family: system-ui, -apple-system, "Segoe UI", sans-serif; }
  .page { max-width: 620px; margin: 0 auto; padding: 24px 18px 26px; }
  .eyebrow { font-size: 12px; letter-spacing: .14em; text-transform: uppercase; color: #3f8a5c; font-weight: 700; }
  h1 { margin: 4px 0 16px; font-size: 26px; }
  .tiles { display: grid; grid-template-columns: repeat(2, 1fr); gap: 10px; }
  .tile { padding: 14px; border-radius: 18px; background: #fff; box-shadow: 0 6px 16px rgba(30, 51, 38, .07); }
  .tile .n { font-size: 30px; font-weight: 800; font-variant-numeric: tabular-nums; color: #1e3326; }
  .tile .l { font-size: 13px; color: #5d7466; }
  .tile.hl { background: #1e3326; color: #fff; }
  .tile.hl .n { color: #b8f0c8; }
  .tile.hl .l { color: #b9cfc0; }
  .chart { margin-top: 14px; padding: 16px 14px 12px; border-radius: 18px; background: #fff; box-shadow: 0 6px 16px rgba(30, 51, 38, .07); }
  .chart h2 { margin: 0 0 12px; font-size: 15px; }
  .bars { display: flex; align-items: flex-end; gap: 6px; height: 150px; }
  .bars button { flex: 1; height: 0; border: 0; border-radius: 7px 7px 3px 3px; background: #b8dcc4; cursor: pointer; transition: height .8s cubic-bezier(.2, .8, .2, 1), background .2s; padding: 0; }
  .bars button.on { background: #3f8a5c; }
  .months { display: flex; gap: 6px; margin-top: 6px; }
  .months span { flex: 1; text-align: center; font-size: 11px; color: #5d7466; }
  .info { margin-top: 12px; padding: 12px; border-radius: 12px; background: #eef6f0; font-size: 14.5px; line-height: 1.5; min-height: 66px; }
  .info b { font-size: 16px; }
  .src { margin-top: 12px; font-size: 12px; color: #7d9286; }
</style>
</head>
<body>
<main class="page">
  <div class="eyebrow">Little Fern Cafe</div>
  <h1>Our year in numbers</h1>

  <div class="tiles">
    <div class="tile hl"><div class="n">41,280</div><div class="l">cups poured</div></div>
    <div class="tile"><div class="n">3,115</div><div class="l">loaves of banana bread</div></div>
    <div class="tile"><div class="n">212</div><div class="l">kg of beans from one farm</div></div>
    <div class="tile"><div class="n">18</div><div class="l">open-mic nights</div></div>
  </div>

  <div class="chart">
    <h2>Cups per month - tap a bar</h2>
    <div class="bars" id="bars"></div>
    <div class="months" id="months"></div>
    <div class="info" id="info"></div>
  </div>
  <p class="src">Source: our own till records. Sample figures for this template.</p>
</main>
<script>
  const MONTHS = [
    ['Jan', 2650, 'Quiet start. Soup season helped.'], ['Feb', 2810, 'Valentine’s pastry box sold out twice.'],
    ['Mar', 3120, 'New oat milk supplier.'], ['Apr', 3380, 'Patio opened on the 12th.'],
    ['May', 3720, 'Busiest Saturday of the year: 412 cups.'], ['Jun', 3905, 'Cold brew outsold hot coffee for the first time.'],
    ['Jul', 4010, 'Summer peak. Two extra staff on weekends.'], ['Aug', 3840, 'Closed one week for the floor.'],
    ['Sep', 3460, 'Back-to-school mornings.'], ['Oct', 3330, 'Pumpkin loaf returned.'],
    ['Nov', 3290, 'Started the open-mic nights again.'], ['Dec', 3745, 'Gift cards: our best December.'],
  ];
  const max = Math.max(...MONTHS.map((m) => m[1]));
  const bars = document.getElementById('bars'), months = document.getElementById('months'), info = document.getElementById('info');

  function pick(i) {
    bars.querySelectorAll('button').forEach((b, k) => b.classList.toggle('on', k === i));
    const [m, v, note] = MONTHS[i];
    info.innerHTML = '<b>' + m + ': ' + v.toLocaleString('en-US') + ' cups</b><br>' + note;
  }

  MONTHS.forEach(([m, v], i) => {
    const b = document.createElement('button');
    b.setAttribute('aria-label', m + ' ' + v + ' cups');
    b.onclick = () => pick(i);
    bars.append(b);
    const s = document.createElement('span'); s.textContent = m[0]; months.append(s);
    setTimeout(() => { b.style.height = (v / max * 100) + '%'; }, 120 + i * 50);
  });
  pick(6);

  // The count-up reads each number from the page itself, so editing the text changes it.
  document.querySelectorAll('.tile .n').forEach((el) => {
    const to = +el.textContent.replace(/[^0-9]/g, ''), t0 = performance.now(), dur = 1200;
    (function step(t) {
      const k = Math.min(1, (t - t0) / dur), e = 1 - Math.pow(1 - k, 3);
      el.textContent = Math.round(to * e).toLocaleString('en-US');
      if (k < 1) requestAnimationFrame(step);
    })(t0);
  });
</script>
</body>
</html>
Getting it in front of people
You have an infographic. The AI gave it to you as HTML code, though, and code is not something you can post or send as it is.
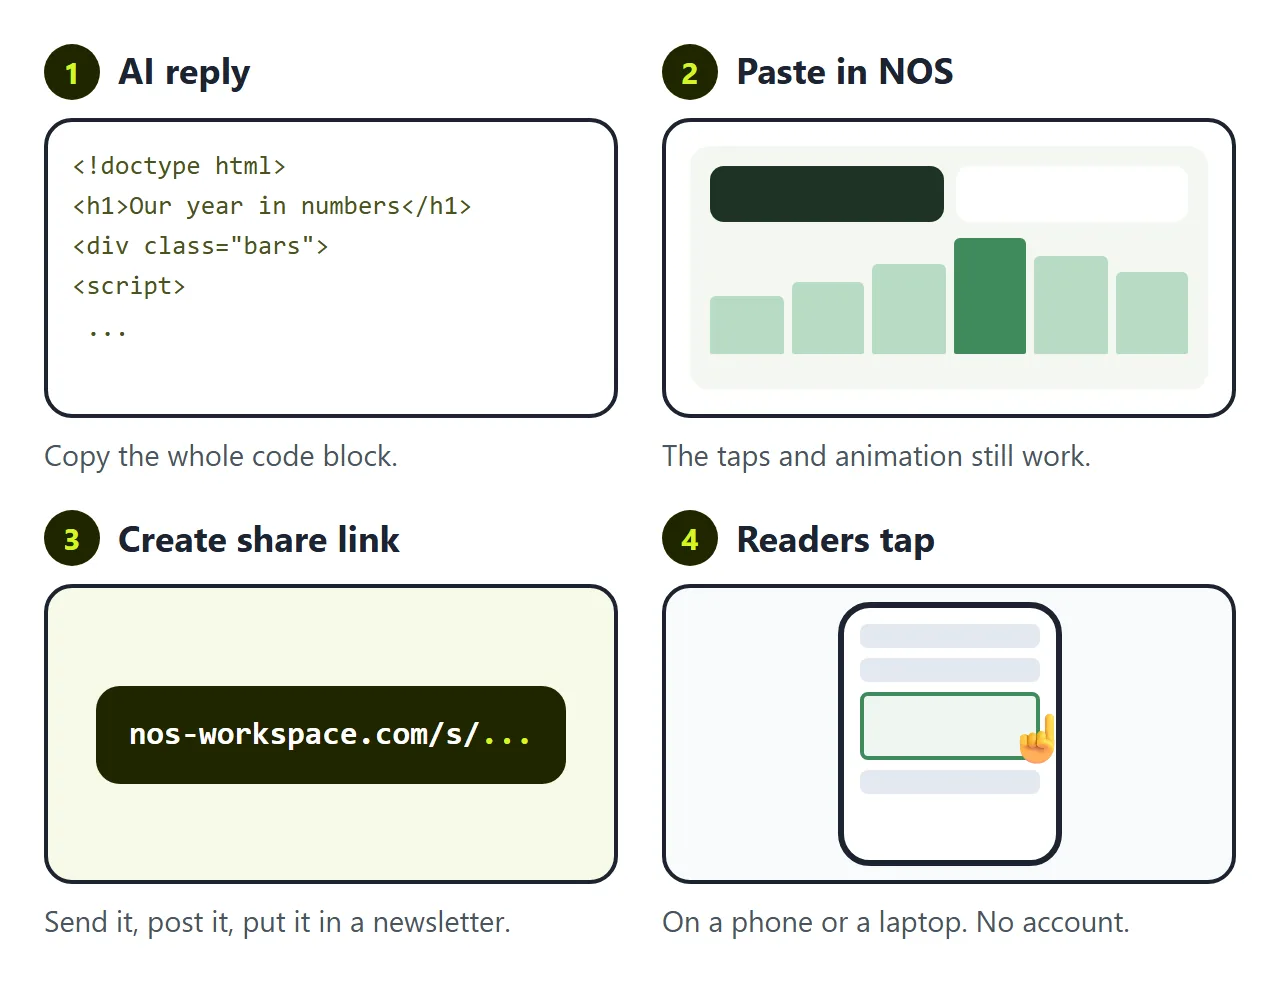
The first wall is sharing it without losing the taps. Screenshot it and the taps are gone. Export it to a PDF and the same thing happens. Send the file and some people see code, some download it and never open it. To keep it interactive, it has to be a page people open.
In NOS you paste the code into a document and it becomes the infographic straight away. Choose Create share link and send that link, or put it in a post or a newsletter. Share an interactive chart goes into more detail.
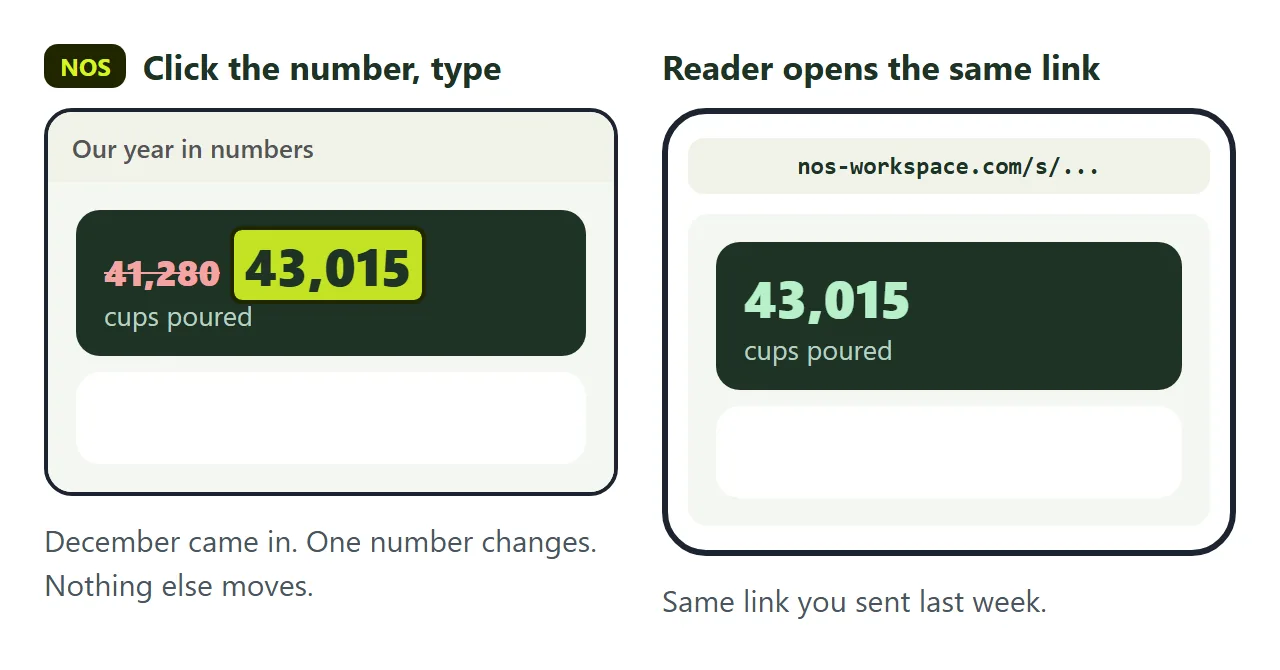
The second wall is the number that changes. December's figures come in. A total was off by one. Your manager asks for "visitors" to say "customers".
If you ask the AI again, you wait for a new reply. It often redraws the chart or changes wording you had checked, so you go through every number again. Then you have a new file and a new link to send, and people keep looking at the old one.
In NOS you click the number on the page and type the new one. The link does not change. Anyone who opens it now sees the new figure.
Numbers inside the chart's code, such as the height of each bar, live in the script. Change those in the code view, or ask the AI for just that line.
Before you share it
- Check every number against your source, one by one.
- Open it on a phone. Can you read the first screen without zooming?
- Tap everything once. Each card and bar should open the right detail.
- Keep the source line. It is the first thing a careful reader looks for.
For charts with more data, see Chart.js in HTML. For turning any chart into a link, see Chart to link.