nbconvert is the Jupyter tool that converts notebooks (.ipynb files) into other formats: HTML, PDF, Markdown, slides, Python scripts and more. For HTML it is one command:
jupyter nbconvert --to html sales.ipynb
That writes sales.html, named after the notebook. It is one file: the CSS sits in <style> tags, and plot images are written straight into the HTML. This is the shape of what you get, simplified:
<!doctype html>
<html lang="en">
<head>
<meta charset="utf-8">
<meta name="viewport" content="width=device-width, initial-scale=1">
<title>sales.html</title>
<style>
/* nbconvert puts its CSS inline in a <style> tag like this one */
body { margin: 0; padding: 16px; font-family: system-ui, sans-serif; color: #1f2937; background: #fff; }
.cell { display: grid; grid-template-columns: 64px 1fr; gap: 8px; margin: 0 0 12px; }
.prompt { font: 12px ui-monospace, Consolas, monospace; color: #6b7280; text-align: right; padding-top: 9px; }
.prompt.out { color: #c2410c; }
.input { background: #f5f5f5; border: 1px solid #e0e0e0; border-radius: 4px; padding: 8px 10px;
font: 13px/1.5 ui-monospace, Consolas, monospace; white-space: pre; overflow-x: auto; }
.kw { color: #008000; font-weight: 700; } .str { color: #ba2121; } .num { color: #666; }
.md h1 { font-size: 22px; margin: 4px 0 6px; } .md p { margin: 0; line-height: 1.5; }
.output { min-width: 0; }
.output img { display: block; max-width: 100%; }
table { border-collapse: collapse; font-size: 13px; }
td, th { padding: 4px 10px; border-bottom: 1px solid #e5e7eb; text-align: right; }
@media (max-width: 480px) { .cell { grid-template-columns: 1fr; gap: 2px; } .prompt { text-align: left; padding: 0; } }
</style>
</head>
<body>
<!-- Markdown cell: becomes ordinary HTML -->
<div class="cell"><div></div><div class="md">
<h1>Quarterly sales</h1>
<p>Four quarters, one chart. Every output below was stored in the notebook.</p>
</div></div>
<!-- Code cell: the input, highlighted -->
<div class="cell"><div class="prompt">In [1]:</div>
<div class="input"><span class="kw">import</span> pandas <span class="kw">as</span> pd
df = pd.DataFrame({<span class="str">"q"</span>: [<span class="str">"Q1"</span>, <span class="str">"Q2"</span>, <span class="str">"Q3"</span>, <span class="str">"Q4"</span>],
<span class="str">"sales"</span>: [<span class="num">30</span>, <span class="num">55</span>, <span class="num">42</span>, <span class="num">70</span>]})
df.plot.bar(x=<span class="str">"q"</span>, y=<span class="str">"sales"</span>)</div></div>
<!-- The plot: a PNG written straight into the file as a data: URI -->
<div class="cell"><div class="prompt out">Out[1]:</div>
<div class="output"><img alt="Bar chart of sales" width="160" height="80" src="data:image/png;base64,iVBORw0KGgoAAAANSUhEUgAAAKAAAABQCAIAAAARP+ljAAAA3UlEQVR42u3dQQ3AIBREQcxUGbZ6QwDCENFWA2kgbOaF+092BFAeRVdMAFiABVhfVx2/PMCAAQMWYAEWYMCAAQMGDBiwAAuwAAMGDDgYeP0QgAEDBgwYMGDAgAEDBgwYMGDAgAEDBgwYMGDAk0Ok3gIMGDBgwIABAwYMGDBgwIABAwYMGDDgE4GNDtjogAEDdguwW4ABAwZsdMBGB2x0wG4BdguwW4ABGx2w0QEbHbBbgN0C7BZgwIABGx2w0QEbHbBbgN0C7BZgwEbPAL5b94Kfj7HCAwxYgAVYe3oBgFRa+YFa6PgAAAAASUVORK5CYII="></div></div>
<div class="cell"><div class="prompt">In [2]:</div><div class="input">df</div></div>
<div class="cell"><div class="prompt out">Out[2]:</div>
<div class="output"><table>
<tr><th></th><th>q</th><th>sales</th></tr>
<tr><th>0</th><td>Q1</td><td>30</td></tr><tr><th>1</th><td>Q2</td><td>55</td></tr>
<tr><th>2</th><td>Q3</td><td>42</td></tr><tr><th>3</th><td>Q4</td><td>70</td></tr>
</table></div></div>
</body>
</html>
Install and run it
nbconvert is a Python package. Install it with pip or conda:
pip install nbconvert
# or
conda install nbconvert
The current release on PyPI is 7.17.1, and it needs Python 3.9 or newer. If the jupyter command is not found, run the same thing through Python:
python -m nbconvert --to html sales.ipynb
HTML export needs nothing else. The docs list Pandoc only for converting Markdown to formats other than HTML, and Playwright only for --to webpdf.
JupyterLab's File menu can export to HTML too. Its docs say the export uses nbconvert, and a dialog asks whether to sanitize the HTML output.
What ends up inside the HTML file
The default lab template puts almost everything into the one file. A few scripts come from public CDNs when the page opens.
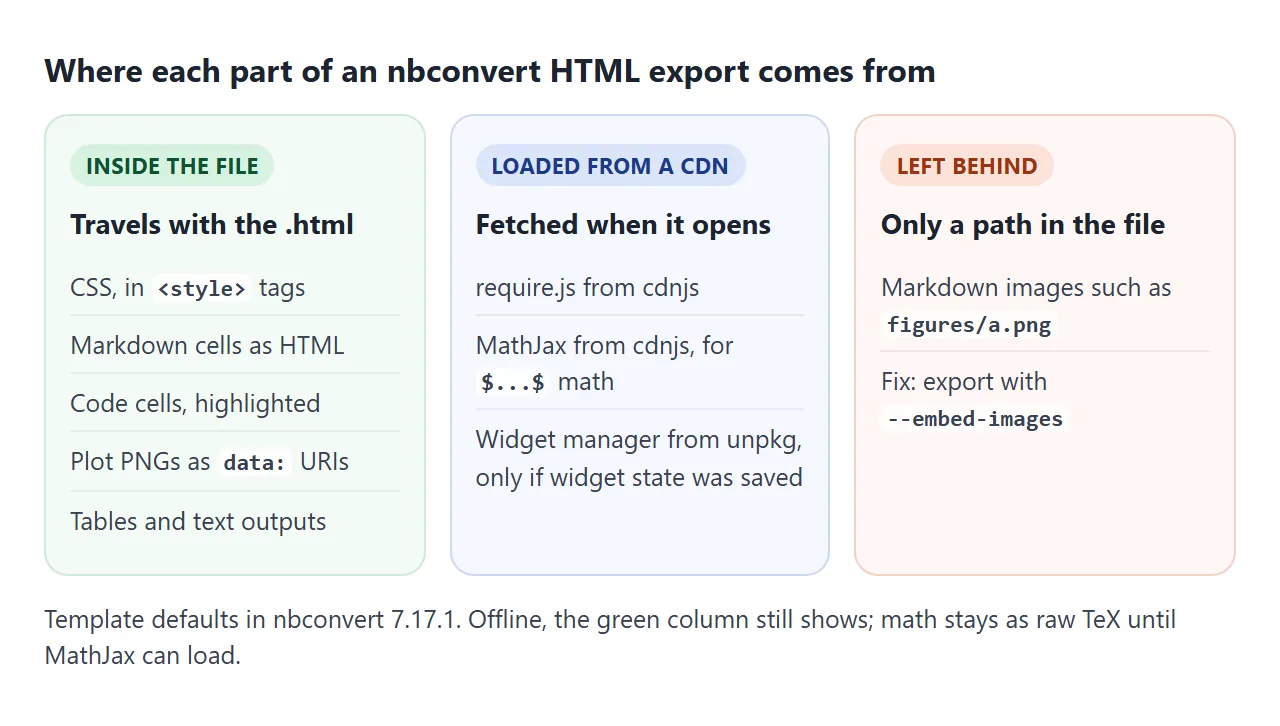
- Inside: CSS, Markdown cells, highlighted code, tables, text output, and plot images as base64
data:URIs. See data URIs for how that works. - From cdnjs: require.js, and MathJax for
$...$math. - From unpkg: the Jupyter widgets manager, only when the notebook saved widget state.
Without a connection, the page still shows text, code, tables and charts. Math stays as raw TeX until MathJax can load. For a page that needs nothing outside, see self-contained HTML files.
Run the cells first, or add --execute
A notebook stores each cell's output next to its code. nbconvert writes what is stored. It does not run anything unless you ask it to.
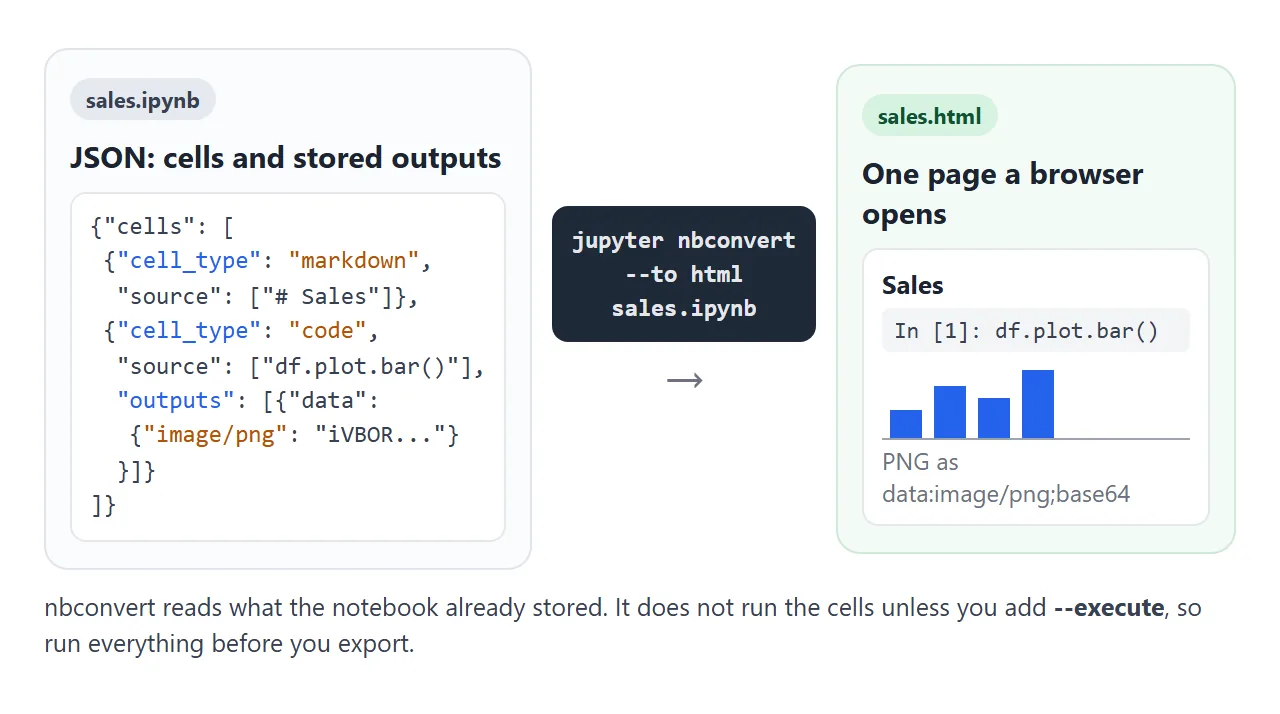
So a cell you edited but never re-ran exports with its old output. Either restart the kernel and run all cells before exporting, or let nbconvert run them:
jupyter nbconvert --to html --execute sales.ipynb
--execute stops the export at the first cell that raises an error. Add --allow-errors to keep going and print the error in that cell's output instead.
Images in Markdown cells: --embed-images
Plots that a code cell draws are stored inside the notebook, so they travel with the HTML. A picture you link in a Markdown cell is different. The notebook keeps only its path, and so does the HTML:

On your computer the file is next to the page, so it looks fine. Anyone else gets a broken image. Press the button to see both cases:
<!doctype html>
<html lang="en">
<head>
<meta charset="utf-8">
<meta name="viewport" content="width=device-width, initial-scale=1">
<title>Markdown images: path vs embedded</title>
<style>
  body { margin: 0; padding: 14px; font-family: system-ui, sans-serif; color: #1f2937; background: #f6f7f9; }
  .row { display: grid; grid-template-columns: 1fr 1fr; gap: 12px; }
  @media (max-width: 520px) { .row { grid-template-columns: 1fr; } }
  .pane { background: #fff; border: 1px solid #e1e4ea; border-radius: 10px; padding: 12px; font-size: 14px; }
  h2 { font-size: 15px; margin: 0 0 4px; }
  code { font: 12px ui-monospace, Consolas, monospace; background: #eef1f5; padding: 1px 4px; border-radius: 4px; word-break: break-all; }
  .frame { margin: 10px 0; min-height: 84px; border: 1px dashed #cbd2db; border-radius: 6px; display: grid; place-items: center; }
  .status { font-size: 13px; font-weight: 600; min-height: 1.4em; }
  .ok { color: #0f5132; } .bad { color: #9a3412; }
  button { font: inherit; padding: 8px 14px; border-radius: 8px; border: 0; background: #2563eb; color: #fff; margin-top: 12px; cursor: pointer; }
</style>
</head>
<body>
<div class="row">
  <div class="pane">
    <h2>Default export</h2>
    <div>The Markdown cell keeps the path: <code>src="figures/sales.png"</code></div>
    <!-- that file only exists on the computer that ran the notebook -->
    <div class="frame"><img alt="sales chart" src="figures/sales.png"></div>
    <div class="status" data-for="0"></div>
  </div>
  <div class="pane">
    <h2>With --embed-images</h2>
    <div>The picture travels inside the file: <code>src="data:image/png;base64,..."</code></div>
    <div class="frame"><img alt="sales chart" src="data:image/png;base64,iVBORw0KGgoAAAANSUhEUgAAAKAAAABQCAIAAAARP+ljAAAA3UlEQVR42u3dQQ3AIBREQcxUGbZ6QwDCENFWA2kgbOaF+092BFAeRVdMAFiABVhfVx2/PMCAAQMWYAEWYMCAAQMGDBiwAAuwAAMGDDgYeP0QgAEDBgwYMGDAgAEDBgwYMGDAgAEDBgwYMGDAk0Ok3gIMGDBgwIABAwYMGDBgwIABAwYMGDDgE4GNDtjogAEDdguwW4ABAwZsdMBGB2x0wG4BdguwW4ABGx2w0QEbHbBbgN0C7BZgwIABGx2w0QEbHbBbgN0C7BZgwEbPAL5b94Kfj7HCAwxYgAVYe3oBgFRa+YFa6PgAAAAASUVORK5CYII="></div>
    <div class="status" data-for="1"></div>
  </div>
</div>
<button id="check">Check both images</button>

<script>
  document.getElementById('check').addEventListener('click', () => {
    document.querySelectorAll('img').forEach((img, i) => {
      // an image that failed to load reports naturalWidth 0
      const loaded = img.complete && img.naturalWidth > 0;
      const out = document.querySelector('[data-for="' + i + '"]');
      out.textContent = loaded ? 'Loaded (' + img.naturalWidth + 'px wide)' : 'Broken: the file is not there';
      out.className = 'status ' + (loaded ? 'ok' : 'bad');
    });
  });
</script>
</body>
</html>
The fix is one flag. It writes Markdown images into the file as base64:
jupyter nbconvert --to html --embed-images sales.ipynb
Code in or out: --no-input and templates
The same notebook can become two documents. With the code, it is a record of the method. Without it, it reads as a report.
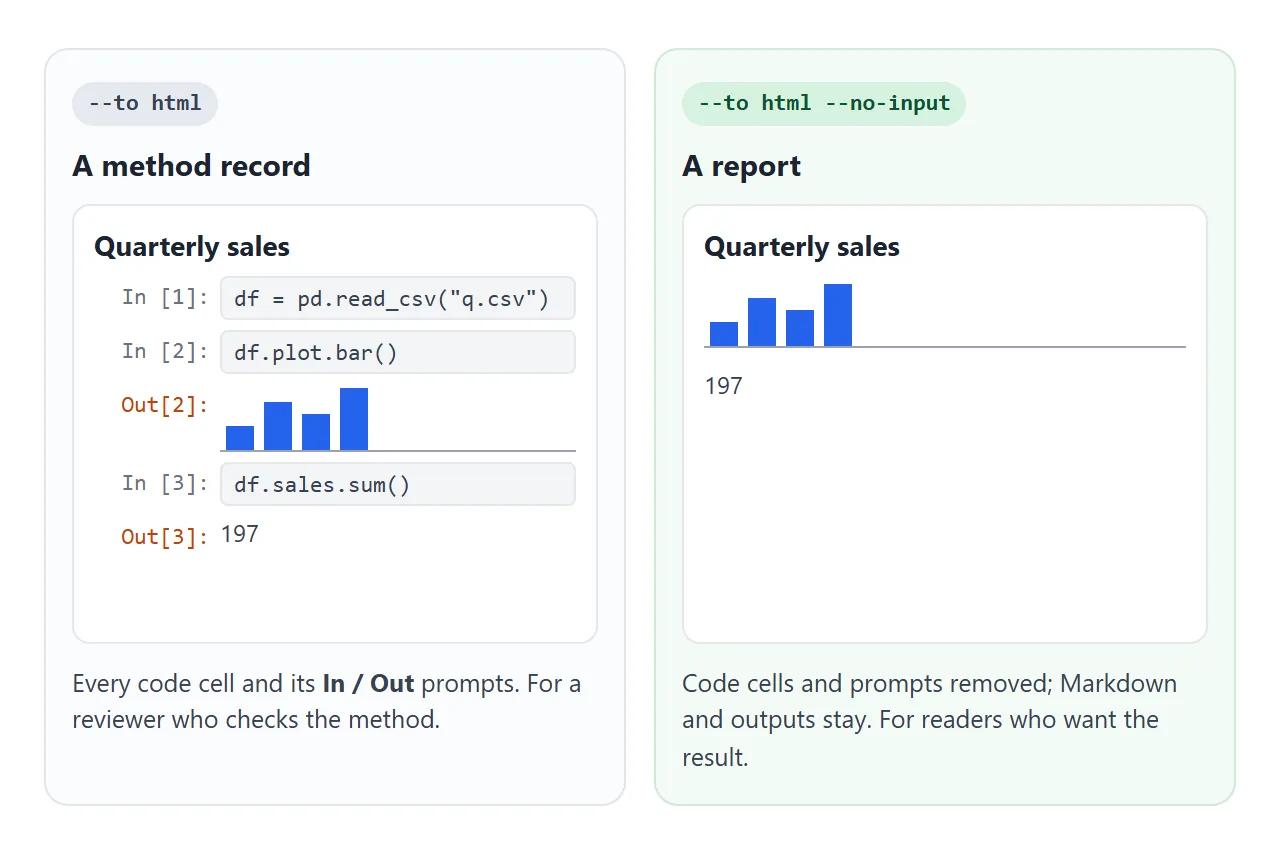
| Flag | What it does |
|---|---|
--no-input |
Removes code inputs and the In / Out prompts |
--no-prompt |
Removes the prompts, keeps the code |
--template lab |
Default. Looks like JupyterLab |
--template classic |
The older Jupyter Notebook look |
--template basic |
Minimal structure and styling |
--theme dark |
Dark theme for the lab template |
--output report |
Names the file report.html |
--stdout |
Prints the HTML instead of writing a file |
Flags combine. A clean report from a fresh run is:
jupyter nbconvert --to html --execute --no-input --embed-images sales.ipynb
A finished example: a report with math
This page is built like a --no-input export. The math uses MathJax 2.7.7 from cdnjs, the same library the nbconvert templates load. Tick the box to bring the code cells back.
<!doctype html>
<html lang="en">
<head>
<meta charset="utf-8">
<meta name="viewport" content="width=device-width, initial-scale=1">
<title>Growth report</title>
<style>
  body { margin: 0; padding: 16px; font-family: system-ui, sans-serif; color: #1f2937; background: #fff; line-height: 1.5; }
  h1 { font-size: 22px; margin: 0 0 4px; }
  .bar { display: flex; gap: 6px 14px; align-items: center; flex-wrap: wrap; font-size: 13px; color: #4b5563; margin-bottom: 12px; }
  label { display: flex; gap: 6px; align-items: center; cursor: pointer; }
  .input { background: #f5f5f5; border: 1px solid #e0e0e0; border-radius: 4px; padding: 8px 10px; margin: 8px 0;
           font: 13px/1.5 ui-monospace, Consolas, monospace; white-space: pre; overflow-x: auto; }
  body.no-input .input { display: none; }   /* what --no-input leaves out */
  img { display: block; max-width: 100%; margin: 6px 0; }
  table { border-collapse: collapse; font-size: 13px; margin: 6px 0; }
  td, th { padding: 4px 10px; border-bottom: 1px solid #e5e7eb; text-align: right; }
  #mj { font-weight: 600; }
</style>
<!-- MathJax 2.7.7 from cdnjs, the library nbconvert's HTML templates load for math -->
<script type="text/x-mathjax-config">
  MathJax.Hub.Config({ tex2jax: { inlineMath: [['$', '$'], ['\\(', '\\)']], processEscapes: true } });
</script>
<script src="https://cdnjs.cloudflare.com/ajax/libs/mathjax/2.7.7/MathJax.js?config=TeX-AMS_CHTML-full,Safe"></script>
</head>
<body class="no-input">
<div class="bar">
  <label><input type="checkbox" id="show"> Show code cells</label>
  <span>Math: <span id="mj">loading MathJax...</span></span>
</div>

<h1>Growth report, Q1 to Q4</h1>
<p>Quarter-on-quarter growth is $g_t = \frac{s_t - s_{t-1}}{s_{t-1}}$, and $\bar g$ is its average over the year.</p>

<div class="input">growth = df.sales.pct_change()
growth.mean()</div>
<p>$$\bar g = \frac{1}{3}\sum_{t=2}^{4} g_t \approx 0.42$$</p>

<div class="input">df.plot.bar(x="q", y="sales")</div>
<img alt="Bar chart of sales by quarter" width="160" height="80" src="data:image/png;base64,iVBORw0KGgoAAAANSUhEUgAAAKAAAABQCAIAAAARP+ljAAAA3UlEQVR42u3dQQ3AIBREQcxUGbZ6QwDCENFWA2kgbOaF+092BFAeRVdMAFiABVhfVx2/PMCAAQMWYAEWYMCAAQMGDBiwAAuwAAMGDDgYeP0QgAEDBgwYMGDAgAEDBgwYMGDAgAEDBgwYMGDAk0Ok3gIMGDBgwIABAwYMGDBgwIABAwYMGDDgE4GNDtjogAEDdguwW4ABAwZsdMBGB2x0wG4BdguwW4ABGx2w0QEbHbBbgN0C7BZgwIABGx2w0QEbHbBbgN0C7BZgwEbPAL5b94Kfj7HCAwxYgAVYe3oBgFRa+YFa6PgAAAAASUVORK5CYII=">

<div class="input">df.assign(growth=growth.round(2))</div>
<table>
  <tr><th>q</th><th>sales</th><th>growth</th></tr>
  <tr><td>Q1</td><td>30</td><td>NaN</td></tr><tr><td>Q2</td><td>55</td><td>0.83</td></tr>
  <tr><td>Q3</td><td>42</td><td>-0.24</td></tr><tr><td>Q4</td><td>70</td><td>0.67</td></tr>
</table>

<script>
  document.getElementById('show').addEventListener('change', (e) => {
    document.body.classList.toggle('no-input', !e.target.checked);
  });

  const mj = document.getElementById('mj');
  if (window.MathJax) {
    // queued after the first typeset, so it runs once the math is drawn
    MathJax.Hub.Queue(() => { mj.textContent = 'typeset by MathJax ' + MathJax.version; });
  } else {
    mj.textContent = 'MathJax did not load, so the raw $...$ text shows';
  }
</script>
</body>
</html>
- Math:
$...$inline and$$...$$on its own line, exactly as you wrote it in Markdown cells. - Chart: a PNG in a
data:URI, so no image file has to travel with the page. - Status line: shows whether MathJax loaded. Offline, the raw
$...$text stays.
From Python instead of the command line
The same export works as a library call, which helps when you build many reports in a loop. The docs show it with HTMLExporter:
from nbconvert import HTMLExporter
import nbformat

nb = nbformat.read("sales.ipynb", as_version=4)
body, resources = HTMLExporter(template_name="classic").from_notebook_node(nb)

with open("sales.html", "w", encoding="utf-8") as f:
    f.write(body)
body is the full HTML page as a string. resources holds extra data such as metadata.
When it does not work
| What you see | Cause | Fix |
|---|---|---|
jupyter: command not found |
nbconvert is not installed in this Python, or not on PATH | pip install nbconvert, or use python -m nbconvert |
| A chart does not match the code above it | Exports use stored outputs | Run all cells, or add --execute |
| Export stops at an error | --execute aborts on the first exception |
Fix the cell, or add --allow-errors |
| A Markdown image is broken for others | Only its path is in the file | --embed-images |
Math shows as $x^2$ |
MathJax could not load from cdnjs | Open the page with a connection |
| HTML output shows as escaped text | The export was sanitized | Export without sanitizing, for notebooks you trust |
| Widgets show nothing | No widget state was saved in the notebook | Save widget state, then export again |
--to webpdf fails |
Playwright is missing | pip install nbconvert[webpdf] |
Share it as a link
An exported notebook is meant to be read on any screen. An .html attachment may open as plain code, or not at all, on a phone; opening an HTML file on a phone covers why.
Sharing a Jupyter notebook as a link covers what to check before you publish.
To send the export, paste the HTML into a NOS document and choose Create share link. HTML to link walks through it.
The page renders as written and its scripts run, including MathJax from cdnjs, so readers see the typeset math and charts without an account. If you export again and paste the new HTML, the same link shows the new version.