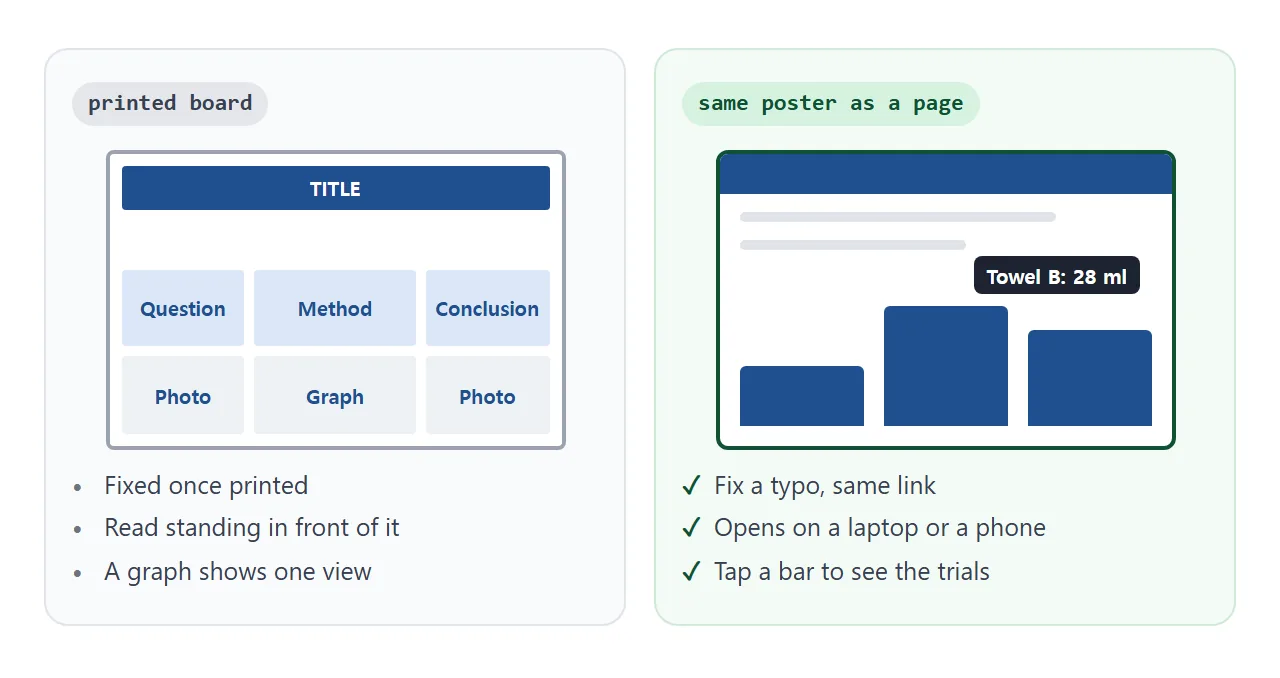
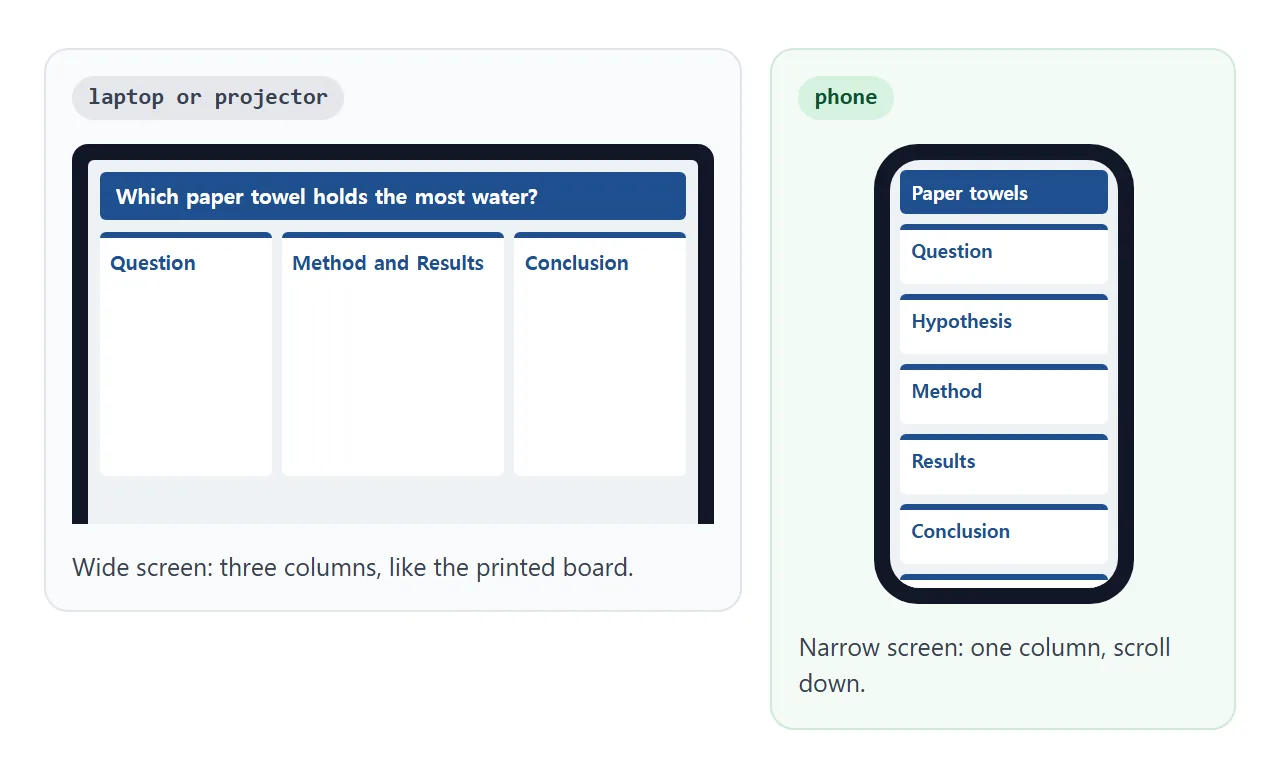
A science fair poster can also be one web page: the same sections as your board, in columns on a laptop and in one column on a phone. Those are question, hypothesis, method, results and conclusion.
Paste the page into NOS and create a share link. Anyone you send it to can open it without an account or a hosting site.
Try one first. This page uses a made-up project. On a wide window it shows three columns like a board. Tap a bar to see its trials, and use the A+ button to enlarge the text for a projector.
<!doctype html>
<html lang="en">
<head>
<meta charset="utf-8">
<meta name="viewport" content="width=device-width, initial-scale=1">
<title>Poster page: Which paper towel holds the most water?</title>
<style>
  * { box-sizing: border-box; }
  :root { --fs: 16px; }
  body { margin: 0; font-family: system-ui, sans-serif; font-size: var(--fs); line-height: 1.5; color: #1d2330; background: #eef1f5; }
  header { background: #1f4f8f; color: #fff; padding: 18px 20px 16px; }
  header h1 { margin: 0 0 4px; font-size: 1.6em; line-height: 1.2; }
  header p { margin: 0; font-size: .9em; opacity: .9; }
  .tools { display: flex; gap: 8px; align-items: center; margin-top: 10px; font-size: .8em; }
  .tools button { font: inherit; padding: 4px 10px; border: 1px solid #fff; border-radius: 6px; background: transparent; color: #fff; cursor: pointer; }
  .tools button:hover { background: rgba(255,255,255,.18); }
  main { display: grid; gap: 14px; padding: 14px; grid-template-columns: 1fr; }
  @media (min-width: 760px) { main { grid-template-columns: 1fr 1.3fr 1fr; } }
  section { background: #fff; border-radius: 10px; padding: 14px 16px; border-top: 4px solid #1f4f8f; }
  section h2 { margin: 0 0 6px; font-size: 1.05em; color: #1f4f8f; text-transform: uppercase; letter-spacing: .04em; }
  section p, section ul, section ol { margin: 0 0 8px; }
  ul, ol { padding-left: 1.2em; }
  .col { display: flex; flex-direction: column; gap: 14px; }
  .bar-row { cursor: pointer; }
  .bar-row:focus { outline: 2px solid #1f4f8f; }
  .note { font-size: .85em; color: #4b5563; min-height: 2.6em; }
  table { width: 100%; border-collapse: collapse; font-size: .85em; margin-top: 6px; }
  th, td { border: 1px solid #d9dde3; padding: 3px 6px; text-align: right; }
  th:first-child, td:first-child { text-align: left; }
  .toggle { font: inherit; font-size: .85em; padding: 4px 10px; border: 1px solid #1f4f8f; border-radius: 6px; background: #fff; color: #1f4f8f; cursor: pointer; }
  [hidden] { display: none; }
  footer { padding: 4px 16px 16px; font-size: .8em; color: #4b5563; }
</style>
</head>
<body>
<header>
  <h1>Which paper towel holds the most water?</h1>
  <p>Sample project by Nia Okafor, Grade 7, Riverside Middle School. The numbers are made up for this example.</p>
  <div class="tools">Text size:
    <button type="button" id="smaller" aria-label="Smaller text">A-</button>
    <button type="button" id="bigger" aria-label="Bigger text">A+</button>
  </div>
</header>

<main>
  <div class="col">
    <section>
      <h2>Question</h2>
      <p>Does the thickest paper towel always soak up the most water?</p>
    </section>
    <section>
      <h2>Hypothesis</h2>
      <p>If a towel is thicker, then it will hold more water, because it has more material to fill.</p>
    </section>
    <section>
      <h2>Materials</h2>
      <ul>
        <li>Three kinds of towel: A, B and C</li>
        <li>Measuring cup and a tray</li>
        <li>Timer</li>
      </ul>
    </section>
  </div>

  <div class="col">
    <section>
      <h2>Method</h2>
      <ol>
        <li>Weigh a dry sheet.</li>
        <li>Dip it in 100 ml of water for 10 seconds.</li>
        <li>Lift it for 5 seconds and measure what is left.</li>
        <li>Repeat 5 times per towel.</li>
      </ol>
    </section>
    <section>
      <h2>Results</h2>
      <p>Average water held per sheet, in ml. Tap a bar to see its 5 trials.</p>
      <svg id="chart" viewBox="0 0 320 150" width="100%" role="img" aria-label="Bar chart of average water held by towels A, B and C"></svg>
      <p class="note" id="note" aria-live="polite">Tap a bar.</p>
      <button type="button" class="toggle" id="toggle">Show all trials</button>
      <table id="trials" hidden></table>
    </section>
  </div>

  <div class="col">
    <section>
      <h2>Conclusion</h2>
      <p id="concl"></p>
    </section>
    <section>
      <h2>Next steps</h2>
      <ul>
        <li>Try warm water.</li>
        <li>Try 30 seconds in the water.</li>
      </ul>
    </section>
    <section>
      <h2>Thanks</h2>
      <p>Thank you to Ms. Lindqvist for lending the lab tray.</p>
    </section>
  </div>
</main>
<footer>Same sections as the printed board. Scroll, tap, or change the text size.</footer>

<script>
  // 1. The data: one list. Change the numbers and the chart and conclusion update.
  const towels = [
    { name: 'A', thickness: 'thin',   trials: [18, 20, 19, 21, 17] },
    { name: 'B', thickness: 'medium', trials: [27, 29, 26, 28, 30] },
    { name: 'C', thickness: 'thick',  trials: [24, 25, 23, 26, 24] }
  ];
  const avg = (a) => a.reduce((s, v) => s + v, 0) / a.length;
  towels.forEach((t) => { t.avg = avg(t.trials); });

  // 2. Draw the bars as SVG.
  const svg = document.getElementById('chart');
  const note = document.getElementById('note');
  const max = Math.max(...towels.map((t) => t.avg)) * 1.15;
  const NS = 'http://www.w3.org/2000/svg';
  function el(name, attrs, text) {
    const e = document.createElementNS(NS, name);
    for (const k in attrs) e.setAttribute(k, attrs[k]);
    if (text) e.textContent = text;
    return e;
  }
  towels.forEach((t, i) => {
    const h = (t.avg / max) * 110;
    const x = 30 + i * 95;
    const g = el('g', { class: 'bar-row', tabindex: '0', role: 'button', 'aria-label': 'Towel ' + t.name + ', ' + t.avg.toFixed(1) + ' ml' });
    g.appendChild(el('rect', { x, y: 120 - h, width: 60, height: h, rx: 4, fill: '#1f4f8f' }));
    g.appendChild(el('text', { x: x + 30, y: 114 - h, 'text-anchor': 'middle', 'font-size': 13, 'font-weight': 700, fill: '#1d2330' }, t.avg.toFixed(1)));
    g.appendChild(el('text', { x: x + 30, y: 138, 'text-anchor': 'middle', 'font-size': 12, fill: '#4b5563' }, 'Towel ' + t.name + ' (' + t.thickness + ')'));
    const show = () => { note.textContent = 'Towel ' + t.name + ' trials: ' + t.trials.join(', ') + ' ml.'; };
    g.addEventListener('click', show);
    g.addEventListener('keydown', (e) => { if (e.key === 'Enter' || e.key === ' ') { e.preventDefault(); show(); } });
    svg.appendChild(g);
  });
  svg.appendChild(el('line', { x1: 24, y1: 120, x2: 310, y2: 120, stroke: '#9ca3af' }));

  // 3. All trials in a table, hidden until asked for.
  const tbl = document.getElementById('trials');
  tbl.innerHTML = '<tr><th>Towel</th><th>1</th><th>2</th><th>3</th><th>4</th><th>5</th></tr>' +
    towels.map((t) => '<tr><td>' + t.name + '</td>' + t.trials.map((v) => '<td>' + v + '</td>').join('') + '</tr>').join('');
  const toggle = document.getElementById('toggle');
  toggle.addEventListener('click', () => {
    tbl.hidden = !tbl.hidden;
    toggle.textContent = tbl.hidden ? 'Show all trials' : 'Hide all trials';
  });

  // 4. Conclusion text from the data.
  const best = towels.reduce((a, b) => (b.avg > a.avg ? b : a));
  const thick = towels.find((t) => t.thickness === 'thick');
  document.getElementById('concl').textContent =
    'Towel ' + best.name + ' (' + best.thickness + ') held the most: ' + best.avg.toFixed(1) +
    ' ml. The thickest towel, ' + thick.name + ', held ' + thick.avg.toFixed(1) +
    ' ml. ' + (best === thick ? 'The hypothesis was supported.' : 'The hypothesis was not supported: thicker did not mean more water.');

  // 5. Text size for a projector or a small screen.
  let size = 16;
  const setSize = (n) => { size = Math.min(26, Math.max(12, n)); document.documentElement.style.setProperty('--fs', size + 'px'); };
  document.getElementById('bigger').addEventListener('click', () => setSize(size + 2));
  document.getElementById('smaller').addEventListener('click', () => setSize(size - 2));
</script>
</body>
</html>
The numbers sit in one list near the top of the script. Change them, and the bars, the table and the conclusion sentence all follow. That is the main advantage over a printed graph: you fix one place instead of redrawing.
Make it with AI
You do not have to write the page. Paste your own notes into ChatGPT, Claude or Gemini with this prompt.
Make one HTML page that works as a science fair poster. Header with
the title and my name. Sections: Question, Hypothesis, Materials,
Method, Results, Conclusion, Next steps. Three columns on a wide
screen, one column on a phone. Put my data in one JavaScript list
and draw the Results as a bar chart in SVG, with the average on each
bar. Add A+ and A- buttons for text size. No outside libraries,
images or fonts. Do not save anything.

My notes: [paste your question, method, data and conclusion]
Then check the result before you show it to anyone:
- Every number. Compare the chart and the table with your notes. An AI can round or change a value without telling you.
- The conclusion. It must say what your data showed, not what the AI guessed you wanted.
- Phone width. Make the browser window narrow. Text should wrap and the chart should stay inside the screen.
Send it as a link
- Copy all of the code the AI returned.
- Paste it into a NOS document. The page renders and its scripts run, so test the chart yourself.
- Choose Create share link and copy the address. HTML to link walks through it.
- Open it on the laptop you will present with, or send it to friends and family.
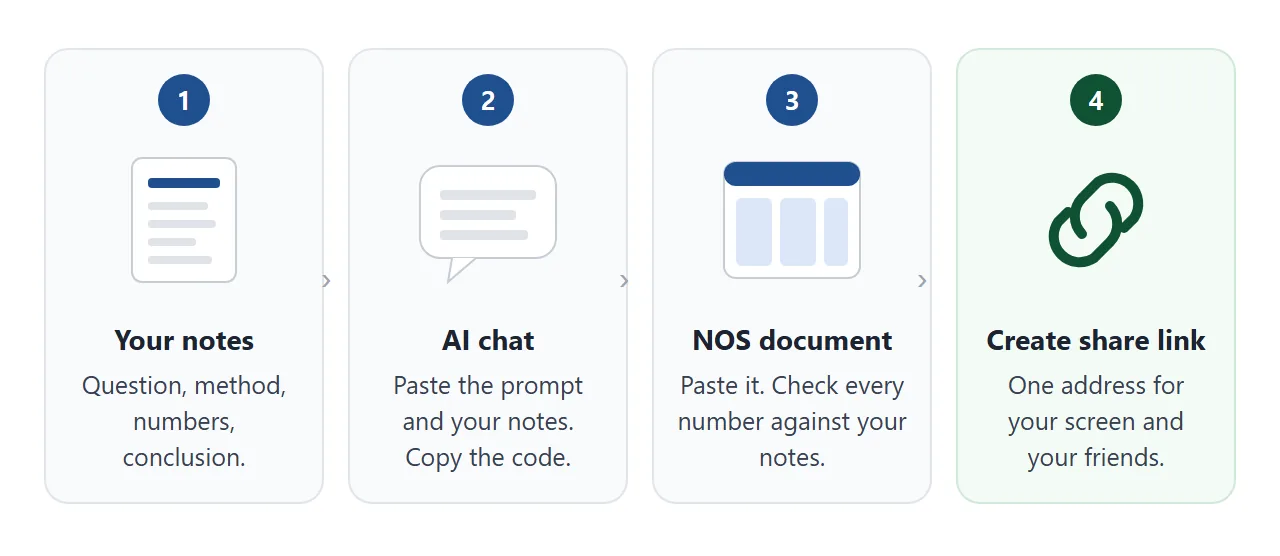
Anyone with the link can open the page in a browser, on a phone or a laptop, without an account. They cannot edit it. If you change the code later, the same link shows the new version.
If a phone shows a sent file as plain text instead of a page, see opening an HTML file on a phone.
If your teacher collects work in Google Classroom, Google's help says you can attach a link to an assignment. As of October 2026 the steps can differ by device, so check the current help page.
Check your fair's rules before you add a link
Fairs set their own rules for what may stand next to a board. Do this before you print an address or a QR code, or plan a screen.
The Display and Safety rules of the Regeneron International Science and Engineering Fair, as of October 2026, do not allow web addresses or QR codes of a project on the display.
They also do not allow active internet or email connections while displaying the project, unless approved in advance. Your school or regional fair may differ. Ask your teacher or the organisers, and keep the printed board complete without the page.
The page is still useful in those cases: send the link to family and friends before or after the fair, or open it from your own laptop when your fair allows a screen.
Ways to show a project compared
| Printed board | Slides file | Page with a link | |
|---|---|---|---|
| What people hold | Nothing, they read it | A file copy | An address |
| Fix a mistake later | Reprint | Send a new file | Edit once, same link |
| Opens on a phone | Not applicable | Depends on the phone and app | In the browser |
| Interactive chart | No | Depends on the program | Yes, the page runs scripts |
| Allowed at your fair | Check your fair's rules | Check your fair's rules | Check your fair's rules |
Keep the board for the room. Use the page for the people who were not there.
Present one section at a time
If you present on a screen, a scrolling page can be hard to follow from a distance. This variant shows one section per screen, with large text. Use the Next button, or the arrow keys on a keyboard.
<!doctype html>
<html lang="en">
<head>
<meta charset="utf-8">
<meta name="viewport" content="width=device-width, initial-scale=1">
<title>Present mode: one poster section at a time</title>
<style>
  * { box-sizing: border-box; }
  body { margin: 0; font-family: system-ui, sans-serif; background: #0f2a4d; color: #fff; }
  .stage { min-height: 470px; display: flex; flex-direction: column; padding: 16px 18px 14px; }
  .top { display: flex; justify-content: space-between; font-size: 13px; opacity: .8; }
  .slide { flex: 1; display: flex; flex-direction: column; justify-content: center; padding: 8px 4px; }
  .slide h2 { margin: 0 0 10px; font-size: clamp(14px, 3.4vw, 18px); text-transform: uppercase; letter-spacing: .08em; color: #8fc1ff; }
  .slide .big { margin: 0; font-size: clamp(22px, 5.4vw, 38px); line-height: 1.25; font-weight: 700; }
  .slide .sub { margin: 12px 0 0; font-size: clamp(15px, 3vw, 20px); opacity: .85; }
  .meter { display: flex; align-items: center; gap: 10px; margin: 10px 0; }
  .meter .lbl { width: 62px; font-size: 15px; }
  .meter .track { flex: 1; background: rgba(255,255,255,.15); border-radius: 6px; height: 22px; overflow: hidden; }
  .meter .fill { height: 100%; background: #8fc1ff; width: 0; transition: width .6s ease; }
  .meter .val { width: 58px; text-align: right; font-weight: 700; font-size: 15px; }
  .nav { display: flex; align-items: center; gap: 10px; }
  .nav button { font: inherit; font-size: 16px; padding: 10px 18px; border: 0; border-radius: 8px; background: #8fc1ff; color: #0f2a4d; font-weight: 700; cursor: pointer; }
  .nav button:disabled { opacity: .35; cursor: default; }
  .dots { flex: 1; display: flex; justify-content: center; gap: 7px; }
  .dots i { width: 10px; height: 10px; border-radius: 50%; background: rgba(255,255,255,.3); }
  .dots i.on { background: #fff; }
</style>
</head>
<body>
<div class="stage">
  <div class="top"><span>Which paper towel holds the most water?</span><span id="count"></span></div>
  <div class="slide" id="slide" aria-live="polite"></div>
  <div class="nav">
    <button type="button" id="prev">Back</button>
    <div class="dots" id="dots"></div>
    <button type="button" id="next">Next</button>
  </div>
</div>

<script>
  // One list: each item is one screen of the poster. Edit the text here.
  const averages = [['Towel A', 19.0], ['Towel B', 28.0], ['Towel C', 24.4]];
  const slides = [
    { h: 'Question', big: 'Does the thickest paper towel always soak up the most water?', sub: 'Sample project, Grade 7. The numbers are made up for this example.' },
    { h: 'Hypothesis', big: 'Thicker towel, more water held.', sub: 'There is more material to fill.' },
    { h: 'Method', big: 'Dip for 10 seconds. Lift for 5. Measure. Repeat 5 times.', sub: 'Three towels: A thin, B medium, C thick.' },
    { h: 'Results', bars: averages, sub: 'Average water held per sheet, in ml.' },
    { h: 'Conclusion', big: 'Not supported: the thickest towel was not the best.', sub: 'Next: warm water, and 30 seconds in the water.' }
  ];

  const slideEl = document.getElementById('slide');
  const dotsEl = document.getElementById('dots');
  const prev = document.getElementById('prev');
  const next = document.getElementById('next');
  const count = document.getElementById('count');
  let i = 0;

  slides.forEach(() => dotsEl.appendChild(document.createElement('i')));

  function show() {
    const s = slides[i];
    let html = '<h2>' + s.h + '</h2>';
    if (s.big) html += '<p class="big">' + s.big + '</p>';
    if (s.bars) {
      const top = Math.max(...s.bars.map((b) => b[1]));
      html += s.bars.map((b) =>
        '<div class="meter"><span class="lbl">' + b[0].replace('Towel ', '') + '</span>' +
        '<div class="track"><div class="fill" data-w="' + (b[1] / top * 100) + '"></div></div>' +
        '<span class="val">' + b[1].toFixed(1) + '</span></div>').join('');
    }
    if (s.sub) html += '<p class="sub">' + s.sub + '</p>';
    slideEl.innerHTML = html;
    // grow the bars after the screen is drawn
    requestAnimationFrame(() => requestAnimationFrame(() => {
      slideEl.querySelectorAll('.fill').forEach((f) => { f.style.width = f.dataset.w + '%'; });
    }));
    prev.disabled = i === 0;
    next.disabled = i === slides.length - 1;
    count.textContent = (i + 1) + ' / ' + slides.length;
    [...dotsEl.children].forEach((d, n) => d.classList.toggle('on', n === i));
  }
  const go = (n) => { i = Math.min(slides.length - 1, Math.max(0, n)); show(); };

  prev.addEventListener('click', () => go(i - 1));
  next.addEventListener('click', () => go(i + 1));
  document.addEventListener('keydown', (e) => {
    if (e.key === 'ArrowRight' || e.key === ' ') { e.preventDefault(); go(i + 1); }
    if (e.key === 'ArrowLeft') go(i - 1);
  });
  show();
</script>
</body>
</html>
To get this from an AI, change the prompt: "show one section at a time with Back and Next buttons, large text, and arrow key support." The numbers in this version are typed in again, so check that they match the poster page.
Looking for a page about you rather than one project? Student portfolio covers that. To build the chart by hand, see HTML bar chart.
When it does not work
| Symptom | Cause | Fix |
|---|---|---|
| Friends see code, not a page | The file was sent as an attachment and opened as text | Send the link, not the file |
| The chart is empty | A line was lost when you copied the code | Copy all of the AI's code again |
| A bar shows the wrong value | The AI changed a number in the data list | Fix the list and compare with your notes |
| Pictures or fonts are missing | They load from another site, which the page blocks | Ask for a version with no outside images or fonts |
| The columns do not stack on a phone | The page has no viewport line or no narrow layout | Ask the AI for a phone friendly layout |
| A judge cannot open it | Your fair may not allow links or internet | Ask the organisers, and keep the board complete |
For a longer look at sending a page an AI wrote, see share AI-generated HTML. For free places to host a school project, see web hosting for students.