A reliable SEO report template is one plain HTML page: a summary, a table of numbers with a notes column, what you did, and what comes next. You paste the numbers in yourself and send a link instead of a PDF.
One public post about exporting from an AI chat sums up the usual route: "save as pdf, layout shifts," and in the end a screenshot. A page skips the export. The table stays a table, on a laptop and on a phone.
<!doctype html>
<html lang="en">
<head>
<meta charset="utf-8">
<meta name="viewport" content="width=device-width, initial-scale=1">
<title>SEO report - September 2026</title>
<style>
* { box-sizing: border-box; }
body { margin: 0; padding: 18px 14px 28px; font-family: system-ui, sans-serif; color: #1d2330; background: #f3f5f7; line-height: 1.5; }
.page { max-width: 780px; margin: 0 auto; background: #fff; border: 1px solid #e1e4ea; border-radius: 12px; padding: 26px 26px 22px; }
h1 { font-size: 22px; margin: 0 0 4px; }
h2 { font-size: 16px; margin: 26px 0 8px; padding-bottom: 6px; border-bottom: 2px solid #0f766e; color: #0f4f4a; }
.meta { margin: 0; color: #4b5563; font-size: 14px; }
.asof { display: inline-block; margin-top: 10px; padding: 5px 10px; font-size: 13px; background: #fff8e6; border: 1px solid #f0dca0; border-radius: 6px; color: #6b4e00; }
ul, ol { margin: 0; padding-left: 20px; }
li { margin: 4px 0; }
table { width: 100%; border-collapse: collapse; font-size: 14px; }
th, td { text-align: left; padding: 8px 10px; border-bottom: 1px solid #e5e8ee; vertical-align: top; }
th { background: #f0f7f6; font-size: 13px; color: #0f4f4a; }
td.num, th.num { text-align: right; white-space: nowrap; }
.up { color: #0f5132; font-weight: 600; }
.gap { color: #8a5a00; font-style: italic; }
.note { color: #374151; }
.src { margin-top: 22px; padding-top: 10px; border-top: 1px solid #e5e8ee; font-size: 12.5px; color: #6b7280; }
tr, section { break-inside: avoid; }
@media (max-width: 560px) {
.page { padding: 18px 14px; }
table, thead, tbody, tr, th, td { display: block; }
thead { position: absolute; left: -9999px; }
tr { border: 1px solid #e1e4ea; border-radius: 8px; margin-bottom: 10px; padding: 6px 10px; }
td { border: 0; padding: 3px 0; text-align: left !important; white-space: normal !important; }
td[data-label]::before { content: attr(data-label) ": "; font-weight: 600; color: #0f4f4a; }
}
@media print {
body { background: #fff; padding: 0; }
.page { border: 0; padding: 0; max-width: none; }
}
</style>
</head>
<body>
<div class="page">
<h1>SEO report: Harbor & Pine Bakery</h1>
<p class="meta">September 2026 compared with August 2026 · Prepared by Dana Okafor (sample, fictional business)</p>
<span class="asof">Numbers as of 2 Oct 2026, pasted from Search Console. They do not update.</span>
<section>
<h2>1. Summary</h2>
<ul>
<li>Clicks from Google Search rose from 1,240 to 1,386 (+11.8%).</li>
<li>Average position moved from 14.2 to 12.9. A lower number is higher up the results.</li>
<li>Orders that came from search: not measured. Tracking is not set up yet.</li>
</ul>
</section>
<section>
<h2>2. The numbers</h2>
<table>
<thead>
<tr><th>Metric</th><th class="num">Aug</th><th class="num">Sep</th><th class="num">Change</th><th>What it means</th></tr>
</thead>
<tbody>
<tr><td data-label="Metric">Clicks</td><td class="num" data-label="Aug">1,240</td><td class="num" data-label="Sep">1,386</td><td class="num up" data-label="Change">+146 (+11.8%)</td><td class="note">Times someone clicked through to the site from Search.</td></tr>
<tr><td data-label="Metric">Impressions</td><td class="num" data-label="Aug">41,800</td><td class="num" data-label="Sep">45,200</td><td class="num up" data-label="Change">+3,400 (+8.1%)</td><td class="note">Times the site appeared in results.</td></tr>
<tr><td data-label="Metric">CTR</td><td class="num" data-label="Aug">3.0%</td><td class="num" data-label="Sep">3.1%</td><td class="num up" data-label="Change">+0.1 pt</td><td class="note">Clicks divided by impressions.</td></tr>
<tr><td data-label="Metric">Average position</td><td class="num" data-label="Aug">14.2</td><td class="num" data-label="Sep">12.9</td><td class="num up" data-label="Change">-1.3 (better)</td><td class="note">Average position of the topmost result from the site.</td></tr>
<tr><td data-label="Metric">Orders from search</td><td class="num gap" data-label="Aug">not measured</td><td class="num gap" data-label="Sep">not measured</td><td class="num" data-label="Change">-</td><td class="note">Needs order tracking. Listed under next steps.</td></tr>
</tbody>
</table>
</section>
<section>
<h2>3. Top searches</h2>
<table>
<thead>
<tr><th>Search</th><th class="num">Clicks</th><th class="num">Position</th><th>Note</th></tr>
</thead>
<tbody>
<tr><td data-label="Search">harbor point sourdough</td><td class="num" data-label="Clicks">212</td><td class="num" data-label="Position">3.1</td><td class="note">Steady. Mostly people who already know the shop.</td></tr>
<tr><td data-label="Search">bakery near harbor point</td><td class="num" data-label="Clicks">148</td><td class="num" data-label="Position">6.4</td><td class="note">Was 9.8 in August. The page title changed on 9 Sep. Timing only, not proof of cause.</td></tr>
<tr><td data-label="Search">birthday cake order harbor point</td><td class="num" data-label="Clicks">96</td><td class="num" data-label="Position">11.2</td><td class="note">Second page of results. See next step 1.</td></tr>
<tr><td data-label="Search">gluten free bread harbor point</td><td class="num" data-label="Clicks">54</td><td class="num" data-label="Position">18.7</td><td class="note">No page about it yet.</td></tr>
</tbody>
</table>
</section>
<section>
<h2>4. Done in September</h2>
<ul>
<li>9 Sep: rewrote the title and description of the home page.</li>
<li>16 Sep: added opening hours and a map link to the contact page.</li>
<li>23 Sep: renamed 14 photo files so each says what it shows.</li>
</ul>
</section>
<section>
<h2>5. Next month</h2>
<ol>
<li>Write a page for ordering birthday cakes. Due 15 Oct.</li>
<li>Set up order tracking. Waiting for the shop login from the client.</li>
<li>Check positions again on 1 Nov and paste the new numbers.</li>
</ol>
</section>
<p class="src">Source: Google Search Console, Performance report, Search results. Dates: 1-30 Sep 2026 and 1-31 Aug 2026. Sample data for a fictional business.</p>
</div>
</body>
</html>
The numbers on this page do not update. That is on purpose. A monthly report is a record of one month, and the page says when the numbers were pasted.
If a client wants figures that refresh by themselves, that is a dashboard, and this page is not one.
The five blocks of the page
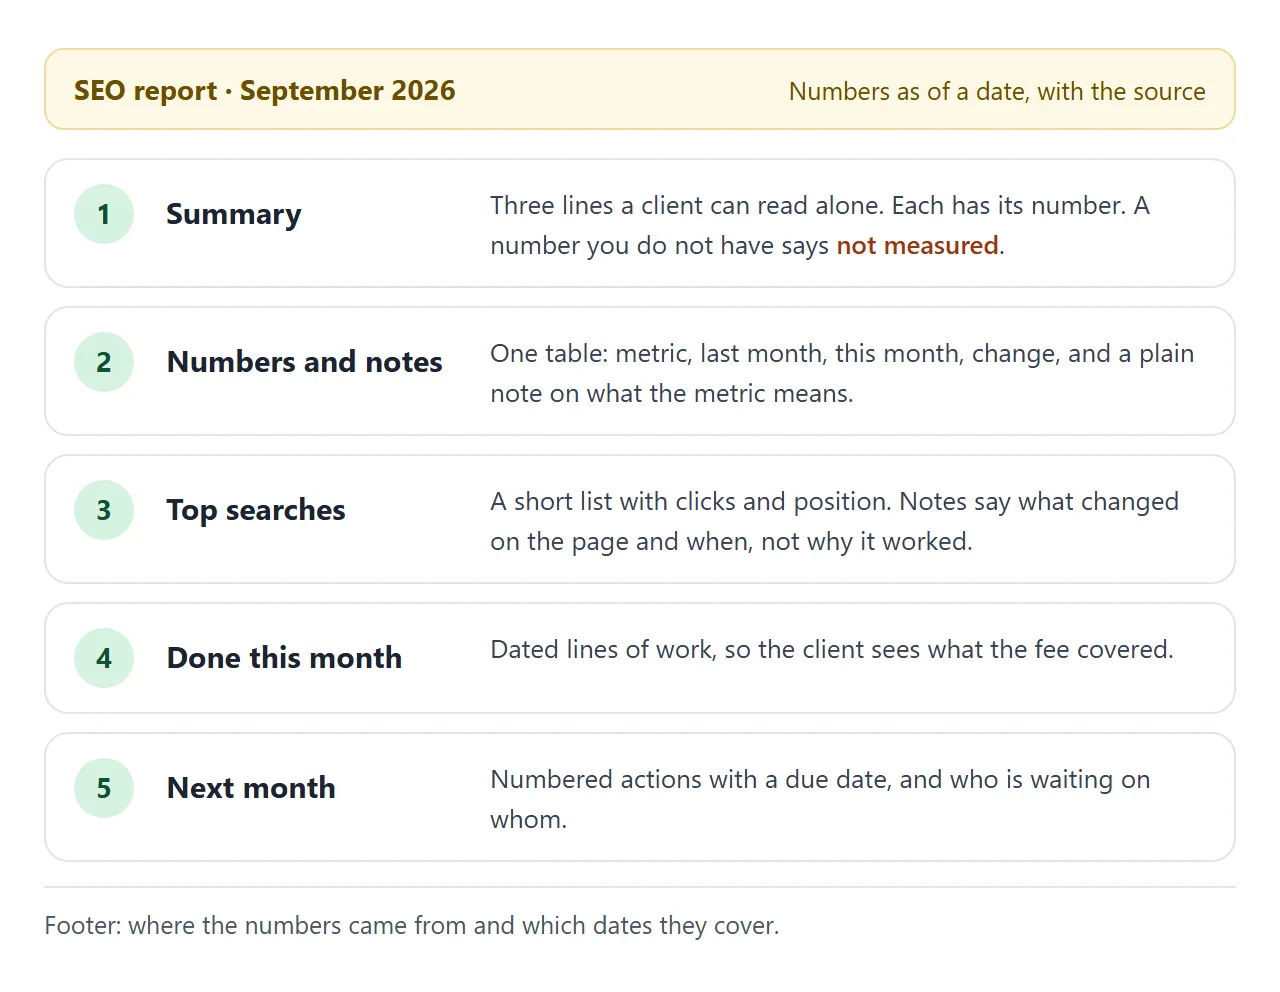
Put the summary first, so someone who stops after ten seconds still has the main point. Each bullet carries its number. A number you do not have says "not measured", which is more useful to a client than a blank or a zero.
The notes column is the risky part. A note can say what a metric is, or what changed on the page and when. It should not say why a number moved unless you know.
"Position improved after the title change" claims a cause. "The title changed on 9 Sep, and position moved from 9.8 to 6.4" gives two facts and lets the reader decide. The demo above does it the second way.
Finish with two short lists. Done this month shows what the fee covered, with dates. Next month lists numbered actions, each with a due date and a note on who is waiting for whom.
Make it with AI
Any of the big assistants (ChatGPT, Claude, Gemini) can write this page in one go. Paste this prompt, then paste your numbers under the last line.
Make one self-contained HTML file: a monthly SEO report for a
small-business client. No external scripts, fonts or images.
Add a viewport meta tag.

Sections, in this order:
1. Summary: three bullets, each with its number.
2. A table: Metric, Last month, This month, Change, What it means.
3. A table of top searches: Search, Clicks, Position, Note.
4. Done this month: a dated list.
5. Next month: a numbered list with due dates.
Footer: the source and the date range.

Use only the numbers below. Do not estimate or round them. If a
number is missing, write "not measured". Do not explain why a
number changed.

Under the title add: "Numbers as of <date>, pasted from Search
Console. They do not update."

On narrow screens turn each table row into a small card.
For print, keep every table row on one page.

My numbers:
[paste your export here]
Then check the result before it goes anywhere. This is the part that protects your name.
- Every number against the export. Look for swapped digits and a wrong total.
- The Change column. Work out two rows by hand, or use the helper further down.
- Gaps. A dash in Search Console must read "not measured" on the page, never 0.
- Causes. Search the page for "because", "due to", "driven by" and "thanks to". Delete any cause you did not supply.
- Width. Make the window narrow. The tables should turn into cards.
The HTML report template guide goes deeper on invented figures and the phrases worth striking.
Paste the numbers in
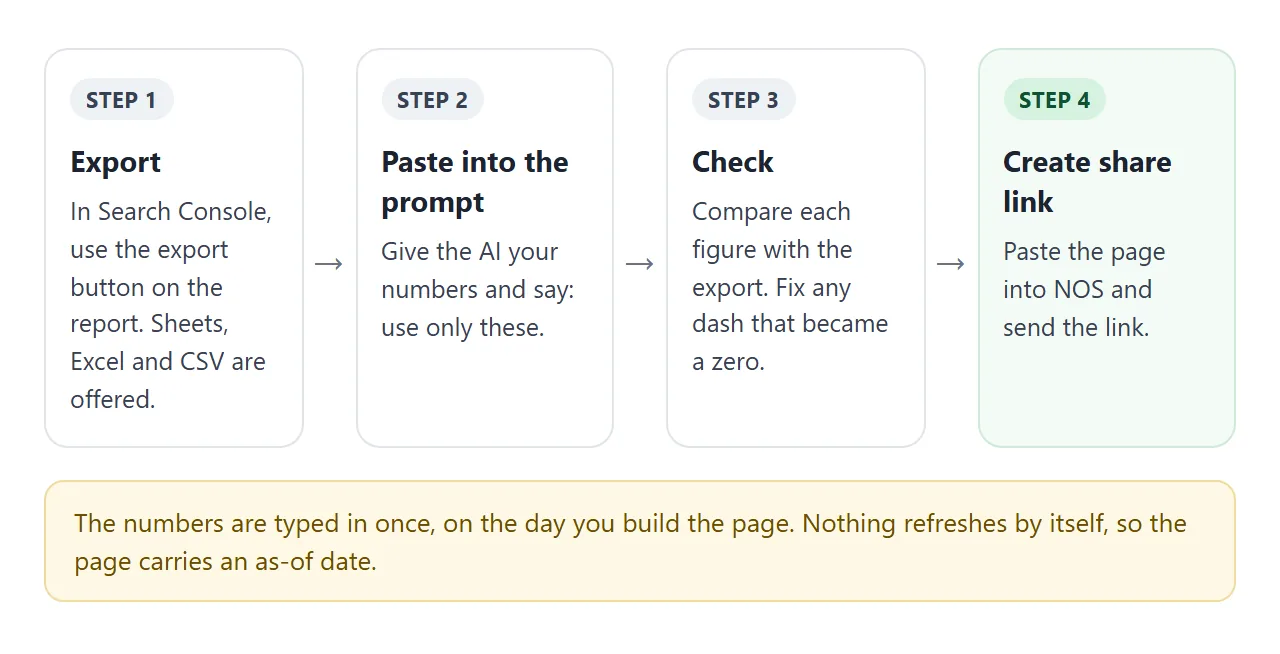
Google's Search Console help defines the four numbers in the Performance report. As of October 2026 the wording is below, shortened.
| Metric | What Google says it is |
|---|---|
| Clicks | How many times a user clicked your site from Google Search results |
| Impressions | How many times your site appeared in Search results |
| CTR | The click count divided by the impression count |
| Average position | The average position of the topmost result from your site, where 1 is the topmost |
Three facts about the export matter for a pasted report. The export offers Google Sheets, Microsoft Excel and CSV. The download is cut to 1,000 rows. And a value shown as "~" or "-" in the report becomes a zero in the download.
That last one is why the report says "not measured". A zero reads as a result. A dash was a gap.
Write the date range on the page too. The default view of the report covers the past three months, and your client may be looking at a different range.
The helper below works out the Change column and prints rows you can paste into the table. Empty boxes become "not measured", never 0.
<!doctype html>
<html lang="en">
<head>
<meta charset="utf-8">
<meta name="viewport" content="width=device-width, initial-scale=1">
<title>Change column helper</title>
<style>
* { box-sizing: border-box; }
body { margin: 0; padding: 16px 14px 24px; font-family: system-ui, sans-serif; color: #1d2330; background: #f3f5f7; line-height: 1.45; }
.wrap { max-width: 780px; margin: 0 auto; }
h1 { font-size: 18px; margin: 0 0 4px; }
p { margin: 0 0 12px; font-size: 14px; color: #4b5563; }
.head, .row { display: grid; grid-template-columns: 1.3fr 1fr 1fr 1.6fr; gap: 8px; align-items: center; }
.head { font-size: 12px; font-weight: 700; color: #0f4f4a; padding: 0 2px 4px; }
.row { background: #fff; border: 1px solid #e1e4ea; border-radius: 8px; padding: 8px; margin-bottom: 8px; }
input[type=text] { width: 100%; font: inherit; font-size: 14px; padding: 6px 8px; border: 1px solid #cdd3dc; border-radius: 6px; background: #fff; }
label.low { grid-column: 1 / -1; font-size: 12.5px; color: #4b5563; }
.out { font-size: 14px; font-weight: 600; }
.out.gap { color: #8a5a00; font-style: italic; font-weight: 400; }
.out.bad { color: #b42318; }
button { font: inherit; font-size: 14px; padding: 7px 12px; border: 1px solid #0f766e; background: #fff; color: #0f4f4a; border-radius: 6px; cursor: pointer; }
button:hover { background: #f0f7f6; }
textarea { width: 100%; height: 130px; margin-top: 8px; font: 12.5px/1.5 ui-monospace, Consolas, monospace; padding: 8px; border: 1px solid #cdd3dc; border-radius: 6px; resize: vertical; }
.hint { font-size: 12.5px; margin-top: 10px; }
@media (max-width: 560px) {
.head { display: none; }
.row { grid-template-columns: 1fr 1fr; }
.row .name { grid-column: 1 / -1; }
.row .out { grid-column: 1 / -1; }
}
</style>
</head>
<body>
<div class="wrap">
<h1>Change column helper</h1>
<p>Type last month and this month. Leave a box empty or type n/a when a number was not measured. It is never turned into 0.</p>
<div class="head"><span>Metric</span><span>Last month</span><span>This month</span><span>Change</span></div>
<div id="rows"></div>
<button id="add" type="button">Add a row</button>
<p class="hint">Rows to paste into the report's table body (select all, copy):</p>
<textarea id="html" readonly aria-label="Generated table rows"></textarea>
</div>
<script>
const start = [
['Clicks', '1,240', '1,386', false],
['Impressions', '41,800', '45,200', false],
['CTR', '3.0%', '3.1%', false],
['Average position', '14.2', '12.9', true],
['Orders from search', '', '', false],
];
const rowsBox = document.getElementById('rows');
const out = document.getElementById('html');
function parse(s) {
const t = s.trim().replace(/,/g, '').replace('%', '');
if (t === '' || /^(n\/a|na|-|~|not measured)$/i.test(t)) return { kind: 'gap' };
const v = Number(t);
return Number.isFinite(v) ? { kind: 'ok', v: v } : { kind: 'bad' };
}
function decimals(s) {
const m = s.replace('%', '').match(/\.(\d+)/);
return m ? m[1].length : 0;
}
function fmt(n, dec) {
return n.toLocaleString('en-US', { minimumFractionDigits: dec, maximumFractionDigits: dec });
}
function change(a, b, lowIsBetter) {
const pa = parse(a), pb = parse(b);
if (pa.kind === 'bad' || pb.kind === 'bad') return { text: 'check the number', cls: 'bad' };
if (pa.kind === 'gap' || pb.kind === 'gap') return { text: 'not measured', cls: 'gap' };
const d = pb.v - pa.v;
if (d === 0) return { text: 'no change', cls: '' };
const dec = Math.max(decimals(a), decimals(b));
const pct = a.includes('%') && b.includes('%');
const sign = d > 0 ? '+' : '-';
let text = sign + fmt(Math.abs(d), dec);
if (pct) text += ' pt';
else if (!lowIsBetter && pa.v !== 0) text += ' (' + sign + fmt(Math.abs(d / pa.v * 100), 1) + '%)';
if (lowIsBetter) text += d < 0 ? ' (better)' : ' (worse)';
return { text: text, cls: '' };
}
function esc(s) {
return s.replace(/&/g, '&').replace(/</g, '<').replace(/>/g, '>');
}
function update() {
const lines = [];
rowsBox.querySelectorAll('.row').forEach((row) => {
const [name, a, b] = row.querySelectorAll('input[type=text]');
const low = row.querySelector('input[type=checkbox]').checked;
const c = change(a.value, b.value, low);
const cell = row.querySelector('.out');
cell.textContent = c.text;
cell.className = 'out ' + c.cls;
const show = (v) => (parse(v).kind === 'ok' ? v.trim() : 'not measured');
lines.push('<tr><td>' + esc(name.value) + '</td><td>' + esc(show(a.value)) + '</td><td>' + esc(show(b.value)) + '</td><td>' + esc(c.text) + '</td></tr>');
});
out.value = lines.join('\n');
}
function addRow(r) {
const row = document.createElement('div');
row.className = 'row';
row.innerHTML =
'<input class="name" type="text" aria-label="Metric" placeholder="Metric">' +
'<input type="text" inputmode="decimal" aria-label="Last month" placeholder="last month">' +
'<input type="text" inputmode="decimal" aria-label="This month" placeholder="this month">' +
'<span class="out"></span>' +
'<label class="low"><input type="checkbox"> lower number is better (for example position)</label>';
const f = row.querySelectorAll('input[type=text]');
f[0].value = r[0]; f[1].value = r[1]; f[2].value = r[2];
row.querySelector('input[type=checkbox]').checked = r[3];
rowsBox.appendChild(row);
}
start.forEach(addRow);
rowsBox.addEventListener('input', update);
document.getElementById('add').addEventListener('click', () => { addRow(['', '', '', false]); update(); });
update();
</script>
</body>
</html>
Send it as a link
Copy the finished HTML, open NOS, and paste it into a new document. The page renders as written. Choose Share, then Share link, then Create share link. HTML to link walks through it.
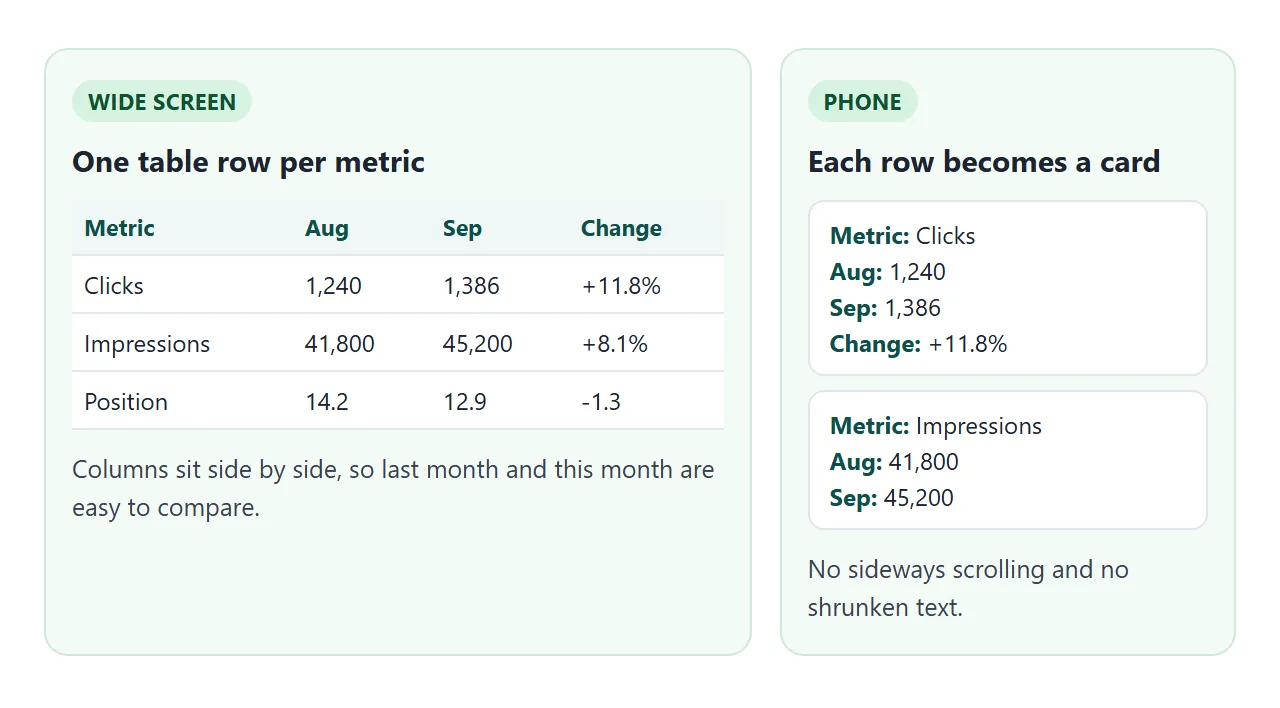
Whoever has the link sees the report in a browser, on a phone too, with no account. They can read it but not edit it. If you fix a figure later, edit the code and the same link shows the new version.
For a monthly report you have two choices. Keep one page and replace the month, so the client always has one bookmark. Or make a new page each month, so earlier months stay readable. One address per period covers the second.
To send it, paste the link into an email or a chat message. It is plain text, so it goes wherever text goes. If the table looks wrong on a phone, see making a table responsive.
Link, PDF or screenshot
| Link to the page | PDF attachment | Screenshot | |
|---|---|---|---|
| What the client opens | A page in the browser | A file | A picture |
| Numbers can be selected and copied | Yes | Depends on how the PDF was made | No |
| Fixing a figure later | Edit the page, same link | Make and send a new file | Take and send a new picture |
| A table across two pages | Not applicable, one scrolling page | Possible unless print styles prevent it | Long reports need several pictures |
| Live numbers | No, pasted as of a date | No | No |
None of the three is live. That is why the as-of line is on the page.
If you must send a PDF as well, the page can carry print styles, which apply in print preview. Print CSS with @media print shows how. Screenshot vs live page explains what a picture loses.
When it does not work
| What you see | Cause | Fix |
|---|---|---|
| A metric shows 0 but Search Console showed a dash | The export turns "~" and "-" into zeros | Type "not measured" yourself |
| Your list stops at 1,000 rows | The export is cut to 1,000 rows | Report the top ten, and say so |
| Client sees different numbers | A different date range or filter | Write your dates on the page |
| The AI added a reason for a rise | You asked for no causes, but it can slip in | Delete it, or write only dated facts |
| The table runs off a phone screen | Too many columns and no narrow layout | Ask for rows as cards below 560px |
| A printed table splits across pages | No print styles | Ask for table rows that stay on one page |
| A logo or photo is missing | Images from other sites are blocked | Use inline SVG or CSS shapes |
| The email shows code, not a page | An .html file was attached | Send the share link instead |