A capstone project website is one page with three parts: a summary, the method and the results. An AI chat can write it as a single HTML file, and that file can become a link your review panel opens on a laptop or a phone.
The last step is putting it online. One Quora question asks how to host a site made for an academic project, for free, so others can see it. A share link answers that without hosting set-up. Here is the kind of page to aim for.
<!doctype html>
<html lang="en">
<head>
<meta charset="utf-8">
<meta name="viewport" content="width=device-width, initial-scale=1">
<title>Capstone project page</title>
<style>
  * { box-sizing: border-box; }
  body { margin: 0; font-family: system-ui, sans-serif; color: #1f2933; background: #f3f6f7; line-height: 1.5; }
  .wrap { max-width: 760px; margin: 0 auto; padding: 0 16px 24px; }
  header { background: #0f4c5c; color: #fff; padding: 22px 16px 18px; }
  header .in { max-width: 760px; margin: 0 auto; }
  .tag { font-size: 12px; letter-spacing: .06em; text-transform: uppercase; opacity: .8; }
  h1 { font-size: 24px; line-height: 1.2; margin: 6px 0 8px; }
  .meta { font-size: 14px; opacity: .9; margin: 0; }
  nav { position: sticky; top: 0; background: #fff; border-bottom: 1px solid #dde3e6; z-index: 5; }
  nav .in { max-width: 760px; margin: 0 auto; display: flex; gap: 4px; padding: 0 10px; overflow-x: auto; }
  nav a { padding: 11px 10px; font-size: 14px; color: #0f4c5c; text-decoration: none; white-space: nowrap; font-weight: 600; }
  nav a:hover { background: #eef4f5; }
  section { background: #fff; border-radius: 10px; padding: 16px; margin-top: 14px; box-shadow: 0 1px 3px rgba(0,0,0,.06); }
  h2 { font-size: 18px; margin: 0 0 8px; color: #0f4c5c; }
  p { margin: 0 0 10px; }
  .stats { display: grid; grid-template-columns: repeat(3, 1fr); gap: 8px; margin-top: 12px; }
  .stat { background: #eef4f5; border-radius: 8px; padding: 10px; text-align: center; }
  .stat b { display: block; font-size: 22px; color: #0f4c5c; }
  .stat span { font-size: 12px; color: #52606d; }
  ol.steps { margin: 0; padding: 0; list-style: none; display: grid; gap: 8px; }
  ol.steps li { display: flex; gap: 10px; align-items: flex-start; }
  ol.steps .n { flex: none; width: 26px; height: 26px; border-radius: 50%; background: #0f4c5c; color: #fff; font-size: 13px; font-weight: 700; display: grid; place-items: center; margin-top: 1px; }
  .bars { display: grid; gap: 14px; margin: 6px 0 4px; }
  .bar-title { font-size: 14px; font-weight: 600; margin-bottom: 4px; }
  .row { display: grid; grid-template-columns: 58px 1fr; align-items: center; gap: 8px; margin-bottom: 4px; font-size: 13px; }
  .track { background: #e6ecee; border-radius: 4px; height: 22px; }
  .fill { height: 22px; border-radius: 4px; color: #fff; font-size: 12px; font-weight: 700; padding: 3px 8px; white-space: nowrap; }
  .before { background: #9aa5b1; } .after { background: #0f8b6d; }
  .note { font-size: 12px; color: #52606d; }
  button { font: inherit; font-size: 14px; padding: 7px 12px; border-radius: 6px; border: 1px solid #0f4c5c; background: #fff; color: #0f4c5c; cursor: pointer; margin-top: 8px; }
  button:hover { background: #eef4f5; }
  table { width: 100%; border-collapse: collapse; font-size: 14px; margin-top: 10px; }
  th, td { text-align: left; padding: 6px 8px; border-bottom: 1px solid #e6ecee; }
  [hidden] { display: none; }
  details { border-top: 1px solid #e6ecee; padding: 8px 0; }
  summary { cursor: pointer; font-weight: 600; }
  details p { margin: 6px 0 0; font-size: 14px; }
  footer { font-size: 12px; color: #52606d; text-align: center; padding-top: 14px; }
</style>
</head>
<body>
<header><div class="in">
  <div class="tag">Capstone project · Information Systems</div>
  <h1>Cafeteria Pre-Order Pickup</h1>
  <p class="meta">Sam Rivera · Advisor: Prof. Dana Whitfield · Spring term</p>
</div></header>
<nav><div class="in">
  <a href="#summary">Summary</a><a href="#method">Method</a><a href="#results">Results</a><a href="#questions">Panel questions</a>
</div></nav>

<div class="wrap">
  <section id="summary">
    <h2>Summary</h2>
    <p>Lunch queues at a campus cafeteria were long, and unsold plates were thrown away at closing. This project tested a simple pre-order page so students pick a pickup slot before they arrive.</p>
    <p>The pilot ran for three weeks. Waiting time at the counter fell, and the kitchen could cook closer to what was ordered.</p>
    <div class="stats">
      <div class="stat"><b>4 min</b><span>average wait, after</span></div>
      <div class="stat"><b>21</b><span>plates unsold per day, after</span></div>
      <div class="stat"><b>48</b><span>students in the survey</span></div>
    </div>
  </section>

  <section id="method">
    <h2>Method</h2>
    <ol class="steps">
      <li><span class="n">1</span><span><b>Baseline.</b> Timed 5 lunch periods at the counter and counted unsold plates.</span></li>
      <li><span class="n">2</span><span><b>Prototype.</b> Built a one-page menu with pickup slots in 15-minute steps.</span></li>
      <li><span class="n">3</span><span><b>Pilot.</b> Three weeks, one counter, volunteers from two classes.</span></li>
      <li><span class="n">4</span><span><b>Compare.</b> Same measures as the baseline, plus a 6-question survey.</span></li>
    </ol>
  </section>

  <section id="results">
    <h2>Results</h2>
    <div class="bars">
      <div>
        <div class="bar-title">Average wait at the counter (minutes)</div>
        <div class="row"><span>Before</span><div class="track"><div class="fill before" style="width:100%">11</div></div></div>
        <div class="row"><span>After</span><div class="track"><div class="fill after" style="width:36%">4</div></div></div>
      </div>
      <div>
        <div class="bar-title">Plates unsold per day</div>
        <div class="row"><span>Before</span><div class="track"><div class="fill before" style="width:100%">38</div></div></div>
        <div class="row"><span>After</span><div class="track"><div class="fill after" style="width:55%">21</div></div></div>
      </div>
    </div>
    <button id="toggle" type="button" aria-expanded="false">Show the numbers</button>
    <div id="data" hidden>
      <table>
        <tr><th>Measure</th><th>Before</th><th>After</th></tr>
        <tr><td>Average wait (min)</td><td>11</td><td>4</td></tr>
        <tr><td>Unsold plates per day</td><td>38</td><td>21</td></tr>
      </table>
    </div>
    <p class="note">Limits: one counter, three weeks, volunteers only. Sample data for this demo.</p>
  </section>

  <section id="questions">
    <h2>Questions a panel may ask</h2>
    <details><summary>Why only one counter?</summary><p>The pilot needed a clean comparison, so one counter was changed and the others stayed as they were.</p></details>
    <details><summary>What would you do next?</summary><p>Repeat the pilot over a full term and add a second counter before drawing wider conclusions.</p></details>
    <details><summary>Where is the full report?</summary><p>The written report is submitted separately. This page is the short version of it.</p></details>
  </section>
  <footer>Capstone page · fictional example</footer>
</div>

<script>
  // Show or hide the table of raw numbers
  const btn = document.getElementById('toggle');
  const data = document.getElementById('data');
  btn.addEventListener('click', () => {
    const open = data.hidden;
    data.hidden = !open;
    btn.setAttribute('aria-expanded', open);
    btn.textContent = open ? 'Hide the numbers' : 'Show the numbers';
  });
</script>
</body>
</html>
Scroll through it and press the button under the chart. Because scripts run on a shared page, the panel can do the same.
Make it with AI
Open ChatGPT, Claude or Gemini and paste the prompt below. Replace the lines after "My project" with your own text, copied from your report. The most important rule is in the prompt itself: the AI must use only your numbers.
Write one self-contained HTML file for my capstone project page.
Sections in this order: title block, Summary, Method, Results, Limits, Questions a panel may ask.
Use only the facts and numbers I paste below. Do not invent any number, name or source.
Put the CSS and JavaScript inside the same file. No outside images, fonts or libraries.
Make it readable on a phone and on a laptop.
Show the results as a bar chart built with HTML and CSS, and add a button that shows the raw numbers in a table.
Reply with the HTML only.

My project:
Title:
Summary:
Method steps:
Results (exact numbers):
Limits:
When the page comes back, read it before you use it:
- Numbers. Compare every figure with your report. Make sure nothing was rounded, swapped or added that you never gave.
- Names and dates. Your name, advisor, term and project title are all spelled the way they appear on your cover page.
- Leftovers. Look for placeholder words such as Lorem or Your Name, and for sources you did not provide.
- Phone. Open it on a phone and scroll to the end. If the text is tiny, see the viewport meta tag.
What goes in each of the three parts
Give each part one question to answer. If a sentence does not help answer it, cut it.
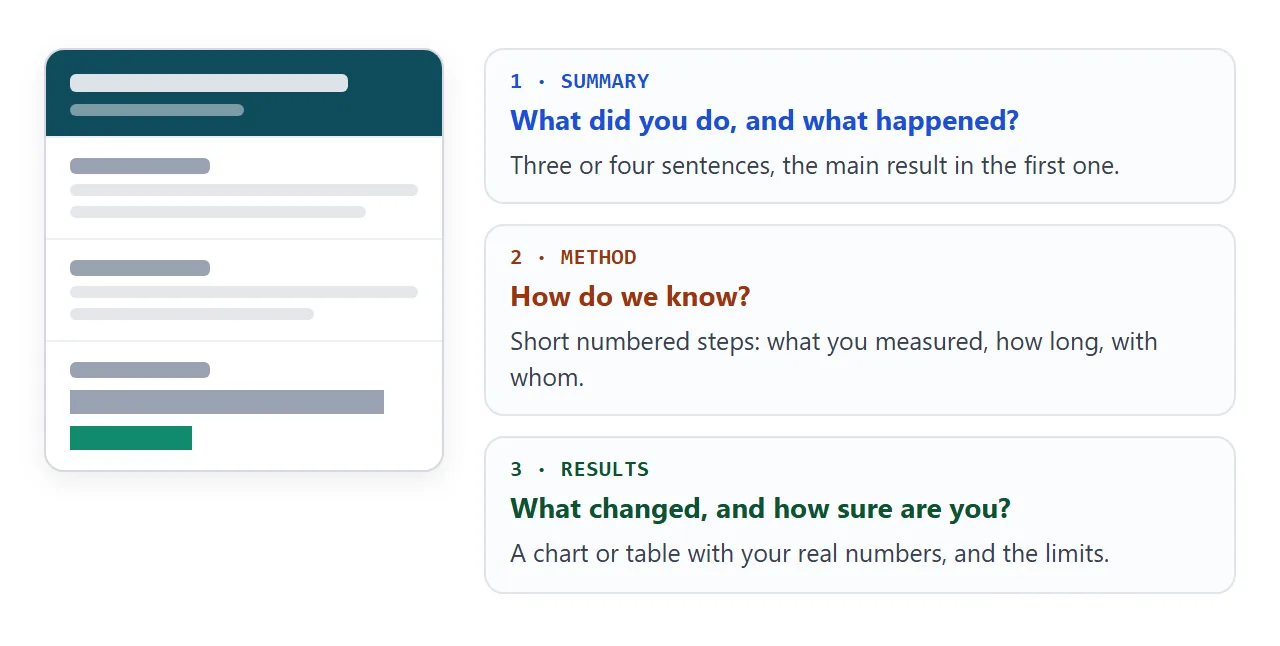
Summary: what you did and what happened, with the main result first. Method: how you know, in short numbered steps: what you measured, for how long, with whom. Results: a chart or table of your real numbers, then the limits.
Write the limits yourself rather than leaving them for the panel to find. For a longer written work, a link per chapter follows the same idea. For the chart itself, HTML bar chart shows how it is built.
Send it as a link
Copy the HTML, paste it into a NOS document and choose Create share link. HTML to link walks through it. The page renders as written and its scripts run.
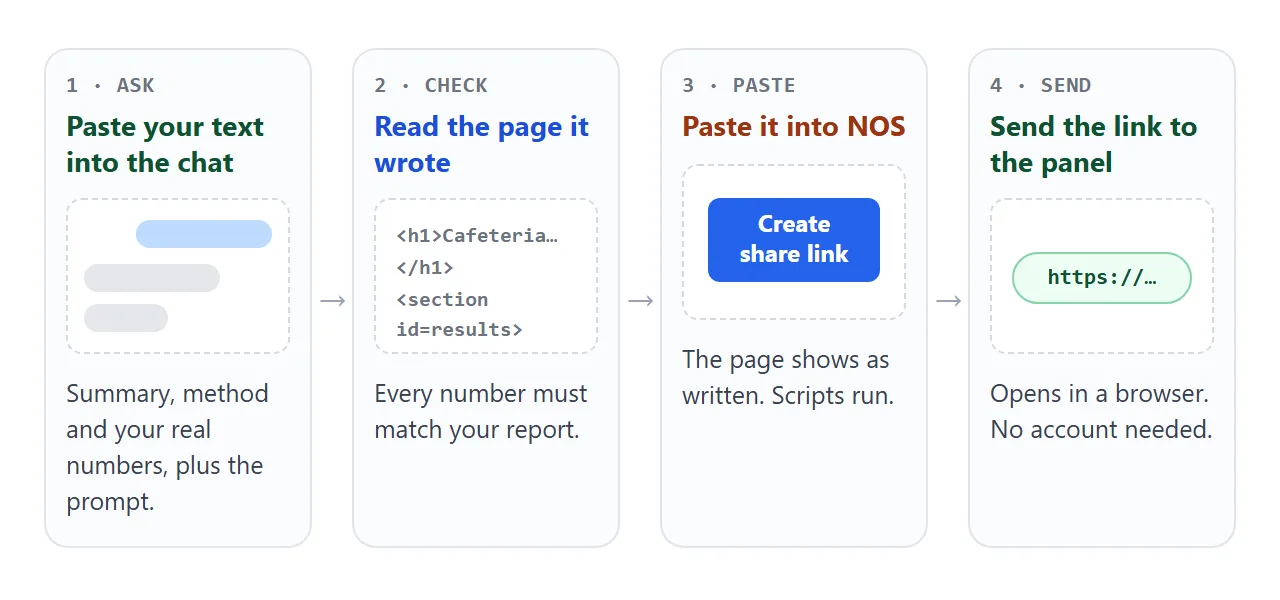
Whoever opens the link sees the page in their browser, on a phone too, with no account. They cannot edit it. If you fix a typo later, change the code and the same link shows the new version.
To use the link where your panel already looks:
- Gmail (as of October 2026). Compose, highlight text, click Insert link (or press Ctrl + K), paste the URL in the bottom field, and click Apply.
- Google Classroom (as of October 2026). Under Your work, click Add or create, choose Link, enter the URL and click Add.
- Poster or slide. Turn the link into a QR code, as in HTML file to QR code.
Anyone who has the link can open the page, so share it only with people you trust with its content.
Ways to send it compared
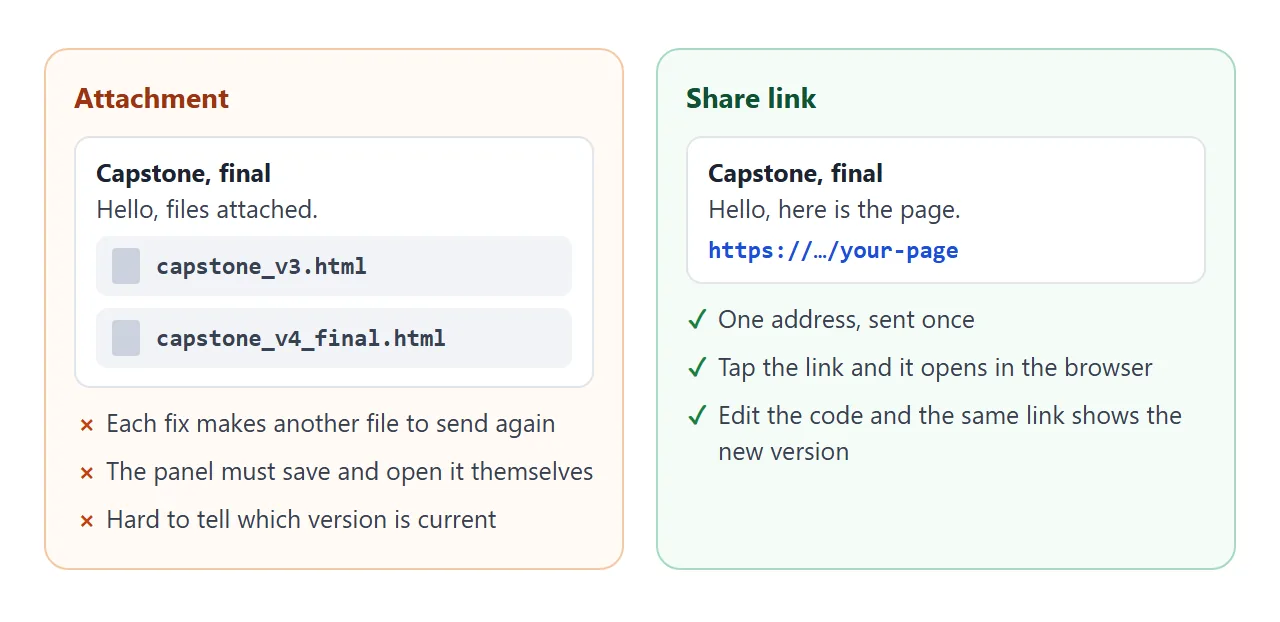
The same page can reach the panel in several ways. A link is the only one that stays current after you edit.
| Way to send | What the panel does | After you fix a typo |
|---|---|---|
| .html attachment | Saves the file, then opens it | Send a new file |
| PDF export | Opens a fixed copy | Export and send again |
| Share link in an email | Taps the link | Nothing to send |
| Link in a Classroom assignment | Opens it from the assignment | Nothing to send |
For how phones treat HTML files, see opening an HTML file on a phone. Keep your written report as a file if your program asks for one. The page works alongside it.
Check it before the panel sees it
Run through this list on the page itself, not in the AI chat. It takes five minutes and catches the mistakes panels notice first.
<!doctype html>
<html lang="en">
<head>
<meta charset="utf-8">
<meta name="viewport" content="width=device-width, initial-scale=1">
<title>Before you send it to the panel</title>
<style>
  * { box-sizing: border-box; }
  body { margin: 0; padding: 16px; font-family: system-ui, sans-serif; color: #1f2933; background: #f3f6f7; line-height: 1.45; }
  .card { max-width: 640px; margin: 0 auto; background: #fff; border-radius: 12px; padding: 18px; box-shadow: 0 1px 4px rgba(0,0,0,.08); }
  h1 { font-size: 20px; margin: 0 0 4px; color: #0f4c5c; }
  .sub { margin: 0 0 14px; font-size: 14px; color: #52606d; }
  .prog { display: flex; align-items: center; gap: 10px; margin-bottom: 12px; }
  .prog .track { flex: 1; height: 10px; border-radius: 5px; background: #e6ecee; overflow: hidden; }
  .prog .fill { height: 100%; width: 0; background: #0f8b6d; transition: width .2s; }
  #count { font-size: 14px; font-weight: 700; min-width: 74px; text-align: right; }
  ul { list-style: none; margin: 0; padding: 0; }
  li { border-top: 1px solid #e6ecee; }
  label { display: flex; gap: 10px; align-items: flex-start; padding: 10px 2px; cursor: pointer; }
  input[type=checkbox] { width: 20px; height: 20px; margin-top: 1px; accent-color: #0f8b6d; flex: none; }
  label small { display: block; color: #52606d; font-size: 13px; }
  li.done b { text-decoration: line-through; color: #7b8794; }
  .msg { margin-top: 16px; background: #eef4f5; border-radius: 8px; padding: 12px 14px; font-size: 14px; }
  .msg h2 { font-size: 14px; margin: 0 0 6px; color: #0f4c5c; }
  .msg p { margin: 0 0 6px; }
  .ready { display: none; margin-top: 12px; padding: 10px 12px; border-radius: 8px; background: #d9f2e8; color: #0b5d46; font-weight: 600; font-size: 14px; }
  .ready.on { display: block; }
</style>
</head>
<body>
<div class="card">
  <h1>Before you send it to the panel</h1>
  <p class="sub">Tick each item once you have checked it on the page itself.</p>
  <div class="prog"><div class="track"><div class="fill" id="fill"></div></div><span id="count">0 of 6</span></div>
  <ul id="list">
    <li><label><input type="checkbox"><span><b>Numbers match the report</b><small>Every figure on the page appears in the written report, same value.</small></span></label></li>
    <li><label><input type="checkbox"><span><b>Names and course details are right</b><small>Your name, advisor, term and project title.</small></span></label></li>
    <li><label><input type="checkbox"><span><b>No leftover placeholder text</b><small>Search the page for Lorem, TODO and Your Name.</small></span></label></li>
    <li><label><input type="checkbox"><span><b>Nothing private is on it</b><small>No participant names, contact details or data you may not share.</small></span></label></li>
    <li><label><input type="checkbox"><span><b>Opened on a phone</b><small>Open the link on your phone and scroll the whole page.</small></span></label></li>
    <li><label><input type="checkbox"><span><b>Submission rules checked</b><small>The program may still want the report as a file. The page is the short version.</small></span></label></li>
  </ul>
  <div class="ready" id="ready">All six checked. Send the link.</div>
  <div class="msg">
    <h2>Message to send with the link</h2>
    <p>Hello, here is the short version of my capstone project: summary, method and results on one page.</p>
    <p>Link: (paste your share link here). The full report follows the usual submission route.</p>
  </div>
</div>

<script>
  const boxes = document.querySelectorAll('#list input');
  const fill = document.getElementById('fill');
  const count = document.getElementById('count');
  const ready = document.getElementById('ready');

  function update() {
    const n = [...boxes].filter((b) => b.checked).length;
    fill.style.width = (n / boxes.length * 100) + '%';
    count.textContent = n + ' of ' + boxes.length;
    ready.classList.toggle('on', n === boxes.length);
    boxes.forEach((b) => b.closest('li').classList.toggle('done', b.checked));
  }
  boxes.forEach((b) => b.addEventListener('change', update));
</script>
</body>
</html>
When it does not work
| What you see | Cause | Fix |
|---|---|---|
| A number differs from your report | The AI rounded or invented it | Paste the exact numbers again and ask for a redo |
| Pictures show as empty boxes | Images from other websites are blocked | Ask for inline SVG or CSS shapes instead |
| A contact form does nothing | Sending a form to a server is blocked | Replace it with your email as plain text |
| Plain text, no colors | The CSS lives in a separate file | Ask for one file with the CSS inside |
| Text is tiny on a phone | The viewport meta tag is missing | Ask the AI to add it, then reopen on the phone |
| The program wants a file upload | Submission rules differ | Upload the report file and add the link to it |