A data analysis portfolio example that works is one page per project: the question, the data, your method, a result shown as a chart and a table, and what you would try next.
It can be plain HTML. One post on building a data portfolio says to "use GitHub Pages (free), Wix, or just a simple HTML site" and that it does not need to be fancy.
Here is a complete project page. The numbers are invented for the example. Switch the chart between dry and rainy days.
<!doctype html>
<html lang="en">
<head>
<meta charset="utf-8">
<meta name="viewport" content="width=device-width, initial-scale=1">
<title>Rain and weekday bike rentals</title>
<style>
* { box-sizing: border-box; }
body { margin: 0; background: #f4f5f7; font-family: system-ui, -apple-system, "Segoe UI", sans-serif; color: #1d2330; line-height: 1.55; }
main { max-width: 720px; margin: 0 auto; padding: 22px 16px 34px; }
.tag { font-size: 12.5px; font-weight: 700; letter-spacing: .04em; text-transform: uppercase; color: #5b6472; }
h1 { font-size: 26px; line-height: 1.2; margin: 6px 0 4px; }
.meta { font-size: 14px; color: #5b6472; margin: 0 0 18px; }
section { background: #fff; border: 1px solid #e1e4ea; border-radius: 12px; padding: 16px 18px; margin-bottom: 12px; }
h2 { font-size: 13px; letter-spacing: .06em; text-transform: uppercase; color: #5b6472; margin: 0 0 8px; }
p { margin: 0 0 8px; font-size: 16px; }
p:last-child { margin-bottom: 0; }
.q { font-size: 19px; font-weight: 600; line-height: 1.35; }
.headline { font-size: 18px; font-weight: 600; }
ol, ul { margin: 0; padding-left: 20px; font-size: 16px; }
li { margin-bottom: 4px; }
.switch { display: flex; gap: 6px; flex-wrap: wrap; margin: 4px 0 12px; }
.switch button { font: inherit; font-size: 14px; padding: 6px 12px; border-radius: 999px; border: 1px solid #c8cdd6; background: #fff; color: #1d2330; cursor: pointer; }
.switch button[aria-pressed="true"] { background: #1d2330; color: #fff; border-color: #1d2330; }
.chart { display: grid; gap: 10px; margin-bottom: 8px; }
.row { display: grid; grid-template-columns: 42px 1fr; align-items: center; gap: 8px; font-size: 14px; }
.bars { display: grid; gap: 3px; }
.bar { height: 16px; border-radius: 0 4px 4px 0; position: relative; min-width: 2px; }
.bar span { position: absolute; left: calc(100% + 6px); top: -1px; font-size: 13px; line-height: 18px; color: #1d2330; white-space: nowrap; }
.dry { background: #2b6cb0; }
.rain { background: #d9730d; }
.bar.hidden { display: none; }
.legend { display: flex; gap: 16px; font-size: 14px; margin-bottom: 10px; }
.legend i { display: inline-block; width: 12px; height: 12px; border-radius: 3px; margin-right: 6px; vertical-align: -1px; }
.chart { padding-right: 34px; }
table { width: 100%; border-collapse: collapse; font-size: 15px; margin-top: 6px; }
th, td { text-align: right; padding: 4px 8px; border-bottom: 1px solid #eceef2; }
th:first-child, td:first-child { text-align: left; }
th { font-size: 13px; color: #5b6472; font-weight: 700; }
.two { display: grid; grid-template-columns: 1fr 1fr; gap: 12px; }
.two section { margin-bottom: 12px; }
.note { font-size: 14px; color: #5b6472; }
code { font-family: ui-monospace, Consolas, monospace; font-size: 14px; background: #eef1f5; padding: 1px 5px; border-radius: 4px; }
@media (max-width: 560px) { .two { grid-template-columns: 1fr; gap: 0; } }
@media (max-width: 560px) { main { padding: 16px 12px 24px; } section, .two section { padding: 12px 14px; margin-bottom: 10px; } h1 { font-size: 22px; } .meta { margin-bottom: 12px; } p, ol, ul { font-size: 15px; } .q { font-size: 17px; } .headline { font-size: 16px; } li { margin-bottom: 2px; } .chart { padding-right: 30px; gap: 7px; } .bar { height: 14px; } table { font-size: 14px; } th, td { padding: 3px 6px; } }
</style>
</head>
<body>
<main>
<div class="tag">Project 1 · Excel and Python</div>
<h1>Does rain change which weekdays campus bikes get used?</h1>
<p class="meta">Your Name · Sample data, invented for this example · Updated 1 Oct 2026</p>
<section>
<h2>Question</h2>
<p class="q">How much do rentals fall on rainy days, and does the drop differ between weekdays?</p>
</section>
<div class="two">
<section>
<h2>Data</h2>
<ul>
<li><b>Source:</b> a bike-share log, one row per rental (replace with your real source and its licence).</li>
<li><b>Period:</b> 8 weeks, September to October.</li>
<li><b>Cleaning:</b> removed rentals under 1 minute; joined each day to a yes/no rain flag.</li>
</ul>
</section>
<section>
<h2>Method</h2>
<ol>
<li>Count rentals per day.</li>
<li>Split days into dry and rainy.</li>
<li>Average each weekday for both groups.</li>
<li>Compare: (rainy − dry) ÷ dry.</li>
</ol>
</section>
</div>
<section>
<h2>Result</h2>
<p class="headline" id="headline"></p>
<div class="switch" role="group" aria-label="Chart view">
<button type="button" data-view="both" aria-pressed="true">Both</button>
<button type="button" data-view="dry" aria-pressed="false">Dry days</button>
<button type="button" data-view="rain" aria-pressed="false">Rainy days</button>
</div>
<div class="legend"><span><i class="dry"></i>Dry</span><span><i class="rain"></i>Rainy</span></div>
<div class="chart" id="chart" aria-hidden="true"></div>
<table>
<thead><tr><th>Weekday</th><th>Dry avg</th><th>Rainy avg</th><th>Change</th></tr></thead>
<tbody id="rows"></tbody>
</table>
<p class="note">Average rentals per day. The table holds the same numbers as the chart.</p>
</section>
<div class="two">
<section>
<h2>Limits</h2>
<ul>
<li>Only 8 weeks, so a few rainy days per weekday.</li>
<li>The rain flag is yes or no. A drizzle counts the same as a storm.</li>
</ul>
</section>
<section>
<h2>What I would do next</h2>
<p>Add temperature, then check whether exam weeks change the pattern.</p>
</section>
</div>
<section>
<h2>Files</h2>
<p>Notebook: <code>github.com/your-name/bike-rain</code> (written out as text, so it can be copied).</p>
</section>
</main>
<script>
// All numbers live here. Edit this array and the headline, chart and table all follow.
const data = [
{ day: 'Mon', dry: 142, rain: 88 },
{ day: 'Tue', dry: 150, rain: 96 },
{ day: 'Wed', dry: 158, rain: 101 },
{ day: 'Thu', dry: 149, rain: 93 },
{ day: 'Fri', dry: 131, rain: 84 },
{ day: 'Sat', dry: 96, rain: 55 },
{ day: 'Sun', dry: 84, rain: 49 }
];
const change = (d) => Math.round(((d.rain - d.dry) / d.dry) * 100);
const scale = Math.max(...data.map((d) => d.dry)) * 1.05;
const drops = data.map((d) => -change(d));
document.getElementById('headline').textContent =
'Rainy days had fewer rentals on every weekday: the drop ran from ' +
Math.min(...drops) + '% to ' + Math.max(...drops) + '% in this sample.';
document.getElementById('chart').innerHTML = data.map((d) =>
'<div class="row"><b>' + d.day + '</b><div class="bars">' +
'<div class="bar dry" style="width:' + (d.dry / scale * 100) + '%"><span>' + d.dry + '</span></div>' +
'<div class="bar rain" style="width:' + (d.rain / scale * 100) + '%"><span>' + d.rain + '</span></div>' +
'</div></div>'
).join('');
document.getElementById('rows').innerHTML = data.map((d) =>
'<tr><td>' + d.day + '</td><td>' + d.dry + '</td><td>' + d.rain + '</td><td>' + change(d) + '%</td></tr>'
).join('');
document.querySelectorAll('.switch button').forEach((btn) => {
btn.addEventListener('click', () => {
const view = btn.dataset.view;
document.querySelectorAll('.switch button').forEach((b) => b.setAttribute('aria-pressed', b === btn));
document.querySelectorAll('.bar.dry').forEach((el) => el.classList.toggle('hidden', view === 'rain'));
document.querySelectorAll('.bar.rain').forEach((el) => el.classList.toggle('hidden', view === 'dry'));
});
});
</script>
</body>
</html>
The chart and table are plain HTML and CSS, with no chart library. They are built from a single list of numbers at the top of the script, so a corrected number changes the headline, the bars and the table together.
What goes on a project page
The same post says each project should state the problem in one sentence, give a short overview of the method, show the results, and end with recommendations.
This layout follows that order and adds two blocks for honesty: limits and files.
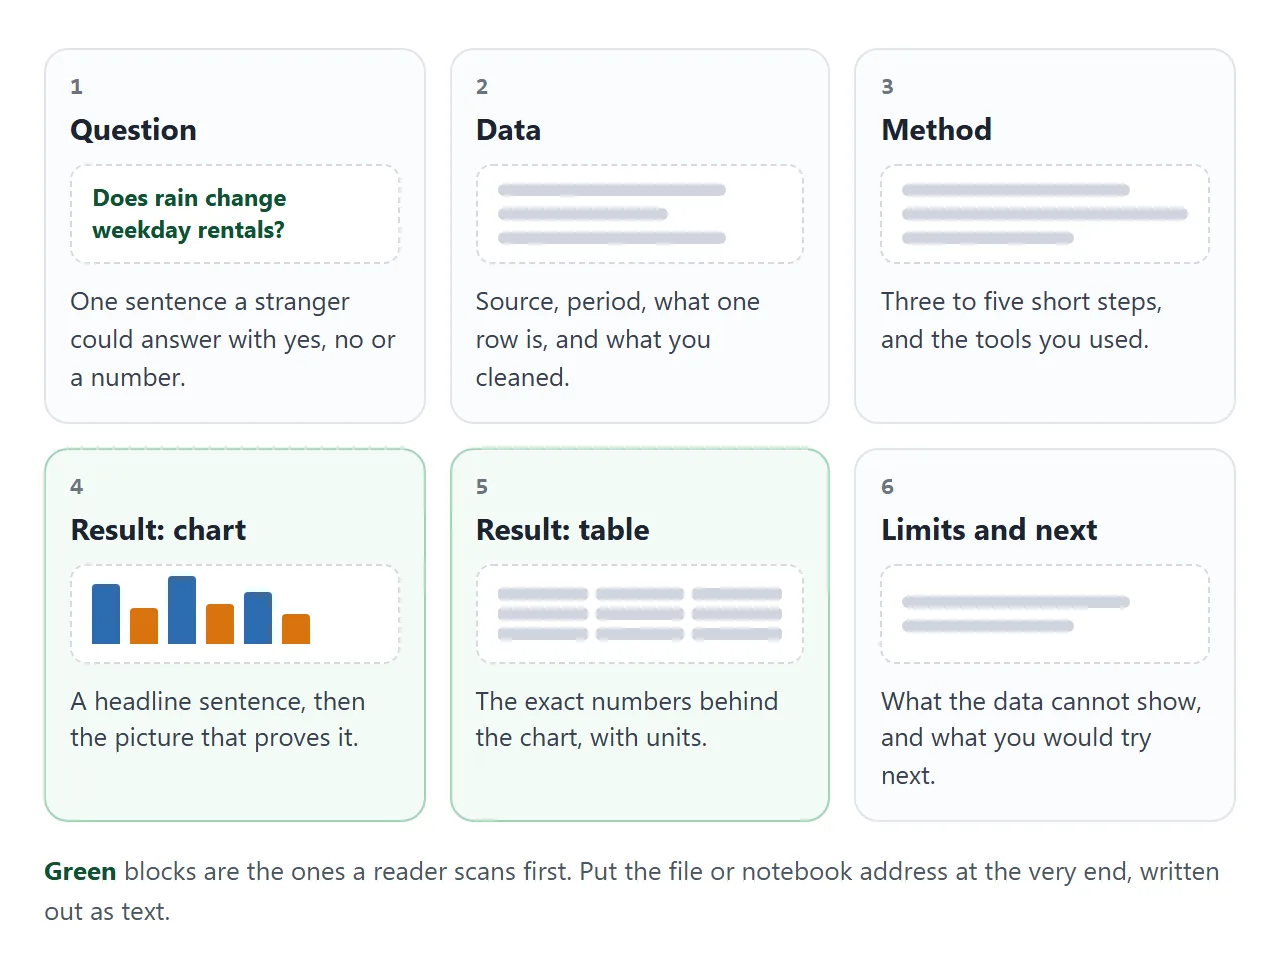
| Block | Write | Test |
|---|---|---|
| Question | One sentence | Could a stranger answer it with yes, no or a number? |
| Data | Source, period, what one row is, cleaning | Could someone find the same data? |
| Method | Three to five steps and the tools | Could a classmate repeat it? |
| Result | A headline, a chart and a table | Does the headline match the table? |
| Limits | What the data cannot show | Is it honest? |
| Files | Notebook or repository address as text | Can it be copied? |
Make it with AI
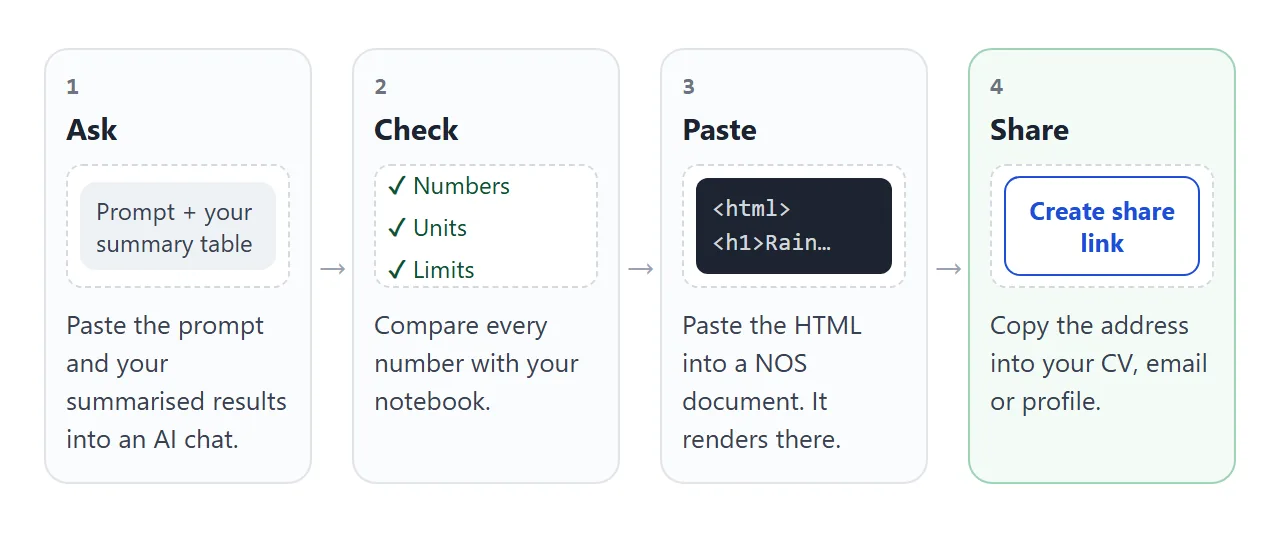
Open the AI chat you already use, such as ChatGPT, Claude or Gemini. Paste this prompt, then add your own summary table under it.
Make a single-file HTML page for one data analysis project.
Sections in this order: title and a one-sentence question; Data
(source, period, what one row is, cleaning); Method (3 to 5
short steps and the tools); Result (a headline sentence, a bar
chart built from plain HTML and CSS with no chart library, and a
table with the same numbers); Limits (2 or 3 bullets); What I
would do next; Files (an address written as text).
Keep all numbers in one JavaScript array at the top of the script
and build the headline, chart and table from it.
One column, 16px text, readable on a phone. No external images,
fonts or scripts. Use my numbers exactly. Return only the HTML.

My summary table:
(paste a small table of final numbers here)
Paste a small table of results, not the raw data file, and nothing private. Then check the page before you share it:
- Every number matches your notebook. An AI can change digits without telling you.
- Bars start at zero, units are labelled, and the headline agrees with the table.
- The data source and period are named, and the limits are ones you believe.
- Placeholders such as the name, date and addresses are replaced.
If something is off, say so in the same chat, for example "sort the table by change and add units", and paste the new version. Writing a chart prompt goes deeper on charts.
Send it as a link
Open a NOS document and paste the HTML in. The page renders as written and its scripts run, so you can test the switch buttons yourself. Then choose Create share link and copy the address. HTML to link walks through it.
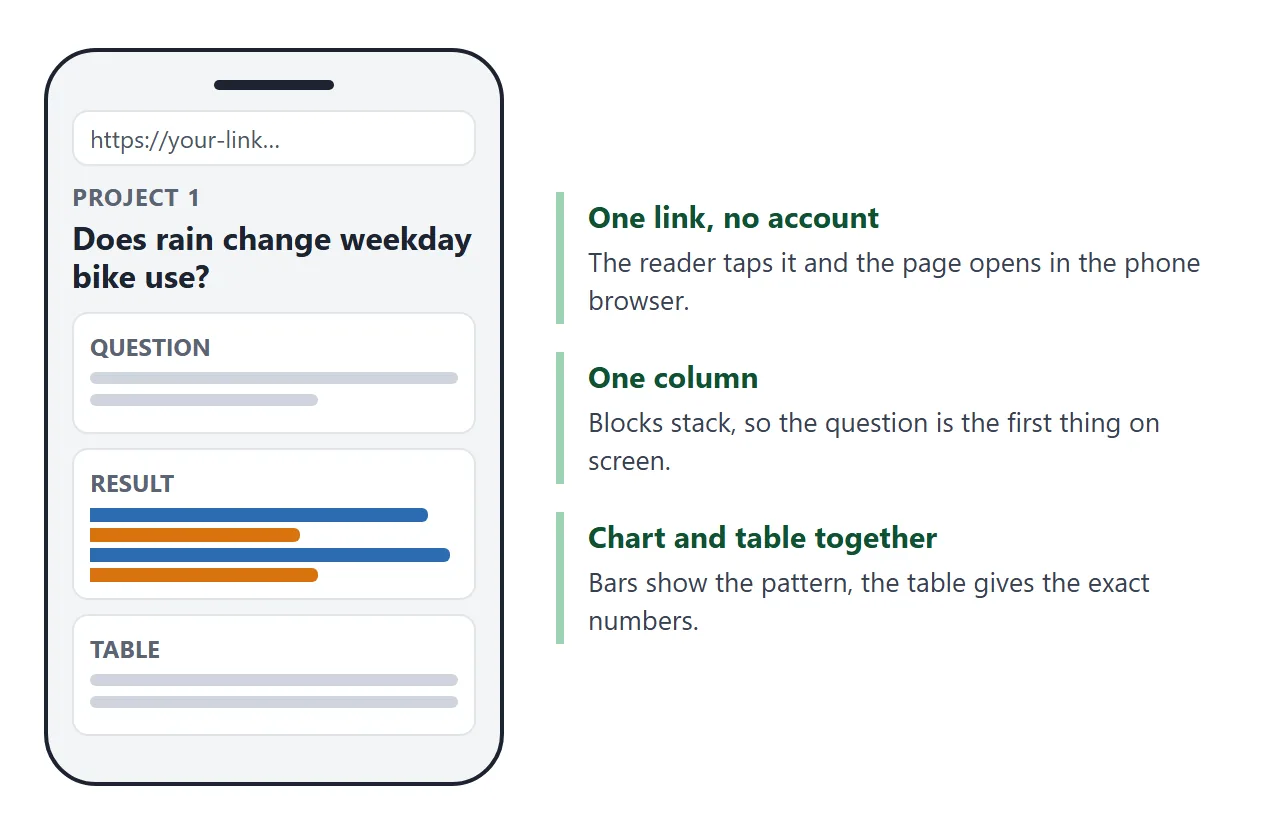
Anyone with the address can open the page in a browser, on a phone too, with no account. They can read it but not edit it. If you fix a number later, the same link shows the new version.
NOS pages cannot load data from other sites, so a CSV link will not work. Type the summary into the page, as the demo does. Turning a CSV into an HTML table shows one way.
Where to put the link
A link only helps when people see it. Use the places where someone already looks at you.
| Where | How |
|---|---|
| CV or resume | Write the address as text under each project. See resume to link |
| Featured section, add a link. LinkedIn's help says Featured can hold "links to external websites, for example your personal blog or portfolio" | |
| Paste the address in the message, not as an attachment | |
| Paper or poster | Print the address as a code. See QR code link |
| Application form | Any field that takes a web address |
On desktop, LinkedIn's Featured help page says to open your profile, add the Featured section, choose the add icon, and select the type of work sample. LinkedIn can change its menus, so follow what the page says as of October 2026.
A front page for all your projects
Once you have two or three project pages, add a front page that lists them. Each card gives the question, a one-line finding and the tool, so a reader can pick the one that interests them.
<!doctype html>
<html lang="en">
<head>
<meta charset="utf-8">
<meta name="viewport" content="width=device-width, initial-scale=1">
<title>Data analysis portfolio</title>
<style>
* { box-sizing: border-box; }
body { margin: 0; background: #f4f5f7; font-family: system-ui, -apple-system, "Segoe UI", sans-serif; color: #1d2330; line-height: 1.55; }
main { max-width: 720px; margin: 0 auto; padding: 24px 16px 32px; }
h1 { font-size: 28px; line-height: 1.2; margin: 0 0 6px; }
.sub { font-size: 16px; color: #3f4756; margin: 0 0 16px; }
.chips { display: flex; gap: 6px; flex-wrap: wrap; margin-bottom: 14px; }
.chips button { font: inherit; font-size: 14px; padding: 6px 13px; border-radius: 999px; border: 1px solid #c8cdd6; background: #fff; color: #1d2330; cursor: pointer; }
.chips button[aria-pressed="true"] { background: #1d2330; color: #fff; border-color: #1d2330; }
.card { background: #fff; border: 1px solid #e1e4ea; border-radius: 12px; padding: 16px 18px; margin-bottom: 12px; }
.card[hidden] { display: none; }
.tool { display: inline-block; font-size: 12.5px; font-weight: 700; padding: 2px 9px; border-radius: 999px; background: #e8f0fb; color: #1e4f8c; }
.card h2 { font-size: 19px; line-height: 1.3; margin: 8px 0 6px; }
.card p { margin: 0 0 8px; font-size: 16px; }
.finding { font-weight: 600; }
details { margin: 8px 0; font-size: 15px; }
summary { cursor: pointer; color: #1e4f8c; font-weight: 600; }
details ul { margin: 6px 0 0; padding-left: 20px; }
.open { display: inline-block; margin-top: 4px; font-size: 15px; font-weight: 600; color: #1e4f8c; }
.contact { font-size: 16px; margin-top: 18px; padding-top: 14px; border-top: 1px solid #dfe2e8; }
@media (max-width: 480px) { h1 { font-size: 24px; } .card { padding: 14px; } }
</style>
</head>
<body>
<main>
<h1>Your Name, data analysis portfolio</h1>
<p class="sub">Three projects. Each one starts with a question and ends with what I would do next. Sample projects, invented for this example.</p>
<div class="chips" role="group" aria-label="Filter by tool">
<button type="button" data-tool="all" aria-pressed="true">All</button>
<button type="button" data-tool="Excel" aria-pressed="false">Excel</button>
<button type="button" data-tool="SQL" aria-pressed="false">SQL</button>
<button type="button" data-tool="Python" aria-pressed="false">Python</button>
</div>
<article class="card" data-tool="Python">
<span class="tool">Python</span>
<h2>Does rain change which weekdays campus bikes get used?</h2>
<p class="finding">Rainy days had 36% to 43% fewer rentals on every weekday in the sample.</p>
<details>
<summary>How I did it</summary>
<ul><li>Counted rentals per day, joined a rain flag.</li><li>Averaged each weekday for dry and rainy days.</li></ul>
</details>
<a class="open" href="#">Read the full project page →</a>
</article>
<article class="card" data-tool="SQL">
<span class="tool">SQL</span>
<h2>Which library branches are busiest after 6 pm?</h2>
<p class="finding">Two of five branches account for most evening visits.</p>
<details>
<summary>How I did it</summary>
<ul><li>Grouped visit logs by branch and hour.</li><li>Ranked branches by evening share.</li></ul>
</details>
<a class="open" href="#">Read the full project page →</a>
</article>
<article class="card" data-tool="Excel">
<span class="tool">Excel</span>
<h2>Where does a student budget leak money each month?</h2>
<p class="finding">Food delivery was the largest category that could be cut.</p>
<details>
<summary>How I did it</summary>
<ul><li>Categorised 3 months of transactions.</li><li>Built a pivot table and a bar chart.</li></ul>
</details>
<a class="open" href="#">Read the full project page →</a>
</article>
<p class="contact"><b>Contact:</b> your.name@example.com (written out, so it can be copied)</p>
</main>
<script>
const chips = document.querySelectorAll('.chips button');
const cards = document.querySelectorAll('.card');
chips.forEach((chip) => {
chip.addEventListener('click', () => {
const tool = chip.dataset.tool;
chips.forEach((c) => c.setAttribute('aria-pressed', c === chip));
cards.forEach((card) => { card.hidden = tool !== 'all' && card.dataset.tool !== tool; });
});
});
</script>
</body>
</html>
The links in the demo go nowhere on purpose. On your page each one points to the address of a project page. For more on what to include besides projects, see a student portfolio.
When it does not work
| Symptom | Cause | Fix |
|---|---|---|
| The chart is missing | The AI used a chart library or image from another site | Ask for plain HTML and CSS bars, no external scripts |
| A number differs from your notebook | The AI rewrote your table | Paste your numbers again and say "use these exactly" |
| The page loads no data file | A page cannot fetch files from other sites | Put the summary table in the page itself |
| The reader cannot click your GitHub address | It is only on the page as a button | Show the address as text too |
| The text is tiny on a phone | The page has no one-column layout | Ask for one column with 16px text |
| You corrected a number and the link shows the old one | The old code is still in the document | Edit the document. The same link then shows the change |
Keep client, employer or personal data off the page. Anyone who has the link can open it, and a shared page has no password.