An HTML bar chart without JavaScript is a handful of divs and a width percentage, and this prompt produces one along with stacked bars and inline SVG lines, with nothing loaded from another address.
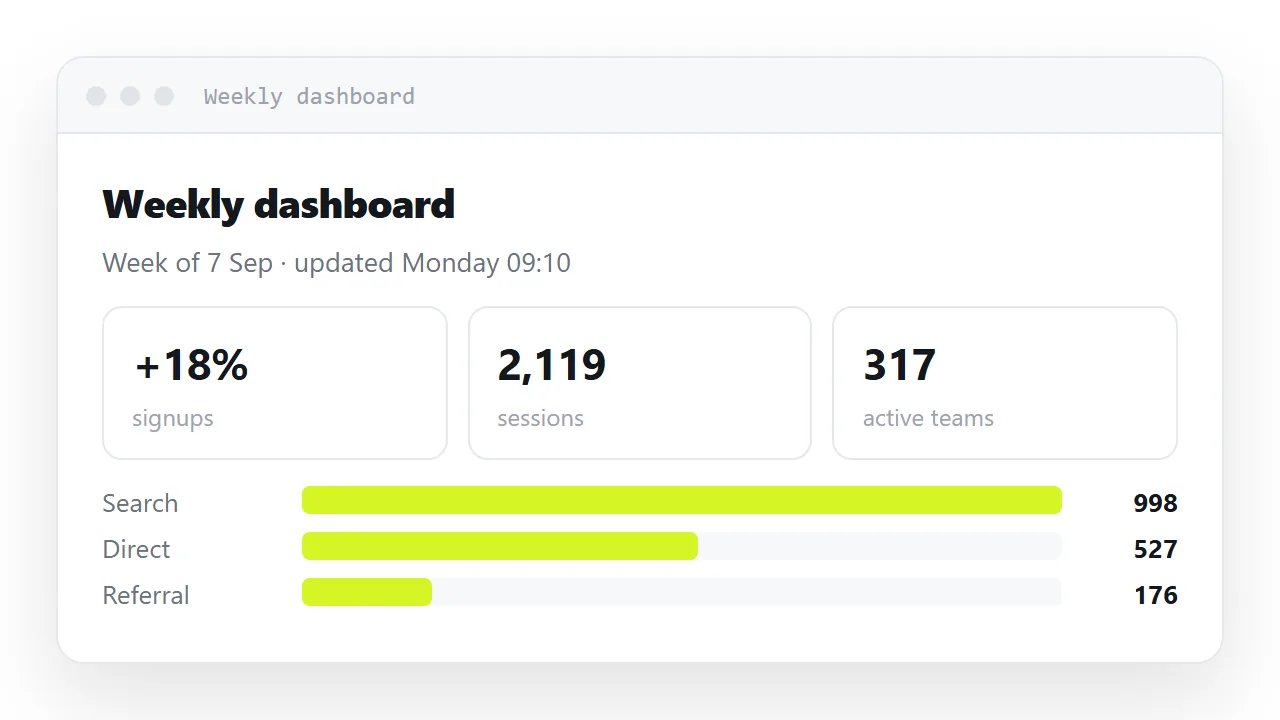
A generated chart that pulls a library from elsewhere is a page with an expiry date; nothing about it says so, and the day it expires it is simply blank.
The prompt also names the single trap that wastes the most time, a bar built from an inline element, which has no width and no error message.
This guide gives the prompt, the reasoning for each part, what each chart type needs, and the four steps to share the chart as a page.
A generated chart that loads a library from an outside address is a page with an expiry date. Nothing about it says so, and the day it expires it is simply blank.
The prompt for an HTML bar chart without JavaScript
Build one complete, self-contained HTML file with charts.

NO LIBRARIES. Charts are built from plain HTML/CSS or inline SVG.

BAR CHARTS
- each row: grid with a 130px label, a flexible track, a 62px value
- the track is a div; the bar inside it is a div with display:block,
  height:100%, and a width percentage
- overflow:hidden on the track so rounded corners clip
- show the value as text as well as bar width

LINE / SCATTER
- inline <svg> with a viewBox, no width/height attributes
- stroke colours from CSS variables so dark mode works
- a <title> element inside the svg for screen readers

ACCESSIBILITY
- wrap each chart in <figure role="group" aria-label="...">
  where the label states the actual values
- a <figcaption> stating the period and the base number

STYLE
- one accent colour for the highlighted series, grey for the rest
- numbers right-aligned, font-variant-numeric: tabular-nums
- readable at 360px wide
Why each part is there
"display: block on the bar"
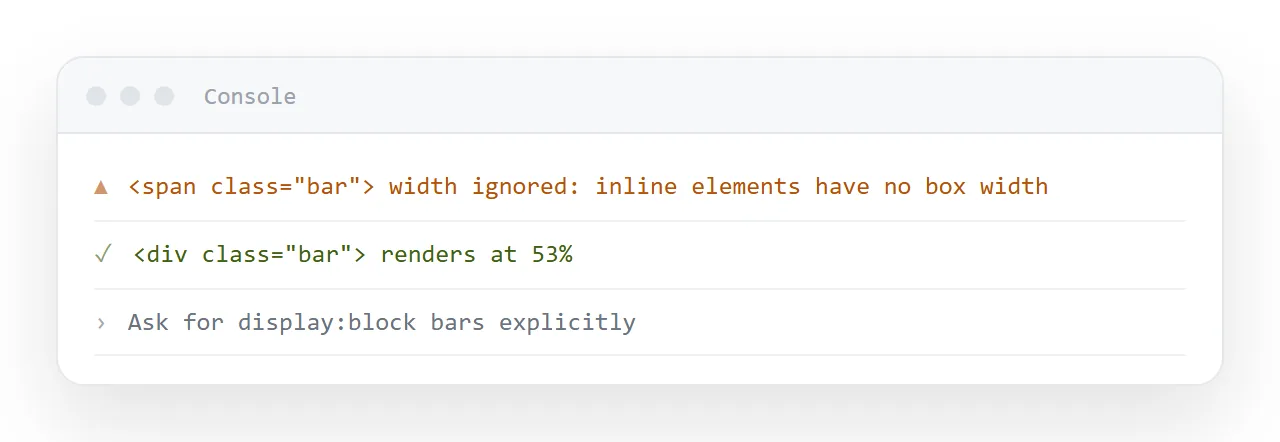
The single most important line. A bar built from a span does not appear at all, because inline elements ignore width and height — and nothing reports an error. You get an empty chart and no explanation, which is the most time-wasting failure in this whole area.
.track { height: 20px; background: #f4f4f5; border-radius: 6px; overflow: hidden; }
.fill  { display: block; height: 100%; background: #2a78d6; border-radius: 6px; }
"Show the value as text as well"
The bar conveys magnitude; the text conveys the number. A reader who wants to copy a figure into their own notes needs the text, and a screen reader has nothing else to read.
"viewBox, no width/height attributes"
<svg viewBox="0 0 720 200" xmlns="http://www.w3.org/2000/svg">
A viewBox with no fixed dimensions lets the SVG scale to whatever container it sits in, so the chart works at 360px and at 1400px from the same markup. Fixed attributes lock it to one size. See SVG in HTML.
"Stroke colours from CSS variables"
<line stroke="var(--line)" ... />
An SVG with hard-coded colours stays light-themed when the page goes dark, which looks like a mistake. Variables let the chart follow the page. See dark mode CSS.
"aria-label stating the actual values"
<figure role="group" aria-label="Signups by source: search 998, direct 527, shared links 418">
alt="bar chart" conveys nothing. The values do. This is the difference between a chart that is readable without sight and one that is not.
"A figcaption with the period and the base"
Signups by source, week of 7 Sep. Total 2,119. Without the base number no proportion in the chart can be interpreted, and without the period nobody knows whether it is current.
Changing the prompt for your own chart
Say what the data is, the unit, the period, and which series should be highlighted. Say the largest value should be the 100% bar so the rest scale against it.
If the chart will be updated, add "put the values in one DATA array and compute the widths from it", and then next week's update is numbers only. Leave the display:block line and the accessibility block exactly as written.
When a library is the right call
Multi-series plots with hover tooltips, zooming, brushing, thousands of points. Hand-writing that is a waste of a day.
If you use one, embed it in the file rather than referencing an address. The page then keeps working regardless of what happens to the library's hosting, which is the whole point.
A stacked bar, since it comes up
<div class="stack">
  <i style="width:47%;background:#2a78d6"></i>
  <i style="width:25%;background:#eb6834"></i>
  <i style="width:20%;background:#1baf7a"></i>
  <i style="width:8%;background:#eda100"></i>
</div>
.stack { display: flex; height: 22px; border-radius: 6px; overflow: hidden; }
.stack i { display: block; }
A flex row of blocks with percentage widths. Three lines of CSS, works everywhere, and there is nothing to load.
After it renders
Check it in the HTML viewer at both widths, then publish it so the numbers stay copyable and correctable rather than being sent as a screenshot.
What each chart type needs
| Chart | Built from | Watch for |
|---|---|---|
| Horizontal bars | Divs with percentage widths | The bar must be display: block |
| Stacked bar | A flex row of blocks | Same |
| Progress rows | Same as bars, with a label column | Align the value column |
| Line or scatter | Inline SVG with a viewBox |
No fixed width/height attributes |
| Donut | SVG circle with stroke-dasharray |
Hard to read precisely; a bar is usually better |
| Sparkline | SVG polyline |
Give it an accessible label with the values |
Nothing on that list needs a library. The two "watch for" items in the top half are the same trap, and it accounts for most empty-looking generated charts.
Checking it after it renders
Check it at 360px wide and with the console open — see generated HTML not rendering for what a blank chart usually means.
Then publish the page rather than screenshotting it. A picture of a chart removes the numbers, the sorting and the currency all at once, which is the whole value of having made the chart.
From the prompt to a shared chart: 4 steps
- Paste the prompt and describe the series. Keep NO LIBRARIES and the
display: blockline. Name the series, the unit, the period, and which one to highlight. - Check that the bars are visible and the values are text. An empty track beside a correct number means an inline bar. A value you cannot select means it was drawn as pixels. The HTML viewer shows both at once.
- State the denominator and the period in the caption.
998 of 2,119 (47%), week of 7 Sep. Without them the chart cannot be checked, and a chart that cannot be checked does not get argued with. - Publish the chart and copy its address. Share, then Share link, then Create link. Next week, type over the values and the widths; the link you sent stays the current chart. Turning HTML into a link is this step.