A data analyst portfolio website can be one HTML page with three case studies, each with its finding written as text. A post on The Data Hustle puts the hosting question simply: "Use GitHub Pages (free), Wix, or just a simple HTML site. Doesn't need to be fancy."
For a student with few job titles to list, the three projects are the evidence. They sit in notebooks and spreadsheets, which are hard to hand to someone who will not install anything. Written as a page, the same work opens in a browser.
Here is a sample. Three projects, every number invented. Click a tool name to filter the cards.
<!doctype html>
<html lang="en">
<head>
<meta charset="utf-8">
<meta name="viewport" content="width=device-width, initial-scale=1">
<title>Alex Sample - Data Analyst Portfolio</title>
<style>
* { box-sizing: border-box; }
body { margin: 0; font-family: system-ui, "Segoe UI", sans-serif; color: #1c2430; background: #f5f6f8; line-height: 1.5; }
.wrap { max-width: 760px; margin: 0 auto; padding: 20px 16px 36px; }
header h1 { margin: 0; font-size: 26px; }
header p { margin: 4px 0 0; color: #4a5565; }
.note { margin: 14px 0 0; padding: 8px 12px; background: #fff8e1; border-left: 4px solid #e0a800; font-size: 13px; color: #5c4a00; }
.filters { display: flex; flex-wrap: wrap; gap: 8px; margin: 18px 0 6px; }
.filters button { font: inherit; font-size: 14px; padding: 6px 14px; border: 1px solid #b9c1cc; border-radius: 999px; background: #fff; color: #1c2430; cursor: pointer; }
.filters button[aria-pressed="true"] { background: #1d4ed8; border-color: #1d4ed8; color: #fff; }
.card { background: #fff; border: 1px solid #e1e4ea; border-radius: 12px; padding: 16px 18px; margin-top: 14px; }
.card h2 { margin: 0 0 2px; font-size: 19px; }
.tags { font-size: 12.5px; color: #4a5565; margin-bottom: 10px; }
.card h3 { margin: 12px 0 2px; font-size: 12.5px; letter-spacing: .04em; text-transform: uppercase; color: #1d4ed8; }
.card p { margin: 0; font-size: 15px; }
.finding { background: #eef3ff; border-radius: 8px; padding: 10px 12px; margin-top: 12px; font-size: 15px; }
.scroll { overflow-x: auto; margin-top: 8px; }
table { border-collapse: collapse; width: 100%; font-size: 14px; }
caption { text-align: left; font-size: 13px; color: #4a5565; padding-bottom: 4px; }
th, td { text-align: left; padding: 6px 10px; border-bottom: 1px solid #e1e4ea; }
th { background: #f5f6f8; }
td.n, th.n { text-align: right; }
svg { display: block; width: 100%; height: auto; max-width: 440px; margin-top: 8px; }
footer { margin-top: 20px; font-size: 13px; color: #4a5565; }
</style>
</head>
<body>
<div class="wrap">
<header>
<h1>Alex Sample</h1>
<p>Data analyst. Three projects, each with a question, a method and what I found.</p>
<div class="note">Sample page. Every number below is invented for this example.</div>
</header>
<div class="filters" role="group" aria-label="Filter projects by tool">
<button type="button" data-tool="all" aria-pressed="true">All three</button>
<button type="button" data-tool="sql" aria-pressed="false">SQL</button>
<button type="button" data-tool="python" aria-pressed="false">Python</button>
<button type="button" data-tool="excel" aria-pressed="false">Excel</button>
</div>
<article class="card" data-tools="sql excel">
<h2>1. When does the campus cafe sell the most?</h2>
<div class="tags">Tools: SQL, Excel · 8,210 sales over 4 weeks</div>
<h3>Question</h3>
<p>Which hours of the day need the most staff?</p>
<h3>Finding</h3>
<div class="finding"><b>38% of all drinks (3,120 of 8,210) were sold between 11:00 and 13:00.</b> The next busiest block, 13:00 to 15:00, sold 1,920 (23%).</div>
<svg viewBox="0 0 440 150" role="img" aria-labelledby="c1t">
<title id="c1t">Drinks sold by time block: 7 to 9 is 1,480; 9 to 11 is 1,690; 11 to 13 is 3,120; 13 to 15 is 1,920.</title>
<g font-size="12" fill="#1c2430">
<text x="0" y="22">07-09</text><rect x="52" y="9" width="102" height="20" fill="#aab4c3"/><text x="160" y="24">1,480</text>
<text x="0" y="62">09-11</text><rect x="52" y="49" width="117" height="20" fill="#aab4c3"/><text x="175" y="64">1,690</text>
<text x="0" y="102">11-13</text><rect x="52" y="89" width="216" height="20" fill="#1d4ed8"/><text x="274" y="104" font-weight="700">3,120</text>
<text x="0" y="142">13-15</text><rect x="52" y="129" width="133" height="20" fill="#aab4c3"/><text x="191" y="144">1,920</text>
</g>
</svg>
<h3>Recommendation</h3>
<p>Move one shift start from 08:00 to 10:30 and test it for two weeks.</p>
<h3>Limits</h3>
<p>Four weeks of term time only. Exam weeks may look different.</p>
</article>
<article class="card" data-tools="python">
<h2>2. Do members and casual riders ride differently?</h2>
<div class="tags">Tools: Python (pandas) · 24,500 bike-share trips</div>
<h3>Question</h3>
<p>Are the two rider types using the bikes for different things?</p>
<h3>Finding</h3>
<div class="finding"><b>Casual riders ride more than twice as long (median 21 vs 9 minutes) and 54% of their trips are on weekends, against 22% for members.</b></div>
<div class="scroll">
<table>
<caption>Trips by rider type (sample numbers)</caption>
<thead><tr><th scope="col">Rider type</th><th scope="col" class="n">Trips</th><th scope="col" class="n">Median minutes</th><th scope="col" class="n">Weekend share</th></tr></thead>
<tbody>
<tr><th scope="row">Member</th><td class="n">18,400</td><td class="n">9</td><td class="n">22%</td></tr>
<tr><th scope="row">Casual</th><td class="n">6,100</td><td class="n">21</td><td class="n">54%</td></tr>
</tbody>
</table>
</div>
<h3>Recommendation</h3>
<p>Trial a weekend day pass aimed at casual riders.</p>
<h3>Limits</h3>
<p>One city, one season. Trip length does not say why people rode.</p>
</article>
<article class="card" data-tools="excel sql">
<h2>3. What do students say is wrong with study spaces?</h2>
<div class="tags">Tools: Excel, SQL · 212 survey responses</div>
<h3>Question</h3>
<p>What is the main problem students report when they study on campus?</p>
<h3>Finding</h3>
<div class="finding"><b>Noise was the main problem for 64% of respondents (136 of 212).</b> Seats came second at 41 responses.</div>
<div class="scroll">
<table>
<caption>Main problem reported, one answer per student (sample numbers)</caption>
<thead><tr><th scope="col">Problem</th><th scope="col" class="n">Responses</th></tr></thead>
<tbody>
<tr><th scope="row">Noise</th><td class="n">136</td></tr>
<tr><th scope="row">Not enough seats</th><td class="n">41</td></tr>
<tr><th scope="row">Power sockets</th><td class="n">22</td></tr>
<tr><th scope="row">Other</th><td class="n">13</td></tr>
</tbody>
</table>
</div>
<h3>Recommendation</h3>
<p>Mark one floor as quiet and ask the same question again next term.</p>
<h3>Limits</h3>
<p>Only two buildings were surveyed, and respondents chose to answer.</p>
</article>
<footer>Code and cleaned data: github.com/alex-sample/portfolio (sample address)</footer>
</div>
<script>
const buttons = document.querySelectorAll('.filters button');
const cards = document.querySelectorAll('.card');
buttons.forEach((btn) => {
btn.addEventListener('click', () => {
const tool = btn.dataset.tool;
buttons.forEach((b) => b.setAttribute('aria-pressed', String(b === btn)));
cards.forEach((card) => {
const tools = card.dataset.tools.split(' ');
card.hidden = tool !== 'all' && !tools.includes(tool);
});
});
});
</script>
</body>
</html>
What goes on a case study page
Give every project the same six parts in the same order. A reader who has seen the first one then knows where to look in the other two.
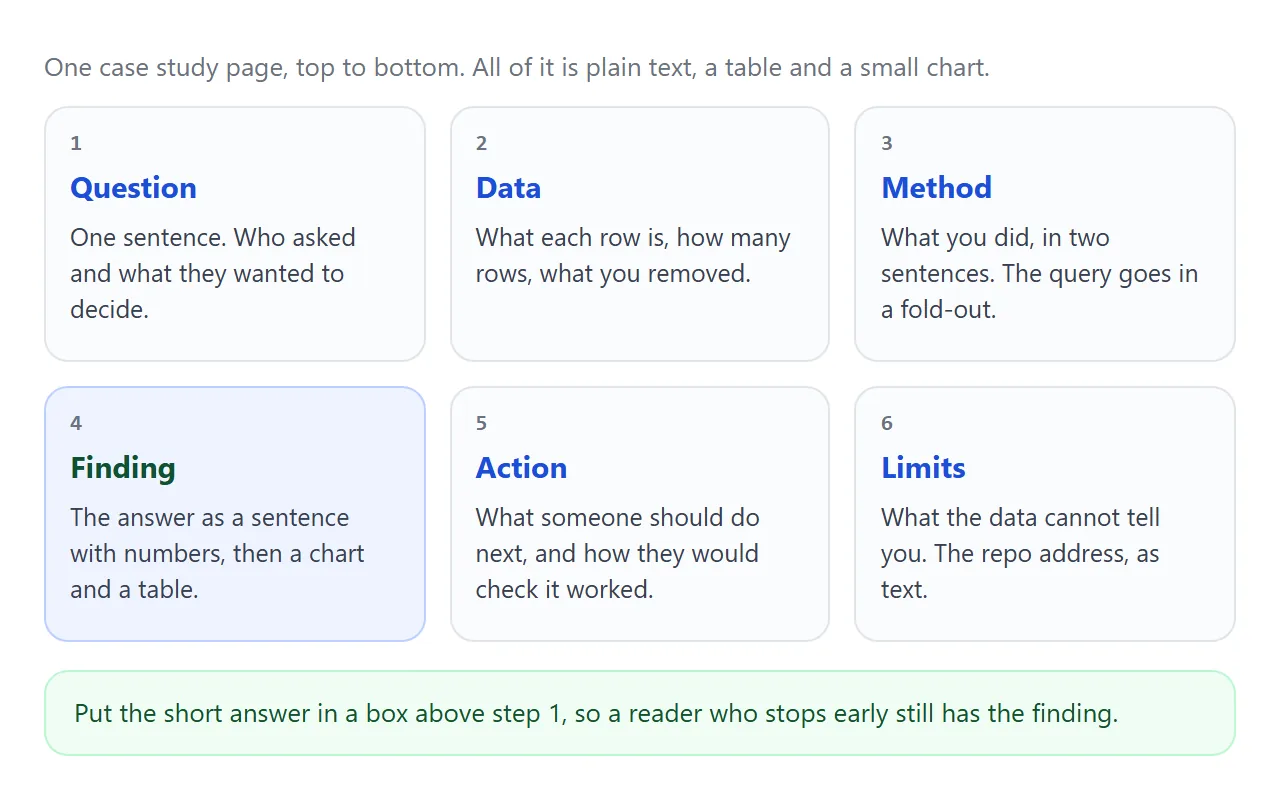
- Question. One sentence: who asked, and what they wanted to decide.
- Data. What one row is, how many rows, and what you removed.
- Method. Two sentences on what you did. The query can sit in a fold-out.
- Finding. The answer as a sentence with numbers, then a chart and a table.
- Recommendation. What someone should do, and how they would check it worked.
- Limits. What the data cannot tell you.
The same post asks each project to state the problem in one sentence and to end with what someone should do about it. Here is one project written out in full:
<!doctype html>
<html lang="en">
<head>
<meta charset="utf-8">
<meta name="viewport" content="width=device-width, initial-scale=1">
<title>Case study: When does the campus cafe sell the most?</title>
<style>
* { box-sizing: border-box; }
body { margin: 0; font-family: Georgia, "Times New Roman", serif; color: #1c2430; background: #fff; line-height: 1.6; }
.wrap { max-width: 680px; margin: 0 auto; padding: 22px 16px 40px; }
.kicker { font: 600 12.5px system-ui, sans-serif; letter-spacing: .06em; text-transform: uppercase; color: #1d4ed8; }
h1 { margin: 4px 0 6px; font-size: 28px; line-height: 1.2; }
.meta { font: 13.5px system-ui, sans-serif; color: #4a5565; }
.summary { margin: 18px 0; padding: 14px 16px; background: #eef3ff; border-radius: 10px; font-size: 17px; }
h2 { font: 700 17px system-ui, sans-serif; margin: 26px 0 4px; }
p { margin: 6px 0; font-size: 16.5px; }
figure { margin: 14px 0; }
figcaption { font: 13.5px system-ui, sans-serif; color: #4a5565; margin-top: 4px; }
svg { display: block; width: 100%; height: auto; max-width: 480px; }
.scroll { overflow-x: auto; }
table { border-collapse: collapse; width: 100%; font: 14.5px system-ui, sans-serif; }
caption { text-align: left; color: #4a5565; padding-bottom: 4px; font-size: 13.5px; }
th, td { text-align: left; padding: 6px 10px; border-bottom: 1px solid #e1e4ea; }
th { background: #f5f6f8; }
.n { text-align: right; }
tr.hl th, tr.hl td { background: #eef3ff; font-weight: 700; }
details { margin: 10px 0; font: 15px system-ui, sans-serif; }
summary { cursor: pointer; font-weight: 600; padding: 4px 0; }
pre { margin: 6px 0 0; padding: 12px; background: #f5f6f8; border-radius: 8px; overflow-x: auto; font: 13px/1.5 ui-monospace, Consolas, monospace; }
.note { font: 13px system-ui, sans-serif; color: #5c4a00; background: #fff8e1; border-left: 4px solid #e0a800; padding: 8px 12px; margin-top: 16px; }
</style>
</head>
<body>
<main class="wrap">
<div class="kicker">Case study 1 of 3 · SQL, Excel</div>
<h1>When does the campus cafe sell the most?</h1>
<div class="meta">Alex Sample · 4 weeks of till data, 8,210 sales</div>
<p class="summary"><b>Short answer:</b> 38% of all drinks were sold between 11:00 and 13:00, so that is where an extra pair of hands helps most.</p>
<h2>The question</h2>
<p>The cafe manager wanted to know which hours need the most staff. Shifts were set once a term and nobody had checked them against sales.</p>
<h2>The data</h2>
<p>One row per drink sold: date, hour of the day, item. I removed 37 test rows from the till setup week and kept 8,210 sales. Closing hours were 07:00 to 15:00.</p>
<h2>The method</h2>
<p>I grouped sales into four two-hour blocks and counted drinks in each block.</p>
<details>
<summary>Show the SQL</summary>
<pre>SELECT
CASE
WHEN hour BETWEEN 7 AND 8 THEN '07-09'
WHEN hour BETWEEN 9 AND 10 THEN '09-11'
WHEN hour BETWEEN 11 AND 12 THEN '11-13'
ELSE '13-15'
END AS block,
COUNT(*) AS drinks
FROM sales
GROUP BY block
ORDER BY block;</pre>
</details>
<h2>What I found</h2>
<p>The 11:00 to 13:00 block sold 3,120 drinks, about 1.6 times the next busiest block (1,920).</p>
<figure>
<svg viewBox="0 0 480 150" role="img" aria-labelledby="ct">
<title id="ct">Bar chart of drinks sold by time block. 07-09: 1,480. 09-11: 1,690. 11-13: 3,120. 13-15: 1,920.</title>
<g font-family="system-ui, sans-serif" font-size="12.5" fill="#1c2430">
<text x="0" y="22">07-09</text><rect x="54" y="9" width="110" height="20" fill="#aab4c3"/><text x="170" y="24">1,480</text>
<text x="0" y="62">09-11</text><rect x="54" y="49" width="126" height="20" fill="#aab4c3"/><text x="186" y="64">1,690</text>
<text x="0" y="102">11-13</text><rect x="54" y="89" width="232" height="20" fill="#1d4ed8"/><text x="292" y="104" font-weight="700">3,120</text>
<text x="0" y="142">13-15</text><rect x="54" y="129" width="143" height="20" fill="#aab4c3"/><text x="203" y="144">1,920</text>
</g>
</svg>
<figcaption>Figure 1. Drinks sold by two-hour block. The lunch block is the tallest by a wide margin.</figcaption>
</figure>
<div class="scroll">
<table>
<caption>The same numbers as a table (sample data)</caption>
<thead><tr><th scope="col">Time block</th><th scope="col" class="n">Drinks</th><th scope="col" class="n">Share</th></tr></thead>
<tbody>
<tr><th scope="row">07:00-09:00</th><td class="n">1,480</td><td class="n">18%</td></tr>
<tr><th scope="row">09:00-11:00</th><td class="n">1,690</td><td class="n">21%</td></tr>
<tr class="hl"><th scope="row">11:00-13:00</th><td class="n">3,120</td><td class="n">38%</td></tr>
<tr><th scope="row">13:00-15:00</th><td class="n">1,920</td><td class="n">23%</td></tr>
</tbody>
</table>
</div>
<h2>What I would do</h2>
<p>Move one shift start from 08:00 to 10:30, then compare queue times over two weeks. If the lunch block stays busy, make the change permanent.</p>
<h2>What this does not show</h2>
<p>Four weeks of term time cannot show exam weeks or holidays. The till records drinks, not how long people waited, so the staffing change is a test and not a proven fix.</p>
<h2>Code and data</h2>
<p>Cleaned data and the full query: github.com/alex-sample/cafe-hours (sample address).</p>
<div class="note">Sample page. Every number is invented for this example.</div>
</main>
</body>
</html>
Write the findings as text, not an embedded dashboard
If a dashboard lives on another site, showing it on your page takes an embed or a fetch from that site. In a shared NOS page, iframes, images from other sites and fetch calls to other sites are blocked.
The box stays empty, and the reader sees no finding.
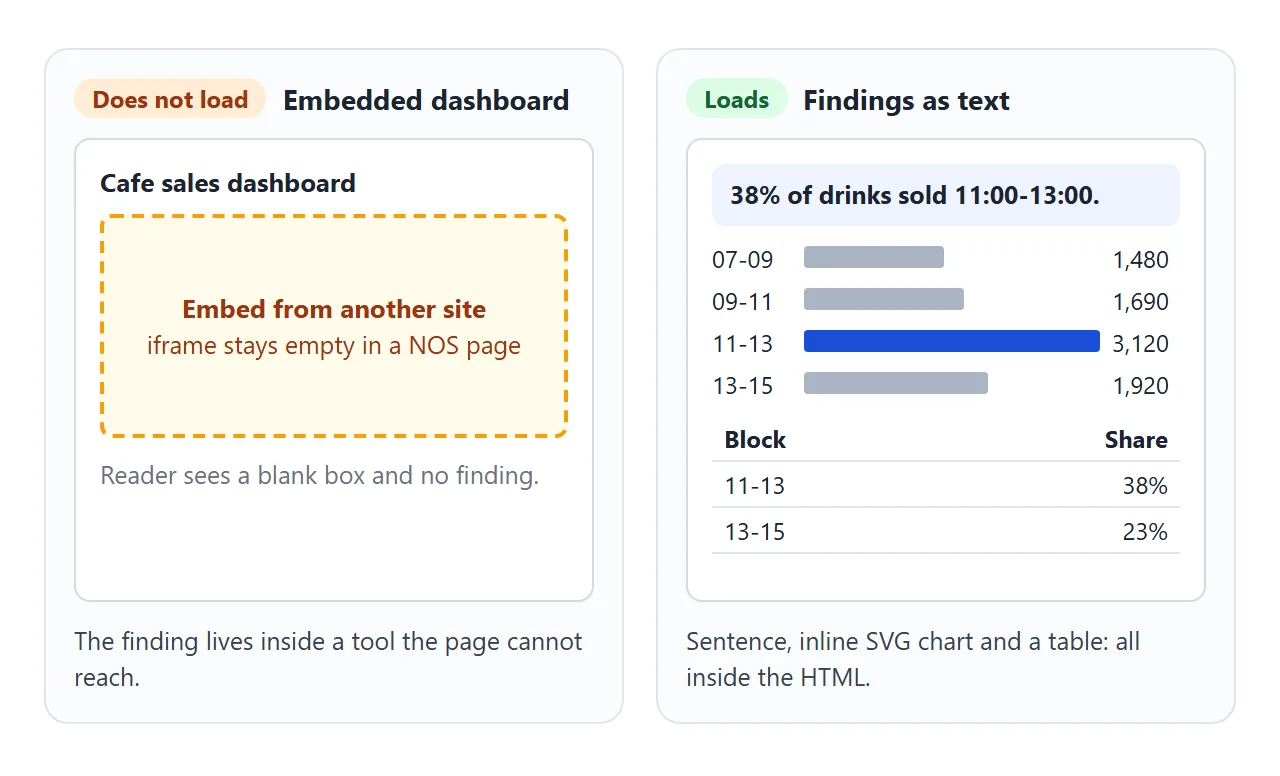
Move the finding into the page itself. The sentence comes first, so it is read first. The numbers go in an HTML table, which MDN describes as the element for tabular data. A caption on the table says what it shows.
Draw the chart as inline SVG and give it a title element, which MDN says gives the graphic an accessible name. Wrap the chart and its caption in figure and figcaption, so they stay together.
| Piece of the page | In a shared NOS page | What to do |
|---|---|---|
| Finding as a sentence | Loads | Put it first, with numbers |
| Table of numbers | Loads | Copy the final numbers into the rows |
| Chart drawn as inline SVG | Loads | Ask the AI to draw the bars |
| Chart library from cdn.jsdelivr.net | Loads | Needs the numbers inside the page too |
| Dashboard in an iframe | Blocked | Describe it and give the key numbers |
| Image hosted elsewhere | Blocked | Redraw it as SVG |
| CSV fetched from another site | Blocked | Paste the numbers into the page |
| Contact form that posts to a server | Blocked | Write your email address as text |
Make it with AI
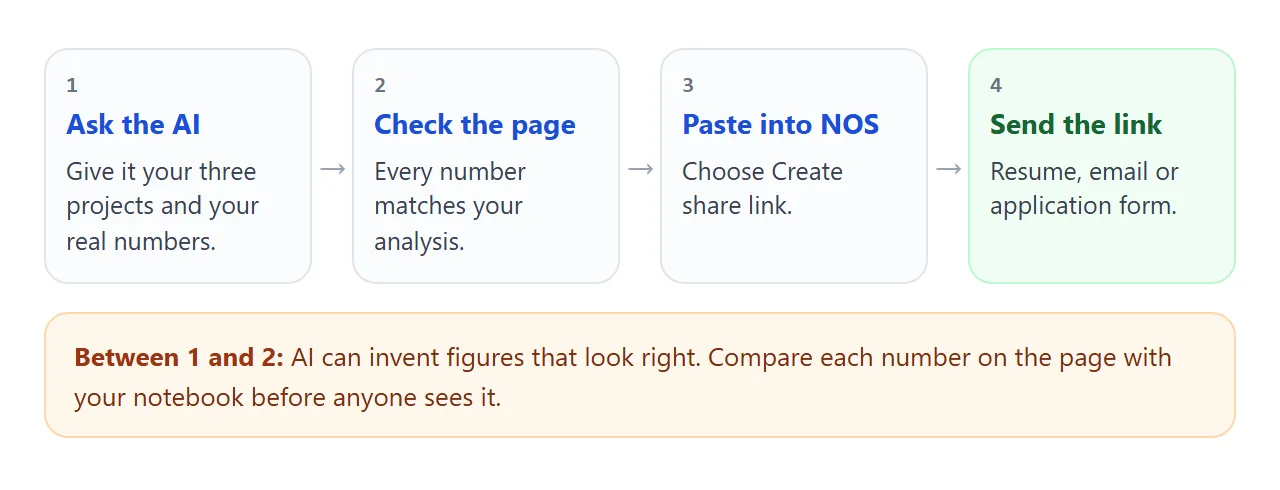
Paste this into ChatGPT, Claude or Gemini. Fill in the brackets with your real projects and numbers.
Build one self-contained HTML page: a data analyst
portfolio with three case studies.

Rules:
- One file. No external images, no iframes, no fetch,
  no embedded dashboards.
- Mobile friendly, with a viewport meta tag.
- Headings for each project: Question, Data, Method,
  Finding, Recommendation, Limits.
- Finding: one bold sentence with numbers, then a small
  bar chart as inline SVG with a title element, then an
  HTML table with a caption and th scope attributes.
- Use ONLY the numbers I give you. If a number is
  missing, write [MISSING] instead of guessing.

Header: [my name], [one line on what I analyse].
Project 1: [question], [data and row count], [tools],
[method], [finding with numbers], [recommendation],
[limits].
Project 2: same fields.
Project 3: same fields.
Footer: [repository address] and [my email], as text.
Then check the result before you share it:
- Every number. Compare each figure with your notebook. A model can write a believable number you never gave it.
- The chart. Each bar must equal the matching table row.
- Leftovers. Search the page for the word MISSING, for lorem ipsum and for buttons that point nowhere.
- A phone. Open it at phone width. A wide table needs a scrolling box. Fixing AI HTML on a phone covers it.
Send it as a link
Paste the finished HTML into a NOS document, open Share and choose Create share link. HTML to link walks through it. The page renders as written.
Anyone with the link can open it in a browser, a phone included, with no account. They cannot edit it.
If you fix a number or add a fourth project later, edit the code in your NOS document. The same link then shows the new version, so the address on your resume never goes stale.
Put the link in the header of your resume as plain text. Linking a portfolio in a resume covers wording and placement. If your projects are thin so far, student portfolio suggests what to show.
Click every link on the page from the share link itself, and open it on a phone once. That catches a wrong repository address before a reader does. If the analysis lives in a notebook, Jupyter notebook link covers sharing it too.
Two ways to publish it
| GitHub Pages | NOS share link | |
|---|---|---|
| What it is | A static site hosting service that publishes HTML, CSS and JavaScript files from a GitHub repository | HTML pasted into a document, shared with Create share link |
| Good fit when | Your project already lives in a repository and you want the site built from it | You have one finished page and want a link today |
| Details | Host HTML on GitHub Pages | HTML to link |
GitHub's description is as of October 2026, and plans and limits can change. Check their documentation before you rely on a detail.
When it does not work
| What you see | Cause | Fix |
|---|---|---|
| A blank box where the chart should be | The chart is an iframe embed or an image hosted elsewhere | Rebuild it as inline SVG plus a table |
| Chart or table is empty | The page tries to fetch a CSV from another site | Put the numbers into the HTML |
| Page looks tiny on a phone | No viewport meta tag | Add it, or ask the AI for a mobile friendly page |
| Table runs off the screen | Too many columns for a narrow screen | Wrap it in a box with overflow-x: auto |
| The repository link goes nowhere | The AI guessed the address | Replace it and click it from the share link |
| Numbers differ from your notebook | The AI filled a gap | Re-run the prompt with MISSING and re-check |
| A contact form does nothing | Sending a form to a server is blocked | Write your email address as text |
A portfolio like this is mostly writing, so keep the design plain and spend your time on the sentences and the numbers. If a project is a dashboard you built in plain HTML, sharing an HTML dashboard as a link covers that case.