In ECharts, formatter is the option that decides what text a tooltip, an axis tick or a data label shows. It takes a template string such as '{b}: {c}' or a function.
This is a chart option, not an HTML code formatter. For tidying markup, see formatting HTML.
ECharts is a charting library for the browser, so one HTML file is enough: a script tag, a <div> with a height, and two calls. Hover or tap a bar below.
<!doctype html>
<html lang="en">
<head>
<meta charset="utf-8">
<meta name="viewport" content="width=device-width, initial-scale=1">
<title>ECharts formatter basics</title>
<style>
  body { margin: 0; padding: 12px; font-family: system-ui, sans-serif; background: #fff; color: #1d2330; }
  h1 { font-size: 16px; margin: 0 0 6px; }
  /* the container must have a width and a height before echarts.init runs */
  #chart { width: 100%; height: 260px; }
  p { margin: 6px 0 0; font-size: 13px; color: #555; }
</style>
</head>
<body>
<h1>Monthly revenue</h1>
<div id="chart"></div>
<p>Tap or hover a bar: the tooltip text comes from <code>tooltip.formatter</code>.</p>

<script src="https://cdn.jsdelivr.net/npm/echarts@6.1.0/dist/echarts.min.js"></script>
<script>
  // svg renderer: labels stay real text, sharp at any zoom
  const chart = echarts.init(document.getElementById('chart'), null, { renderer: 'svg' });

  chart.setOption({
    grid: { left: 56, right: 16, top: 16, bottom: 28 },
    tooltip: {
      trigger: 'axis',
      confine: true,
      formatter: '{b0}: ${c0}'  // string template: {b0} = category, {c0} = value
    },
    xAxis: { type: 'category', data: ['Jan', 'Feb', 'Mar', 'Apr', 'May', 'Jun'] },
    yAxis: {
      type: 'value',
      axisLabel: { formatter: '${value}' }  // {value} = the label ECharts would draw
    },
    series: [{ name: 'Revenue', type: 'bar', data: [1200, 1850, 2400, 1900, 3100, 2750] }]
  });

  window.addEventListener('resize', () => chart.resize());
</script>
</body>
</html>
The four pieces of a one-file chart
- Load the library. One script tag pointing at
dist/echarts.min.json jsDelivr. It adds a global calledecharts. - Size the container. A
<div>with a width and a height in CSS. - Create the chart.
echarts.init(div)returns a chart object. - Give it an option.
chart.setOption({ ... })with axes, series and your formatters.
<div id="chart" style="width:100%;height:280px"></div>
<script src="https://cdn.jsdelivr.net/npm/echarts@6.1.0/dist/echarts.min.js"></script>
<script>
  const chart = echarts.init(document.getElementById('chart'));
  chart.setOption({ /* axes, series, formatters */ });
</script>
Scripts run from top to bottom, so the script tag has to come before the code that uses echarts.
The demos pin version 6.1.0, the latest release on jsDelivr when this was written. A URL with no version loads whatever is newest, which jsDelivr does not recommend for production. ECharts is released under the Apache License 2.0.
The demos pass { renderer: 'svg' } as the third argument. ECharts has offered an SVG renderer since v4.0, and SVG text does not blur when you zoom in. Leave the argument out to get the default renderer.
Where a formatter goes
The same option name appears in three places, and each one controls a different piece of text.
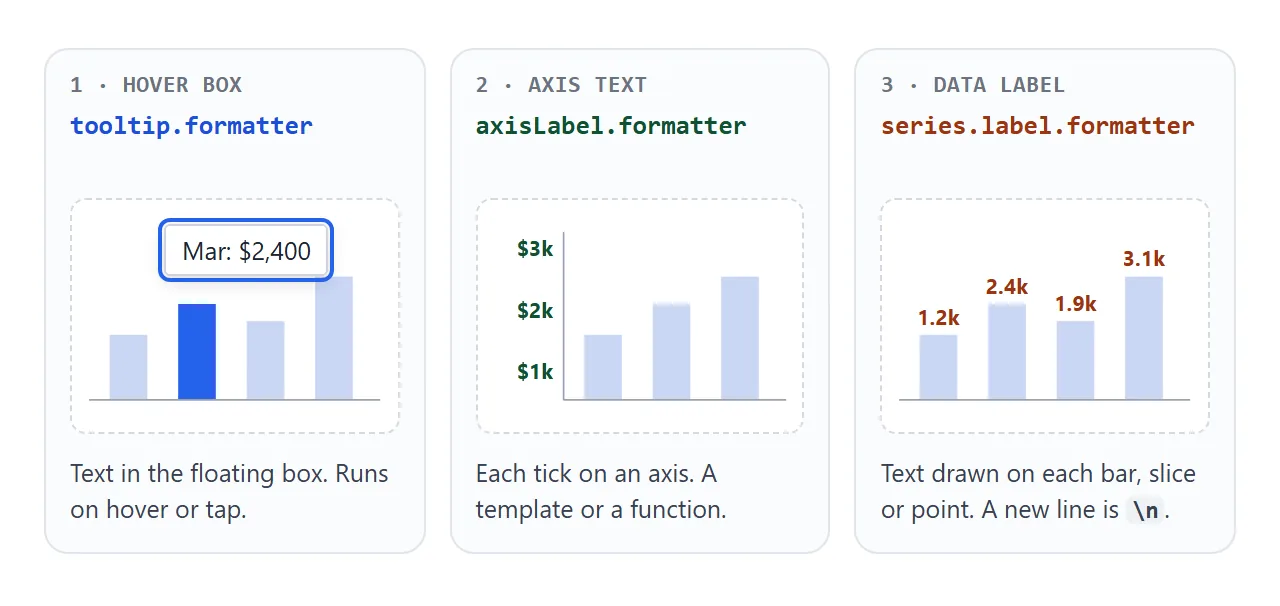
tooltip.formatterbuilds the floating box.axisLabel.formattersits under an axis, for exampleyAxis.axisLabel. It runs once per tick.label.formattersits on a series and formats the text drawn on each bar, point or slice.
String template or function
A string template swaps in variables written in braces. A function receives params and returns the text. Use a template for prefixes, suffixes and a line break. Use a function when you need logic.
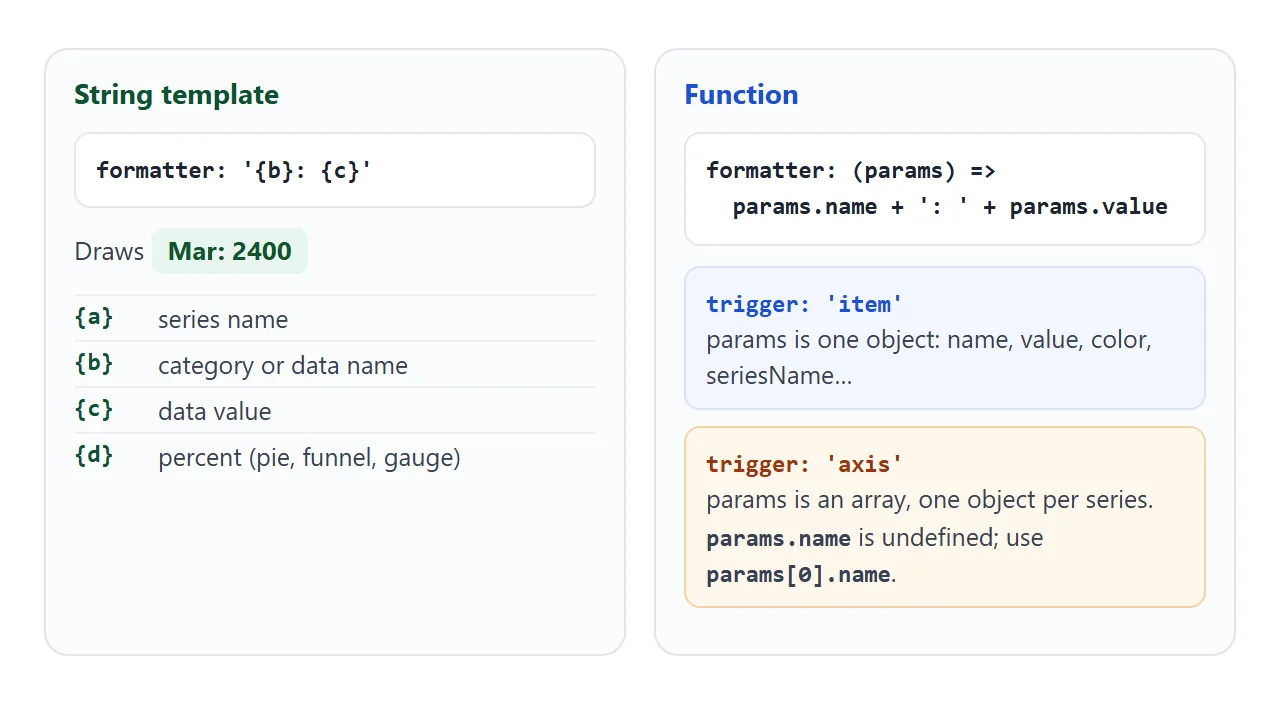
What each variable means depends on the chart type:
| Variable | Line and bar charts | Pie, gauge and funnel charts |
|---|---|---|
{a} |
Series name | Series name |
{b} |
Category name | Data item name |
{c} |
Data value | Data value |
{d} |
Nothing | Percentage |
When a tooltip covers several series, the variables take an index: {a0}, {c1}. The function form of a tooltip formatter looks like this:
tooltip: {
  trigger: 'axis',
  formatter: (params) => {
    // trigger 'axis' gives an array, one item per series
    return params.map(p => p.seriesName + ': ' + p.value).join('<br>');
  }
}
For a pie, label: { formatter: '{b}: {d}%' } draws the name and the percentage on each slice.
Tooltip formatters return HTML
A tooltip is built from HTML elements, so the string your function returns is read as HTML. That is why <br> and <b> work in it. It also means a name that contains < or & is read as markup.
The ECharts security guidelines say the same thing: tooltip.formatter accepts a raw HTML string, and ECharts does not sanitize it for you. Try it. The name below starts as tag-like text.
<!doctype html>
<html lang="en">
<head>
<meta charset="utf-8">
<meta name="viewport" content="width=device-width, initial-scale=1">
<title>ECharts tooltip formatter and HTML escaping</title>
<style>
body { margin: 0; padding: 12px; font-family: system-ui, sans-serif; background: #fff; color: #1d2330; }
h1 { font-size: 16px; margin: 0 0 8px; }
.row { display: flex; flex-wrap: wrap; gap: 8px 14px; align-items: center; margin-bottom: 8px; font-size: 14px; }
input[type=text] { font: inherit; padding: 6px 8px; border: 1px solid #c8ccd4; border-radius: 6px; width: 170px; max-width: 100%; }
#chart { width: 100%; height: 280px; }
#note { margin: 6px 0 0; padding: 8px 10px; border-radius: 8px; font-size: 13px; line-height: 1.4; }
#note.bad { background: #fff4e5; color: #8a4b00; }
#note.ok { background: #e8f6ee; color: #14532d; }
code { font-size: 12.5px; background: #eef1f5; padding: 0 3px; border-radius: 4px; }
</style>
</head>
<body>
<h1>Tooltip formatter: escape or not</h1>
<div class="row">
<label>First slice name <input type="text" id="name" value="<Beta> app"></label>
<label><input type="checkbox" id="esc"> Escape with <code>encodeHTML</code></label>
</div>
<div id="chart"></div>
<p id="note"></p>
<script src="https://cdn.jsdelivr.net/npm/echarts@6.1.0/dist/echarts.min.js"></script>
<script>
const chart = echarts.init(document.getElementById('chart'), null, { renderer: 'svg' });
const nameInput = document.getElementById('name');
const escBox = document.getElementById('esc');
const note = document.getElementById('note');
const values = [40, 35, 25];
const names = () => [nameInput.value, 'Docs', 'Support'];
function draw() {
const safe = escBox.checked;
chart.setOption({
tooltip: {
confine: true,
formatter: (params) => {
// the returned string is used as HTML, so text from outside must be escaped
const name = safe ? echarts.format.encodeHTML(params.name) : params.name;
return name + '<br><b>' + params.value + '</b> (' + params.percent + '%)';
}
},
series: [{
type: 'pie',
radius: '38%',
center: ['50%', '52%'],
label: { formatter: '{b}\n{d}%' }, // a label is drawn as plain text, so \n breaks a line
data: names().map((n, i) => ({ name: n, value: values[i] }))
}]
}, true);
chart.dispatchAction({ type: 'showTip', seriesIndex: 0, dataIndex: 0 });
note.className = safe ? 'ok' : 'bad';
note.textContent = safe
? 'Escaped: the tooltip shows the name exactly as typed.'
: 'Not escaped: the browser reads the name as HTML, so tag-like text can vanish from the tooltip.';
}
nameInput.addEventListener('input', draw);
escBox.addEventListener('change', draw);
window.addEventListener('resize', () => chart.resize());
draw();
</script>
</body>
</html>
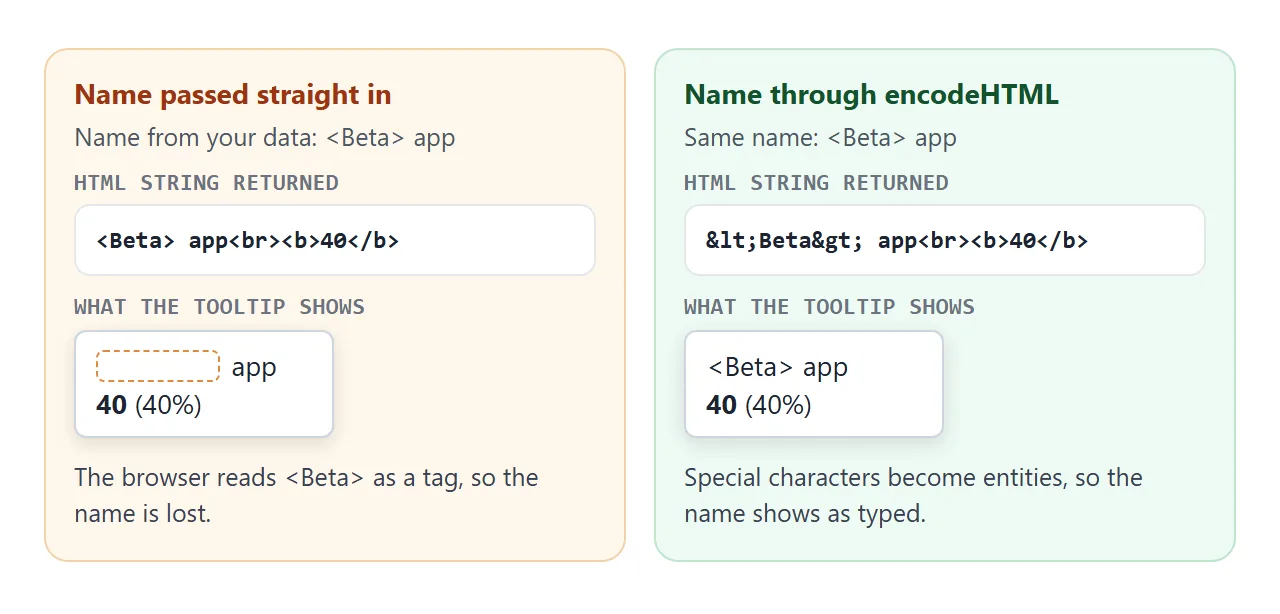
The fix is one call. echarts.format.encodeHTML turns & < > " ' into entities:
formatter: (params) =>
  echarts.format.encodeHTML(params.name) + '<br><b>' + params.value + '</b>'
Escape any text that comes from a file, a form or another person. If you only need to format a number, tooltip.valueFormatter returns plain text and escapes it for you.
Axis labels and data labels
axisLabel.formatter takes a template such as '{value} kg' or a function that receives the value and its index. On a time axis it also understands date templates such as {yyyy}-{MM}-{dd}.
A label is drawn as text, not HTML. A line break there is \n, and a <br/> is drawn literally. For mixed styles inside one label, ECharts has rich text, which the handbook covers.
A finished example: a sales report
This version formats money with a function, reads the array a tooltip receives, and switches units with a select box.
<!doctype html>
<html lang="en">
<head>
<meta charset="utf-8">
<meta name="viewport" content="width=device-width, initial-scale=1">
<title>Sales report with ECharts formatters</title>
<style>
  body { margin: 0; padding: 12px; font-family: system-ui, sans-serif; background: #fff; color: #1d2330; }
  h1 { font-size: 16px; margin: 0 0 8px; }
  .row { display: flex; gap: 8px; align-items: center; font-size: 14px; margin-bottom: 6px; }
  select { font: inherit; padding: 5px 8px; border-radius: 6px; border: 1px solid #c8ccd4; }
  #chart { width: 100%; height: 320px; }
  #sum { margin: 6px 0 0; font-size: 13px; color: #444; }
</style>
</head>
<body>
<h1>Revenue and orders</h1>
<div class="row">
  <label for="unit">Show revenue as</label>
  <select id="unit">
    <option value="full">Full dollars</option>
    <option value="k">Thousands</option>
  </select>
</div>
<div id="chart"></div>
<p id="sum"></p>

<script src="https://cdn.jsdelivr.net/npm/echarts@6.1.0/dist/echarts.min.js"></script>
<script>
  const months = ['Jan', 'Feb', 'Mar', 'Apr', 'May', 'Jun'];
  const revenue = [12400, 18500, 24000, 19000, 31000, 27500];
  const orders = [96, 140, 172, 151, 230, 208];
  const nf = new Intl.NumberFormat('en-US');
  const esc = echarts.format.encodeHTML;
  const chart = echarts.init(document.getElementById('chart'), null, { renderer: 'svg' });

  function build(unit) {
    const money = (v) => unit === 'k' ? '$' + (v / 1000).toFixed(1) + 'k' : '$' + nf.format(v);
    return {
      color: ['#2563eb', '#ea580c'],
      legend: { top: 0 },
      grid: { left: 62, right: 40, top: 40, bottom: 28 },
      tooltip: {
        trigger: 'axis',
        confine: true,
        // trigger "axis" passes an ARRAY, one item per series
        formatter: (params) => {
          const rows = params.map((p) =>
            '<div><span style="display:inline-block;width:8px;height:8px;border-radius:50%;margin-right:6px;background:' + p.color + '"></span>' +
            esc(p.seriesName) + ': <b>' + (p.seriesName === 'Revenue' ? money(p.value) : nf.format(p.value)) + '</b></div>'
          );
          return '<div style="margin-bottom:3px">' + esc(params[0].name) + '</div>' + rows.join('');
        }
      },
      xAxis: { type: 'category', data: months },
      yAxis: [
        { type: 'value', axisLabel: { formatter: (v) => money(v) } },
        { type: 'value', splitLine: { show: false }, axisLabel: { formatter: '{value}' } }
      ],
      series: [
        { name: 'Revenue', type: 'bar', data: revenue },
        { name: 'Orders', type: 'line', yAxisIndex: 1, data: orders }
      ]
    };
  }

  const unitSel = document.getElementById('unit');
  function draw() {
    chart.setOption(build(unitSel.value));
    const total = revenue.reduce((a, b) => a + b, 0);
    document.getElementById('sum').textContent =
      'Total revenue: ' + (unitSel.value === 'k' ? '$' + (total / 1000).toFixed(1) + 'k' : '$' + nf.format(total));
  }

  unitSel.addEventListener('change', draw);
  window.addEventListener('resize', () => chart.resize());
  // also covers a container that changes size without the window resizing
  new ResizeObserver(() => chart.resize()).observe(document.getElementById('chart'));
  draw();
</script>
</body>
</html>
- Number format:
Intl.NumberFormatadds the thousands separators. See Intl.NumberFormat. - Rebuild the option: a function returns a fresh option for each unit, and
setOptionapplies it. - Resize:
chart.resize()runs on the window resize event. AResizeObservercovers a container that changes size without the window changing. See ResizeObserver.
For plain bar charts without a library, see HTML bar chart.
When it does not work
| What you see | Cause | Fix |
|---|---|---|
| Console says echarts is not defined | The code runs before the script tag, or the script was blocked | Put the script tag first and check the network tab |
| Empty area, no error | The container has no height | Give the div a height in CSS |
| Tooltip shows undefined | With trigger axis, params is an array | Use params[0].name or map over it |
| Name with < or & is missing or garbled | The tooltip string is read as HTML | Wrap it in echarts.format.encodeHTML |
| Label shows a literal br tag | Labels are plain text | Use \n for a new line |
| Tooltip keeps old text after setOption | An open tooltip is not redrawn | Move the pointer; the next hover uses the new formatter |
| Chart is the wrong size after resizing | The chart does not follow the window by itself | Call chart.resize() on resize |
| Page changes after a new release | The URL has no version | Pin the version in the URL |
Share it as a link
A chart is better shown than described. A screenshot cannot be hovered, and an .html attachment may open as plain code on a phone. See also sharing a chart as a link.
To send the working version, paste the page into a NOS document and choose Create share link. HTML to link walks through it.
The page renders as written and its scripts run, including the ECharts script from jsDelivr. The people you send it to can hover and tap the chart themselves. If you change the code later, the same link shows the new version.