To share a Google Sheet as view only, click Share, set General access to Anyone with the link, set the role to Viewer, and copy the link. Anyone with it can open the file without signing in to a Google Account (as of October 2026).
That link stops edits. It does not make the file smaller. Google's help says spreadsheet viewers can still access content in hidden sheets.
A Viewer can also download the file unless the owner turns that off. If your sheet has working tabs you did not mean to show, the link shows more than you intended.
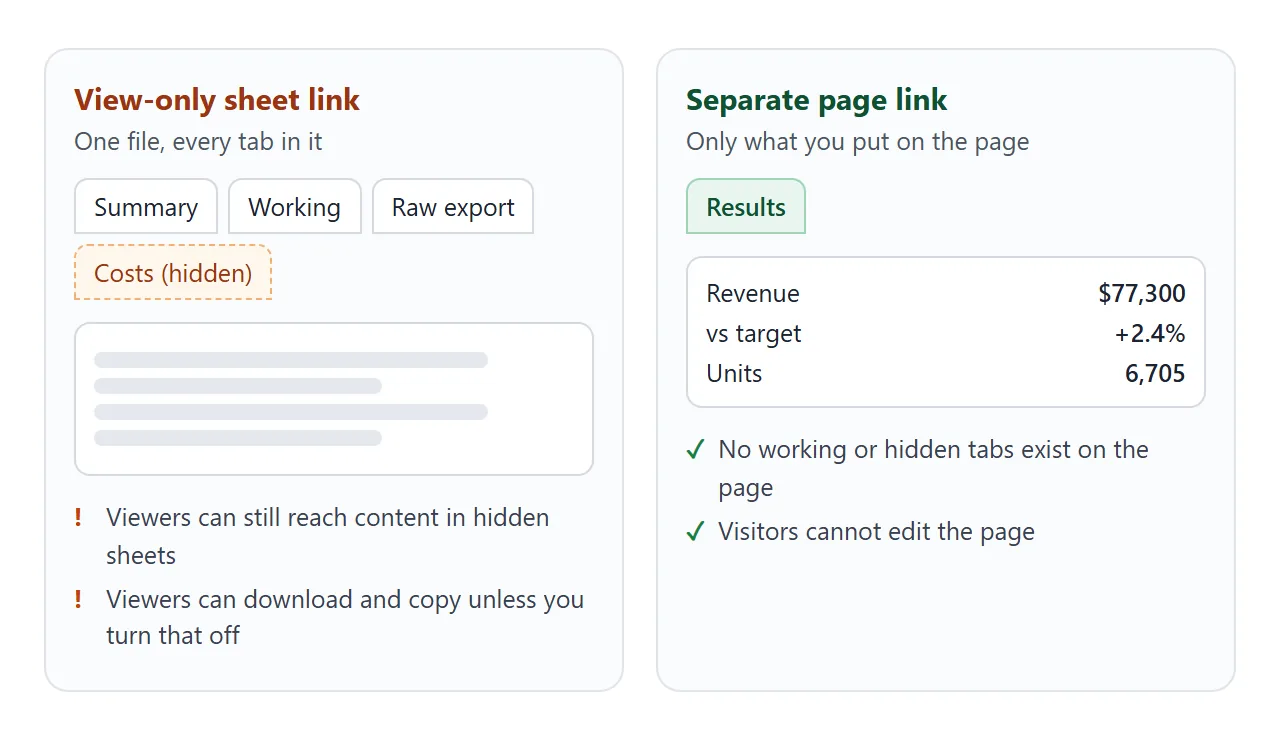
The other route is to send the results as their own page. You copy the finished numbers, have an AI chat turn them into one HTML page, and share that page as a link. Try one. Sort by a column, then filter by channel.
<!doctype html>
<html lang="en">
<head>
<meta charset="utf-8">
<meta name="viewport" content="width=device-width, initial-scale=1">
<title>Q3 sales results</title>
<style>
  * { box-sizing: border-box; }
  body { margin: 0; padding: 18px 16px 24px; font-family: system-ui, "Segoe UI", sans-serif; background: #f4f5f7; color: #1d2330; }
  .wrap { max-width: 640px; margin: 0 auto; }
  h1 { font-size: 20px; margin: 0 0 2px; }
  .sub { margin: 0 0 14px; font-size: 13px; color: #5b6472; }
  .tiles { display: grid; grid-template-columns: repeat(3, 1fr); gap: 8px; margin-bottom: 14px; }
  .tile { background: #fff; border-radius: 10px; padding: 10px 12px; box-shadow: 0 1px 3px rgba(0,0,0,.08); }
  .tile small { display: block; font-size: 11px; color: #6b7280; text-transform: uppercase; letter-spacing: .4px; }
  .tile b { font-size: 19px; }
  .good { color: #0f7a43; } .bad { color: #b45309; }
  .chips { display: flex; gap: 6px; margin-bottom: 10px; }
  .chips button { font: inherit; font-size: 13px; padding: 6px 12px; border: 1px solid #cfd5df; background: #fff; border-radius: 999px; cursor: pointer; }
  .chips button[aria-pressed="true"] { background: #1d4ed8; border-color: #1d4ed8; color: #fff; }
  table { width: 100%; border-collapse: collapse; background: #fff; border-radius: 10px; overflow: hidden; box-shadow: 0 1px 3px rgba(0,0,0,.08); font-size: 14px; }
  th, td { padding: 9px 10px; text-align: left; border-bottom: 1px solid #eef0f4; }
  th { font-size: 12px; color: #4b5563; background: #fafbfc; cursor: pointer; user-select: none; white-space: nowrap; }
  th.num, td.num { text-align: right; }
  tr:last-child td { border-bottom: 0; }
  .note { margin: 10px 2px 0; font-size: 12px; color: #6b7280; }
</style>
</head>
<body>
<div class="wrap">
  <h1>Q3 sales results</h1>
  <p class="sub">Harbor Lane Supplies, July to September. Snapshot taken 30 Sep.</p>

  <div class="tiles">
    <div class="tile"><small>Revenue</small><b id="rev">-</b></div>
    <div class="tile"><small>vs target</small><b id="vs">-</b></div>
    <div class="tile"><small>Units</small><b id="units">-</b></div>
  </div>

  <div class="chips" id="chips">
    <button type="button" data-ch="All" aria-pressed="true">All</button>
    <button type="button" data-ch="Online" aria-pressed="false">Online</button>
    <button type="button" data-ch="Store" aria-pressed="false">Store</button>
  </div>

  <table>
    <thead><tr>
      <th data-k="p">Product</th><th data-k="c">Channel</th>
      <th class="num" data-k="r">Revenue</th><th class="num" data-k="d">vs target</th>
    </tr></thead>
    <tbody id="body"></tbody>
  </table>
  <p class="note">Tap a column heading to sort. Numbers are a snapshot, not a live sheet.</p>
</div>

<script>
  const rows = [
    { p: 'Coffee beans', c: 'Online', u: 1240, r: 18600, t: 17000 },
    { p: 'Coffee beans', c: 'Store',  u: 980,  r: 14700, t: 15000 },
    { p: 'Filters',      c: 'Online', u: 2100, r: 6300,  t: 6000 },
    { p: 'Filters',      c: 'Store',  u: 1500, r: 4500,  t: 5000 },
    { p: 'Mugs',         c: 'Online', u: 310,  r: 6200,  t: 5500 },
    { p: 'Mugs',         c: 'Store',  u: 420,  r: 8400,  t: 8000 },
    { p: 'Grinders',     c: 'Online', u: 95,   r: 11400, t: 12000 },
    { p: 'Grinders',     c: 'Store',  u: 60,   r: 7200,  t: 7000 }
  ];
  rows.forEach(x => x.d = (x.r - x.t) / x.t * 100);

  let channel = 'All', key = 'r', dir = -1;
  const money = n => '$' + n.toLocaleString('en-US');
  const pct = n => (n >= 0 ? '+' : '') + n.toFixed(1) + '%';

  function draw() {
    const list = rows.filter(x => channel === 'All' || x.c === channel);
    list.sort((a, b) => (a[key] > b[key] ? 1 : a[key] < b[key] ? -1 : 0) * dir);
    document.getElementById('body').innerHTML = list.map(x =>
      '<tr><td>' + x.p + '</td><td>' + x.c + '</td><td class="num">' + money(x.r) +
      '</td><td class="num ' + (x.d >= 0 ? 'good' : 'bad') + '">' + pct(x.d) + '</td></tr>').join('');
    const rev = list.reduce((s, x) => s + x.r, 0);
    const tgt = list.reduce((s, x) => s + x.t, 0);
    const units = list.reduce((s, x) => s + x.u, 0);
    const vs = (rev - tgt) / tgt * 100;
    document.getElementById('rev').textContent = money(rev);
    const el = document.getElementById('vs');
    el.textContent = pct(vs);
    el.className = vs >= 0 ? 'good' : 'bad';
    document.getElementById('units').textContent = units.toLocaleString('en-US');
  }

  document.getElementById('chips').addEventListener('click', (e) => {
    const b = e.target.closest('button');
    if (!b) return;
    channel = b.dataset.ch;
    document.querySelectorAll('#chips button').forEach(x => x.setAttribute('aria-pressed', x === b));
    draw();
  });
  document.querySelector('thead').addEventListener('click', (e) => {
    const th = e.target.closest('th');
    if (!th) return;
    dir = (key === th.dataset.k) ? -dir : (th.dataset.k === 'p' || th.dataset.k === 'c' ? 1 : -1);
    key = th.dataset.k;
    draw();
  });
  draw();
</script>
</body>
</html>
The page contains what you pasted and nothing else. There is no Working tab behind it, because the page never had one.
Make it with AI
Copy only the finished cells from your sheet, then paste this into ChatGPT, Claude or Gemini and swap in your own title and table.
Make one self-contained HTML page from the table below.
Title: [Q3 sales results]. Subtitle: [your company, snapshot taken 30 Sep].
Show three summary tiles above the table: total revenue, percent versus target, total units.
Add All / Online / Store filter buttons, and let the reader sort by clicking a column heading.
Colour the versus-target column green when positive and orange when negative.
Rules: one file, CSS and JavaScript inside it, no external images, fonts or scripts.
It must work on a phone at 390 px wide. Add a viewport meta tag.
Use only the numbers in my table. Do not invent, round or add any figure.
Table:
[paste the cells you copied from the sheet]
Check three things before you share. The totals on the tiles match what the sheet says when you add the rows yourself. No row is missing and no figure was invented. Sorting and filtering work, and the page reads well in a narrow browser window.
Send it as a link
Copy the HTML, paste it into a NOS document, and choose Create share link. HTML to link walks through it. The page renders as written and its scripts run, so the sorting and filtering work for the people you send it to.
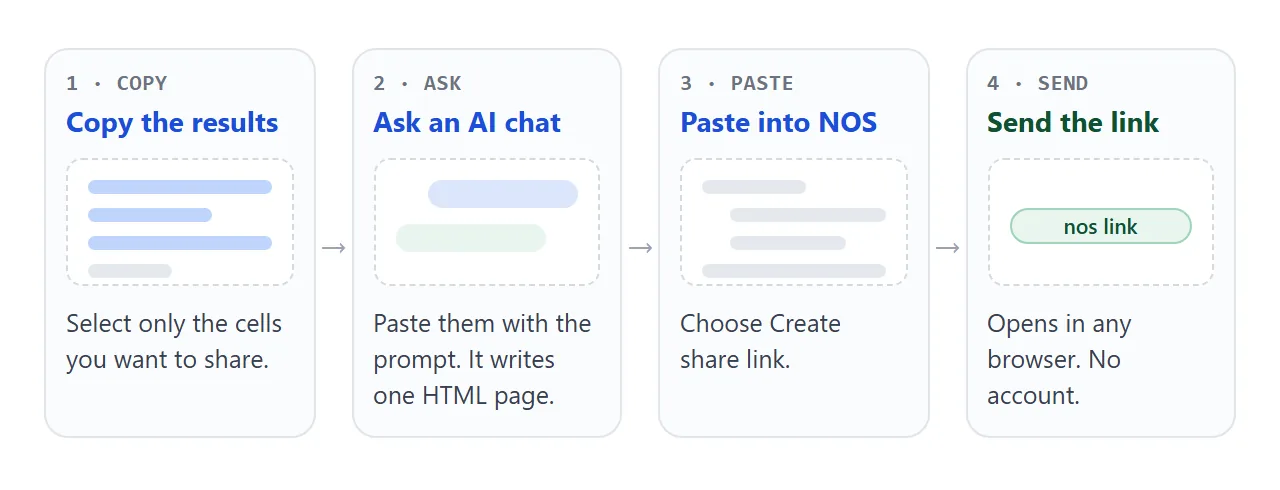
The link opens in a browser, phone included, with no account. Visitors cannot edit the page. If a number was wrong, change the code and the same link shows the new version.
Opening an HTML file on a phone covers why a link beats an attachment.
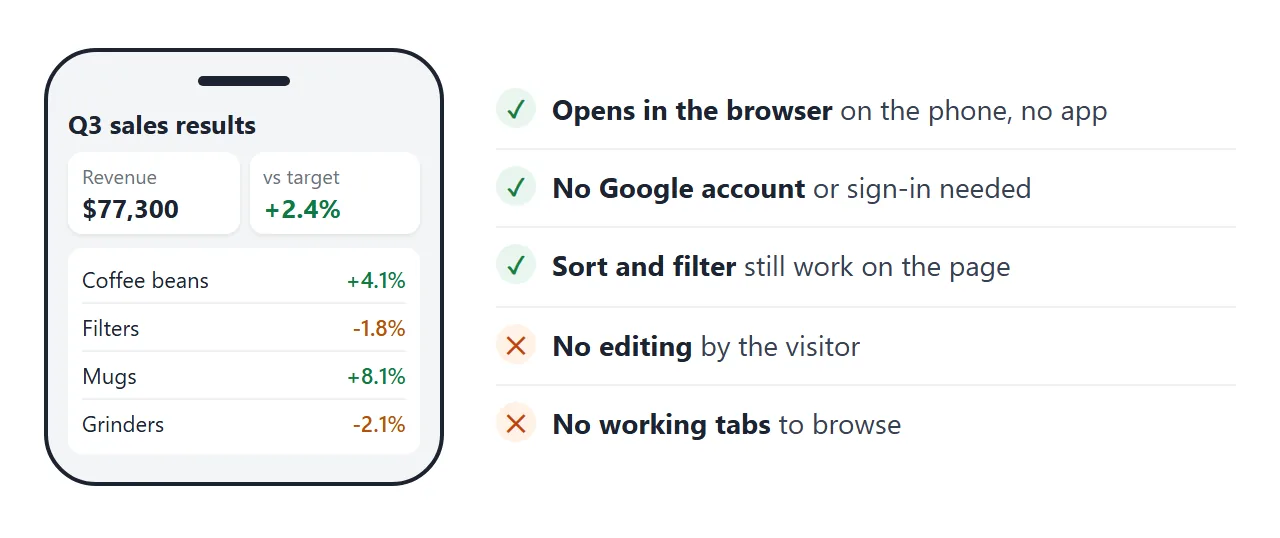
Two limits matter for a results page. Anyone with the link can open it, so leave out anything you would not pin to a public notice board.
And requests to other sites are blocked, so the page cannot read your live sheet. It is a snapshot, so put the date on it.
View-only link or page link
Neither is always better. Pick by what the reader needs to do.
Sheet link: the reader needs every row and the file holds nothing private.
Page link: the reader needs the answer, or the file has working tabs.
Both: a manager wants the summary first, the detail on request.
For the wider reasoning about what a workbook carries, see sharing spreadsheet data without the file.
Ways to share results compared
| Way | Who can open it | What to know |
|---|---|---|
| Sheet link, Viewer role | Anyone with the link, no sign-in | Viewers can still reach hidden sheets, and can download unless the owner turns it off |
| Sheet link, download and copy off | Anyone with the link | Stops Viewers and Commenters downloading, printing, copying. Not described as hiding tabs |
| Publish to the web | People who get the URL, or visit a page that embeds it | Whole spreadsheet or chosen sheets; updates automatically unless turned off; stop it under Published content and settings |
| Page link made in NOS | Anyone with the link, no account | Only what is on the page; visitors cannot edit; a snapshot you refresh yourself |
Publish to the web keeps the numbers current, which a page link does not. It publishes sheets, though, not a designed summary.
If the reader needs live numbers, publish. If the reader needs a clean answer, send the page. More on sharing from Google Drive.
A second page: budget by month
A page can also reshape a sheet. A sheet needs a tab per month. A page can show one month at a time, with the over-budget lines in orange, so a manager sees the problem in a few seconds.
<!doctype html>
<html lang="en">
<head>
<meta charset="utf-8">
<meta name="viewport" content="width=device-width, initial-scale=1">
<title>Budget check</title>
<style>
  * { box-sizing: border-box; }
  body { margin: 0; padding: 18px 16px 24px; font-family: system-ui, "Segoe UI", sans-serif; background: #f4f5f7; color: #1d2330; }
  .wrap { max-width: 560px; margin: 0 auto; }
  h1 { font-size: 20px; margin: 0 0 2px; }
  .sub { margin: 0 0 14px; font-size: 13px; color: #5b6472; }
  .tabs { display: flex; gap: 6px; margin-bottom: 12px; }
  .tabs button { flex: 1; font: inherit; font-size: 14px; padding: 8px 0; border: 1px solid #cfd5df; background: #fff; border-radius: 8px; cursor: pointer; }
  .tabs button[aria-selected="true"] { background: #1d2330; border-color: #1d2330; color: #fff; }
  .card { background: #fff; border-radius: 10px; padding: 12px 14px; margin-bottom: 8px; box-shadow: 0 1px 3px rgba(0,0,0,.08); }
  .top { display: flex; justify-content: space-between; align-items: baseline; font-size: 14px; }
  .top b { font-size: 15px; }
  .track { height: 10px; border-radius: 6px; background: #e8ebf0; margin: 8px 0 6px; overflow: hidden; }
  .fill { height: 100%; background: #15935a; border-radius: 6px; }
  .fill.over { background: #d9770a; }
  .meta { font-size: 12.5px; color: #5b6472; }
  .meta .bad { color: #b45309; font-weight: 600; }
  .summary { margin: 12px 2px 0; font-size: 14px; font-weight: 600; }
</style>
</head>
<body>
<div class="wrap">
  <h1>Budget check by team</h1>
  <p class="sub">Operations, third quarter. Choose a month.</p>

  <div class="tabs" id="tabs" role="tablist">
    <button type="button" role="tab" data-m="Jul" aria-selected="true">July</button>
    <button type="button" role="tab" data-m="Aug" aria-selected="false">August</button>
    <button type="button" role="tab" data-m="Sep" aria-selected="false">September</button>
  </div>

  <div id="list"></div>
  <p class="summary" id="summary"></p>
</div>

<script>
  // spent and budget in dollars, per team and month
  const data = {
    Jul: [['Travel', 2400, 3000], ['Software', 1800, 1800], ['Training', 600, 1500], ['Events', 2100, 2000]],
    Aug: [['Travel', 3300, 3000], ['Software', 1800, 1800], ['Training', 900, 1500], ['Events', 800, 2000]],
    Sep: [['Travel', 2700, 3000], ['Software', 1950, 1800], ['Training', 1400, 1500], ['Events', 2600, 2000]]
  };
  const money = n => '$' + n.toLocaleString('en-US');

  function show(month) {
    let over = 0;
    document.getElementById('list').innerHTML = data[month].map(([name, spent, budget]) => {
      const isOver = spent > budget;
      if (isOver) over++;
      const width = Math.min(100, spent / budget * 100);
      const note = isOver
        ? '<span class="bad">' + money(spent - budget) + ' over</span>'
        : money(budget - spent) + ' left';
      return '<div class="card"><div class="top"><b>' + name + '</b><span>' + money(spent) + ' of ' + money(budget) + '</span></div>' +
        '<div class="track"><div class="fill' + (isOver ? ' over' : '') + '" style="width:' + width + '%"></div></div>' +
        '<div class="meta">' + note + '</div></div>';
    }).join('');
    document.getElementById('summary').textContent =
      over === 0 ? 'Every team is within budget.' : over + (over === 1 ? ' team is' : ' teams are') + ' over budget.';
  }

  document.getElementById('tabs').addEventListener('click', (e) => {
    const b = e.target.closest('button');
    if (!b) return;
    document.querySelectorAll('#tabs button').forEach(x => x.setAttribute('aria-selected', x === b));
    show(b.dataset.m);
  });
  show('Jul');
</script>
</body>
</html>
To get this, ask for it in the prompt: "one tab per month, a bar for each team, orange when spending is above budget, and a one-line summary of teams over."
The tabs here are ones you chose, not the ones your working file happens to contain. To turn a plain CSV into a table instead, see HTML table from CSV.
When it does not work
| Symptom | Cause | Fix |
|---|---|---|
| The recipient is asked to request access | General access is still Restricted | Set General access to Anyone with the link, role Viewer |
| A viewer downloaded the file | Download, print and copy are allowed by default for Viewers | In sharing settings, stop Viewers and Commenters downloading, printing and copying |
| A hidden tab was read | Viewers can still access content in hidden sheets | Share a page with only the results, or a file without that tab |
| The page figures are out of date | The page is a snapshot of what you pasted | Paste fresh cells into the AI, update the same NOS document |
| A total on the page is wrong | The AI added, rounded or invented a figure | Re-add the rows yourself and tell the AI to use only the table |
| A picture is missing | Images from other sites are blocked | Ask for inline SVG or CSS shapes instead |
| The page does not show live data | Requests to other sites are blocked | Paste a new snapshot, or send the sheet link as well |