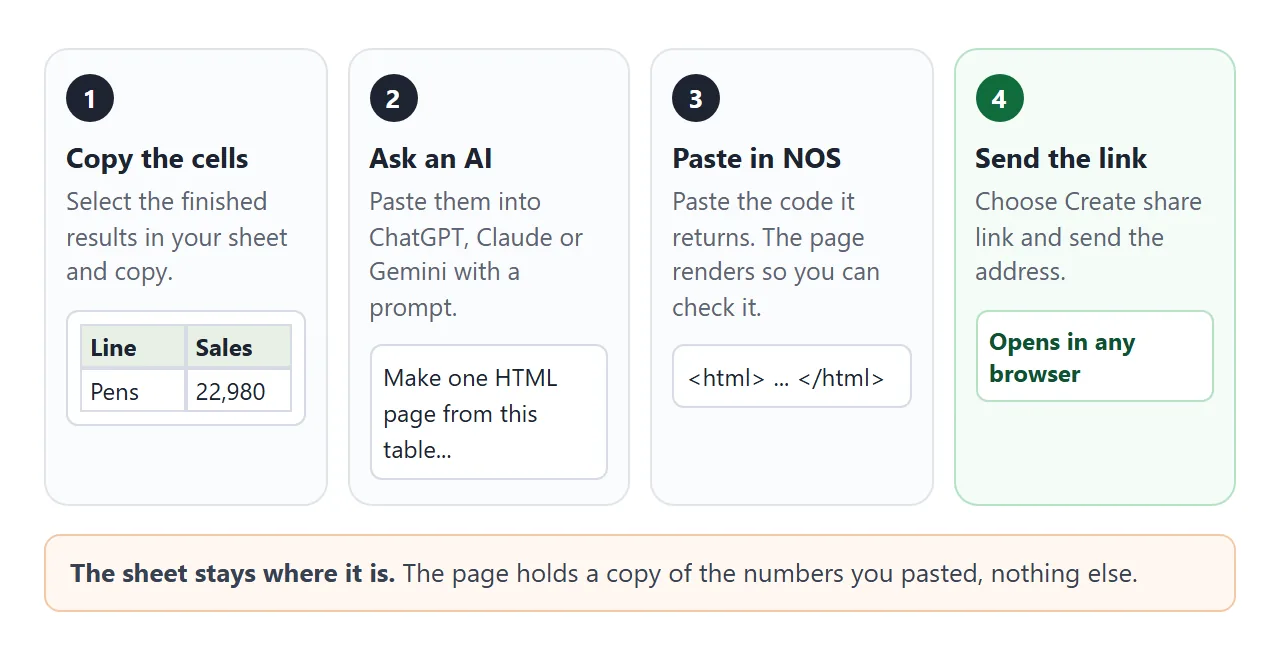
To turn a Google Sheet into a webpage, copy the finished results, ask an AI chat to build one HTML page from them, and send that page as a link. Viewers open the link in a browser. They do not need access to your sheet.
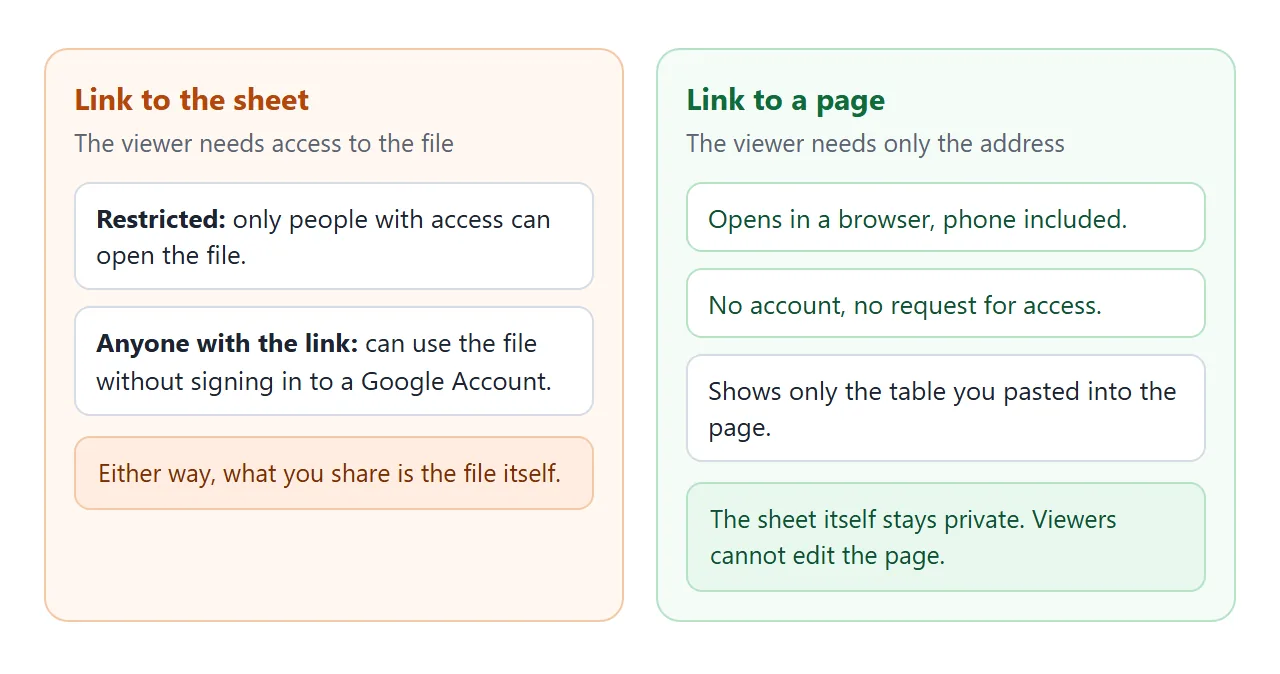
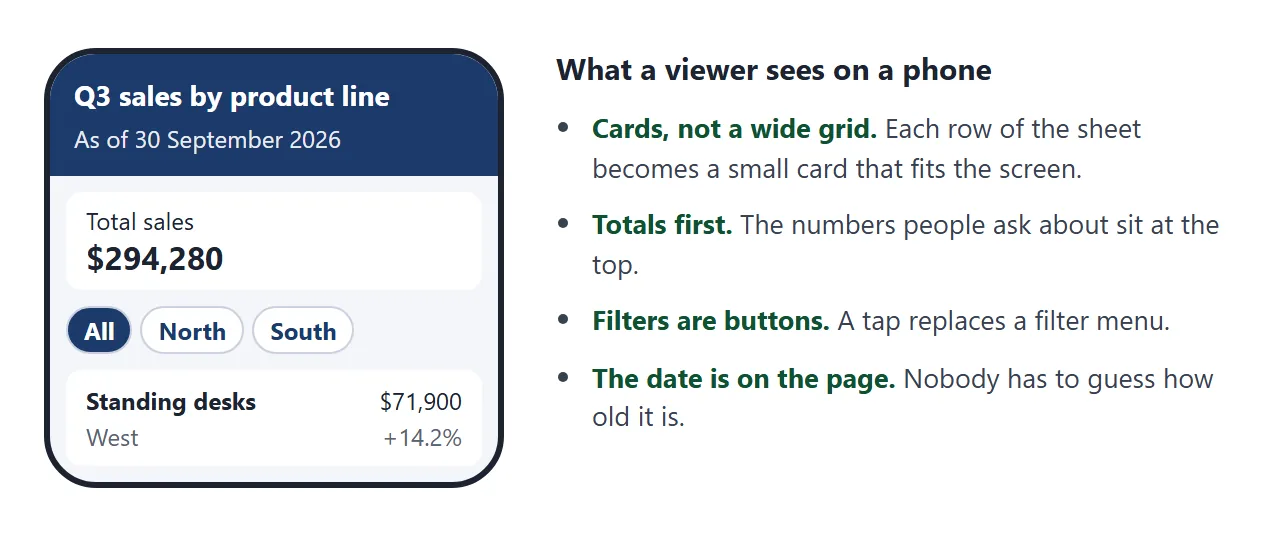
That is the point. Sharing the sheet means managing who may open the file, and every tab comes with it. A page holds only the table you pasted into it, laid out so it reads well on a phone.
Here is a results page of that kind, for a made-up company. Tap a region, tap a column heading to sort, and shrink the window to see it turn into cards.
<!doctype html>
<html lang="en">
<head>
<meta charset="utf-8">
<meta name="viewport" content="width=device-width, initial-scale=1">
<title>Q3 sales results</title>
<style>
* { box-sizing: border-box; }
body { margin: 0; font-family: system-ui, sans-serif; background: #f4f6fa; color: #1d2330; line-height: 1.45; }
header { background: #1b3a6b; color: #fff; padding: 20px 16px 16px; }
.in { max-width: 760px; margin: 0 auto; }
header h1 { margin: 0 0 4px; font-size: 22px; }
header p { margin: 0; font-size: 14px; opacity: .92; }
main { padding: 14px 16px 24px; }
.tiles { display: grid; grid-template-columns: repeat(3, 1fr); gap: 10px; margin-bottom: 14px; }
.tile { background: #fff; border-radius: 12px; padding: 12px 14px; box-shadow: 0 1px 5px rgba(0,0,0,.07); }
.tile span { display: block; font-size: 12px; font-weight: 700; color: #5b6472; text-transform: uppercase; letter-spacing: .03em; }
.tile b { display: block; font-size: 22px; margin-top: 2px; }
.chips { display: flex; flex-wrap: wrap; gap: 8px; margin-bottom: 12px; }
.chips button { border: 1px solid #c9d1de; background: #fff; color: #1b3a6b; border-radius: 999px; padding: 8px 14px; font-size: 14px; font-weight: 600; cursor: pointer; }
.chips button[aria-pressed="true"] { background: #1b3a6b; color: #fff; border-color: #1b3a6b; }
.card { background: #fff; border-radius: 12px; padding: 6px 12px 10px; box-shadow: 0 1px 5px rgba(0,0,0,.07); }
table { width: 100%; border-collapse: collapse; font-size: 14px; }
th, td { text-align: left; padding: 10px 6px; border-bottom: 1px solid #e6e9f0; vertical-align: middle; }
th { font-size: 12px; color: #5b6472; text-transform: uppercase; letter-spacing: .03em; }
th button { all: unset; cursor: pointer; font: inherit; color: inherit; text-transform: inherit; letter-spacing: inherit; font-weight: 700; padding: 4px 0; }
th button:focus-visible { outline: 2px solid #1b3a6b; outline-offset: 2px; }
td.num, th.num { text-align: right; }
.bar { height: 8px; background: #e6e9f0; border-radius: 4px; overflow: hidden; min-width: 70px; }
.bar i { display: block; height: 100%; background: #2f6fd0; }
.up { color: #0f6b3a; font-weight: 700; }
.down { color: #b4470c; font-weight: 700; }
footer { text-align: center; font-size: 13px; color: #5b6472; padding: 0 16px 20px; }
@media (max-width: 560px) {
.tiles { grid-template-columns: 1fr 1fr; }
.tile:last-child { grid-column: span 2; }
thead { display: none; }
tr { display: block; border-bottom: 1px solid #e6e9f0; padding: 8px 0; }
td { display: flex; justify-content: space-between; gap: 12px; border: 0; padding: 4px 4px; text-align: right; }
td::before { content: attr(data-label); font-size: 12px; font-weight: 700; color: #5b6472; text-transform: uppercase; text-align: left; }
td:first-child { font-size: 16px; font-weight: 700; justify-content: flex-start; }
td:first-child::before { display: none; }
td.bars { display: block; }
td.bars::before { display: none; }
}
</style>
</head>
<body>
<header><div class="in">
<h1>Q3 sales by product line</h1>
<p>Northline Supplies (fictional) · Figures as of 30 September 2026</p>
</div></header>
<main><div class="in">
<div class="tiles" id="tiles"></div>
<div class="chips" id="chips" role="group" aria-label="Filter by region"></div>
<div class="card">
<table>
<thead><tr>
<th><button data-key="line">Product line</button></th>
<th><button data-key="region">Region</button></th>
<th class="num"><button data-key="sales">Sales</button></th>
<th class="num"><button data-key="change">vs Q2</button></th>
<th>Share of top line</th>
</tr></thead>
<tbody id="rows"></tbody>
</table>
</div>
</div></main>
<footer>This page is a snapshot of the sheet. The date above says when it was made.</footer>
<script>
// Paste your sheet rows here, one line per row. Everything else builds itself.
const DATA = [
{ line: 'Notebooks', region: 'North', sales: 48200, change: 6.4 },
{ line: 'Desk lamps', region: 'North', sales: 31750, change: -2.1 },
{ line: 'Pens', region: 'South', sales: 22980, change: 11.8 },
{ line: 'Chairs', region: 'South', sales: 64300, change: 3.2 },
{ line: 'Whiteboards', region: 'East', sales: 18400, change: -7.5 },
{ line: 'Filing boxes', region: 'East', sales: 27150, change: 1.9 },
{ line: 'Staplers', region: 'West', sales: 9600, change: 0.4 },
{ line: 'Standing desks',region: 'West', sales: 71900, change: 14.2 }
];
const money = (n) => '$' + n.toLocaleString('en-US');
const state = { region: 'All', key: 'sales', dir: -1 };
const tiles = document.getElementById('tiles');
const chips = document.getElementById('chips');
const rows = document.getElementById('rows');
function addCell(tr, text, cls, label) {
const td = document.createElement('td');
td.textContent = text;
if (cls) td.className = cls;
td.dataset.label = label;
tr.appendChild(td);
return td;
}
function render() {
const shown = DATA.filter((d) => state.region === 'All' || d.region === state.region);
shown.sort((a, b) => {
const x = a[state.key], y = b[state.key];
return (x > y ? 1 : x < y ? -1 : 0) * state.dir;
});
const total = shown.reduce((s, d) => s + d.sales, 0);
const top = Math.max(...shown.map((d) => d.sales));
tiles.innerHTML = '';
[['Total sales', money(total)], ['Product lines', String(shown.length)], ['Best line', shown.length ? shown.slice().sort((a, b) => b.sales - a.sales)[0].line : '-']]
.forEach(([label, value]) => {
const t = document.createElement('div');
t.className = 'tile';
const s = document.createElement('span'); s.textContent = label;
const b = document.createElement('b'); b.textContent = value;
t.append(s, b);
tiles.appendChild(t);
});
rows.innerHTML = '';
shown.forEach((d) => {
const tr = document.createElement('tr');
addCell(tr, d.line, '', 'Product line');
addCell(tr, d.region, '', 'Region');
addCell(tr, money(d.sales), 'num', 'Sales');
addCell(tr, (d.change > 0 ? '+' : '') + d.change.toFixed(1) + '%', 'num ' + (d.change >= 0 ? 'up' : 'down'), 'vs Q2');
const bar = addCell(tr, '', 'bars', '');
bar.innerHTML = '<div class="bar"><i></i></div>';
bar.querySelector('i').style.width = Math.round((d.sales / top) * 100) + '%';
rows.appendChild(tr);
});
}
['All', ...new Set(DATA.map((d) => d.region))].forEach((r) => {
const b = document.createElement('button');
b.textContent = r;
b.setAttribute('aria-pressed', r === 'All' ? 'true' : 'false');
b.addEventListener('click', () => {
state.region = r;
chips.querySelectorAll('button').forEach((x) => x.setAttribute('aria-pressed', String(x === b)));
render();
});
chips.appendChild(b);
});
document.querySelectorAll('th button').forEach((btn) => {
btn.addEventListener('click', () => {
const k = btn.dataset.key;
state.dir = state.key === k ? -state.dir : (k === 'line' || k === 'region' ? 1 : -1);
state.key = k;
render();
});
});
render();
</script>
</body>
</html>
The rows live in one list in the code, so replacing the numbers means replacing those lines. The totals, bars and filters rebuild themselves.
Make it with AI
You do not have to write the page. Copy the results from your sheet and paste them into ChatGPT, Claude or Gemini with this prompt.
Make one HTML page from the table below. Show a title and an
"As of" date at the top, three summary tiles (total, row count,
largest row), filter buttons for the Region column, and a table
whose columns sort when I click the heading. On a phone, show each
row as a small card. Put the rows in one JavaScript list near the
bottom, one line per row. Large text. No outside libraries, images
or fonts. Do not save anything.

[paste your cells here]
Then check the page before you send it:
- The totals. Compare the total and two or three rows with the sheet. An AI can mis-add or drop a row without saying so.
- The formatting. Percentages, currencies and dates can change shape when they are pasted. Look at each column.
- What came along. Make sure no column you meant to keep private is on the page.
- Phone width. Make the browser window narrow and look at the cards.
Send it as a link
- Copy all of the code the AI returned.
- Paste it into a NOS document. The page renders and its scripts run, so test the filters yourself.
- Choose Create share link and copy the address. HTML to link walks through it.
- Send that address by email, chat or a QR code.
Anyone with the link can open the page in a browser, on a phone or a laptop, without an account. They cannot edit it.
If someone sees code instead of a page, they were probably sent the file. See opening an HTML file on a phone.
For a printed report, put the link in a QR code. QR code link explains why a printed code keeps working when the page behind it changes.
Ways to show a sheet to other people
Google Sheets has its own options, and each fits a different job. This is how they compare. As of October 2026, check Google's help pages for the current menus.
| Share the sheet | Publish to web | Download a copy | Page made with AI | |
|---|---|---|---|---|
| What people get | Access to the file | A read-only view | A file | A designed page |
| Updates | Live | Automatic by default | A new download | You paste new numbers |
| Layout | Sheet grid | Sheet grid | Sheet grid | Whatever you ask for |
| Good for | Working together | A quick public view | Archives, Excel users | A report people read |
Google's help page for Publish to web says people with view permission can see charts, cell formatting and cell values but cannot view or edit formulas.
It also warns that publishing a chart lets people see the data behind it, and to be careful with private information.
The same page says you can publish the whole spreadsheet or individual sheets. Whether you can publish to everyone may depend on your account settings.
Publish to web is the quicker choice when the sheet grid is fine and you want it to follow your edits. A page made with AI is better when you want summary tiles, a layout for phones, or only some of the cells shown.
When the numbers change
A page made this way is a snapshot. Your NOS page cannot reach out to the sheet, because requests from a page to other sites are blocked. It shows what you pasted.
<!doctype html>
<html lang="en">
<head>
<meta charset="utf-8">
<meta name="viewport" content="width=device-width, initial-scale=1">
<title>Budget check</title>
<style>
* { box-sizing: border-box; }
body { margin: 0; font-family: system-ui, sans-serif; background: #f6f5f2; color: #20242c; line-height: 1.45; }
.wrap { max-width: 640px; margin: 0 auto; padding: 18px 16px 24px; }
h1 { margin: 0 0 2px; font-size: 22px; }
.sub { margin: 0 0 14px; font-size: 14px; color: #5b6472; }
.sum { display: flex; flex-wrap: wrap; gap: 10px; margin-bottom: 14px; }
.sum div { flex: 1 1 140px; background: #fff; border-radius: 12px; padding: 10px 14px; box-shadow: 0 1px 5px rgba(0,0,0,.07); }
.sum span { display: block; font-size: 12px; font-weight: 700; color: #5b6472; text-transform: uppercase; letter-spacing: .03em; }
.sum b { font-size: 20px; }
label.sw { display: flex; align-items: center; gap: 10px; margin-bottom: 12px; font-size: 15px; min-height: 44px; cursor: pointer; }
label.sw input { width: 20px; height: 20px; }
.item { background: #fff; border-radius: 12px; padding: 12px 14px; margin-bottom: 10px; box-shadow: 0 1px 5px rgba(0,0,0,.07); }
.top { display: flex; justify-content: space-between; align-items: baseline; gap: 10px; flex-wrap: wrap; }
.top b { font-size: 16px; }
.top span { font-size: 14px; color: #5b6472; }
.track { height: 12px; background: #e8e6e0; border-radius: 6px; overflow: hidden; margin: 8px 0 6px; }
.track i { display: block; height: 100%; background: #2f8f5b; }
.item.over .track i { background: #d1621b; }
.flag { font-size: 14px; font-weight: 700; }
.ok .flag { color: #0f6b3a; }
.over .flag { color: #b4470c; }
</style>
</head>
<body>
<div class="wrap">
<h1>Team budget: spent so far</h1>
<p class="sub">Operations (fictional) · Copied from the sheet on 30 September 2026</p>
<div class="sum" id="sum"></div>
<label class="sw"><input type="checkbox" id="onlyOver"> Show only lines over budget</label>
<div id="list"></div>
</div>
<script>
// One line per row of the sheet: name, budget, spent.
const LINES = [
{ name: 'Software licences', budget: 12000, spent: 11400 },
{ name: 'Travel', budget: 8000, spent: 9350 },
{ name: 'Training', budget: 6500, spent: 3100 },
{ name: 'Office supplies', budget: 2400, spent: 2710 },
{ name: 'Events', budget: 9000, spent: 8200 }
];
const money = (n) => '$' + n.toLocaleString('en-US');
const list = document.getElementById('list');
const sum = document.getElementById('sum');
const onlyOver = document.getElementById('onlyOver');
function box(label, value) {
const d = document.createElement('div');
const s = document.createElement('span'); s.textContent = label;
const b = document.createElement('b'); b.textContent = value;
d.append(s, b);
return d;
}
const budget = LINES.reduce((s, l) => s + l.budget, 0);
const spent = LINES.reduce((s, l) => s + l.spent, 0);
sum.append(box('Budget', money(budget)), box('Spent', money(spent)), box('Lines over', String(LINES.filter((l) => l.spent > l.budget).length)));
function render() {
list.innerHTML = '';
LINES.filter((l) => !onlyOver.checked || l.spent > l.budget).forEach((l) => {
const over = l.spent > l.budget;
const pct = Math.round((l.spent / l.budget) * 100);
const item = document.createElement('div');
item.className = 'item ' + (over ? 'over' : 'ok');
item.innerHTML = '<div class="top"><b></b><span></span></div><div class="track"><i></i></div><div class="flag"></div>';
item.querySelector('b').textContent = l.name;
item.querySelector('span').textContent = money(l.spent) + ' of ' + money(l.budget);
item.querySelector('i').style.width = Math.min(pct, 100) + '%';
item.querySelector('.flag').textContent = over
? 'Over by ' + money(l.spent - l.budget) + ' (' + pct + '%)'
: money(l.budget - l.spent) + ' left (' + pct + '% used)';
list.appendChild(item);
});
}
onlyOver.addEventListener('change', render);
render();
</script>
</body>
</html>
To refresh it, copy the new cells, paste them into the chat, and ask: "Replace the rows in this page with these, and change the As of date."
Paste the new code into the same NOS document. The link you already sent shows the new page.
Show the date at the top, as both examples do. A reader who finds the link in an old email can then see how old the numbers are.
If you only need a plain table from exported data, HTML table from CSV covers that. For why a page beats a workbook, see share spreadsheet data without the file.
When it does not work
| Symptom | Cause | Fix |
|---|---|---|
| Viewers see code, not a page | The file was sent as an attachment and opened as text | Send the link, not the file |
| The total is wrong | The AI mis-added or dropped a row | Compare with the sheet and ask it to fix the list |
| A date or percentage looks odd | The format changed when the cells were pasted | Fix that line in the code, or ask the AI to format the column |
| The page is out of date | It holds a copy, not a live connection | Paste the new numbers and keep the same link |
| Charts or logos are missing | They come from another website, which the page blocks | Ask for a version with no outside images |
| You want people to enter data | The page saves nothing from visitors | Collect it in your sheet or another tool and show the results here |
For a wider look at the same idea, share a spreadsheet as a link covers numbers that readers can sort, and share AI-generated HTML explains what to check before sending any page an AI wrote.