A flowchart in HTML needs no library. Put the steps in a container and lay them out with CSS grid or flex. Lay an SVG over the same container, measure where each box landed, and draw one <path> per arrow. Redraw when anything changes size.
Try it first, then make the example narrower or wider. The arrows stay attached.
<!doctype html>
<html lang="en">
<head>
<meta charset="utf-8">
<meta name="viewport" content="width=device-width, initial-scale=1">
<title>Flowchart in HTML</title>
<style>
  body { margin: 0; padding: 20px; font-family: system-ui, sans-serif; background: #f4f5f7; }
  .chart {
    position: relative;             /* the SVG is placed inside this box */
    display: flex; flex-direction: column; align-items: center;
    gap: 36px;                      /* the gap is where the arrows go */
  }
  .chart svg {
    position: absolute; inset: 0; width: 100%; height: 100%;
    overflow: visible; pointer-events: none;
  }
  .node {
    position: relative;             /* paint the boxes above the SVG */
    padding: 12px 18px; border-radius: 8px; max-width: 70%; text-align: center;
    background: #fff; border: 2px solid #2563eb;
  }
  .start, .end { border-radius: 999px; background: #dbeafe; }
</style>
</head>
<body>
<div class="chart" id="chart">
  <svg id="lines">
    <defs>
      <marker id="arrow" viewBox="0 0 10 10" refX="10" refY="5"
              markerWidth="7" markerHeight="7" orient="auto">
        <path d="M0 0 L10 5 L0 10 z" fill="#2563eb"/>
      </marker>
    </defs>
  </svg>
  <div class="node start">Start</div>
  <div class="node">Enter your email</div>
  <div class="node">Send a sign-in code</div>
  <div class="node end">Done</div>
</div>

<script>
  const chart = document.getElementById('chart');
  const svg = document.getElementById('lines');
  const nodes = [...chart.querySelectorAll('.node')];

  function draw() {
    svg.querySelectorAll('.edge').forEach((p) => p.remove());
    const c = chart.getBoundingClientRect();
    for (let i = 0; i < nodes.length - 1; i++) {
      const a = nodes[i].getBoundingClientRect();
      const b = nodes[i + 1].getBoundingClientRect();
      // bottom-centre of one box to top-centre of the next, relative to the chart
      const x1 = a.left + a.width / 2 - c.left, y1 = a.bottom - c.top;
      const x2 = b.left + b.width / 2 - c.left, y2 = b.top - c.top;
      const path = document.createElementNS('http://www.w3.org/2000/svg', 'path');
      path.setAttribute('class', 'edge');
      path.setAttribute('d', `M${x1} ${y1} L${x2} ${y2}`);
      path.setAttribute('stroke', '#2563eb');
      path.setAttribute('stroke-width', '2');
      path.setAttribute('marker-end', 'url(#arrow)');
      svg.appendChild(path);
    }
  }

  // runs once when observing starts, then whenever the chart changes size
  new ResizeObserver(draw).observe(chart);
</script>
</body>
</html>
The layout is pure CSS. The script only reads positions the browser already worked out, so the chart reflows like the rest of the page.
Lay out the boxes with grid or flex
Treat each step as an ordinary <div>. A straight sequence is a flex column with a gap. Anything with branches is easier on a grid, because a "No" branch needs a second column.
.chart {
  position: relative;
  display: grid;
  grid-template-columns: 1fr 1fr;
  row-gap: 34px;              /* room for the arrows */
  justify-items: center;
}
Named areas make the plan readable in the CSS itself. The finished example below uses grid-template-areas, with a dot for each empty cell:
grid-template-areas:
  "start   .      "
  "check   .      "
  "stock   reorder"
  "pack    .      ";
If your diagram is a strict tree, such as a reporting line, nested lists and CSS borders may be enough. The org chart guide shows that approach. A flowchart has branches that rejoin and loops that point back up. Those need real lines.
Draw arrows from measured positions
The SVG layer sits inside the chart, stretched to its size with inset: 0. The chart needs position: relative so the SVG is placed against it. Add pointer-events: none so the layer never blocks clicks on the boxes.
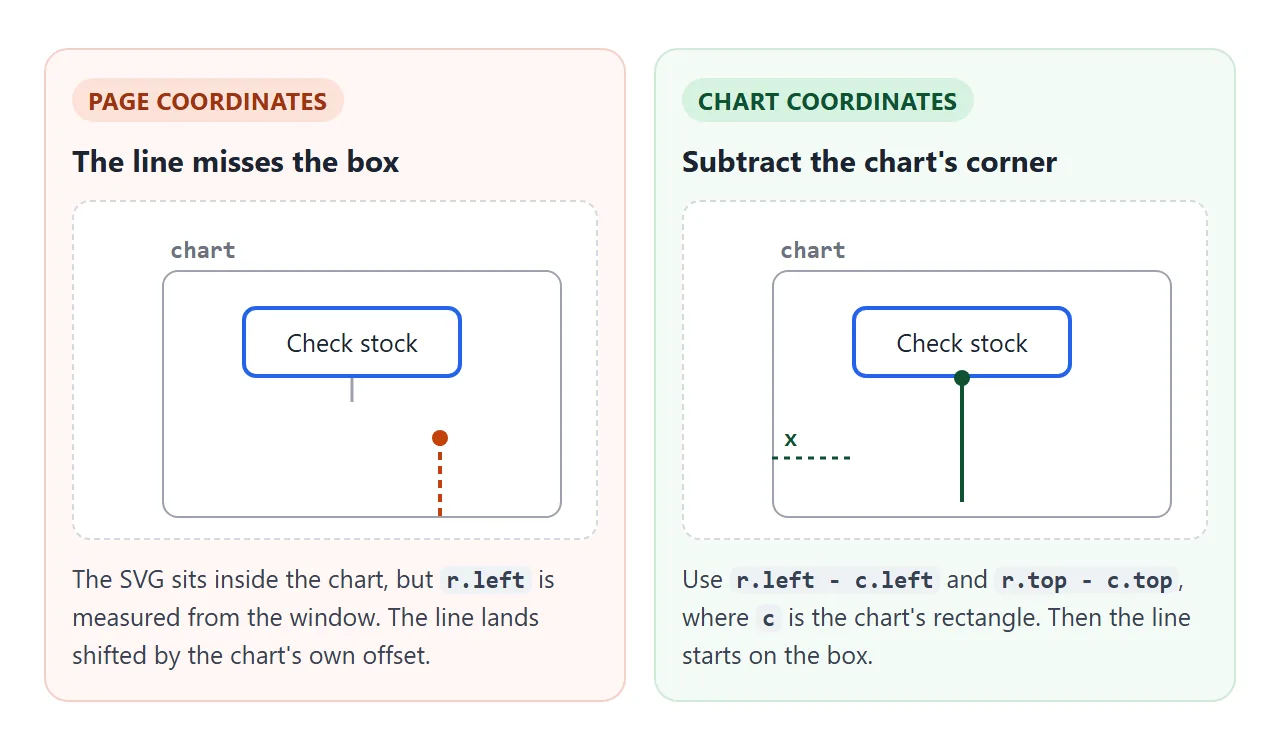
getBoundingClientRect() returns positions measured from the window, while the SVG draws from the chart's top-left corner. Subtract the chart's rectangle and you have the numbers the SVG needs. This helper returns the middle of any side:
function anchor(id, side) {
  const r = document.getElementById(id).getBoundingClientRect();
  const c = chart.getBoundingClientRect();
  const x = r.left - c.left, y = r.top - c.top;
  return {
    top:    [x + r.width / 2, y],
    bottom: [x + r.width / 2, y + r.height],
    left:   [x, y + r.height / 2],
    right:  [x + r.width, y + r.height / 2],
  }[side];
}
Scrolling moves both rectangles by the same amount, so the difference stays correct on a long page.
Each connection is one <path>. Its d attribute is a small drawing language: M moves to a point, L draws a straight line, H and V draw horizontal and vertical lines. The arrowhead is a <marker> defined once and reused:
<marker id="arrow" viewBox="0 0 10 10" refX="10" refY="5"
        markerWidth="7" markerHeight="7" orient="auto">
  <path d="M0 0 L10 5 L0 10 z" fill="#2563eb"/>
</marker>
refX="10" puts the tip of the triangle exactly on the end point, and orient="auto" turns it to follow the line. Every edge then takes marker-end="url(#arrow)".
Create the paths with createElementNS and the SVG namespace. A path made with plain createElement is an unknown HTML element and draws nothing. If you are new to inline SVG, SVG in HTML covers the basics.
Decision diamonds and elbow connectors
The decision step is a diamond. Rotating a square with transform looks like the obvious route, but it tilts the text too, and a transform does not change layout. The rotated corners spill into the gaps where the arrows run.
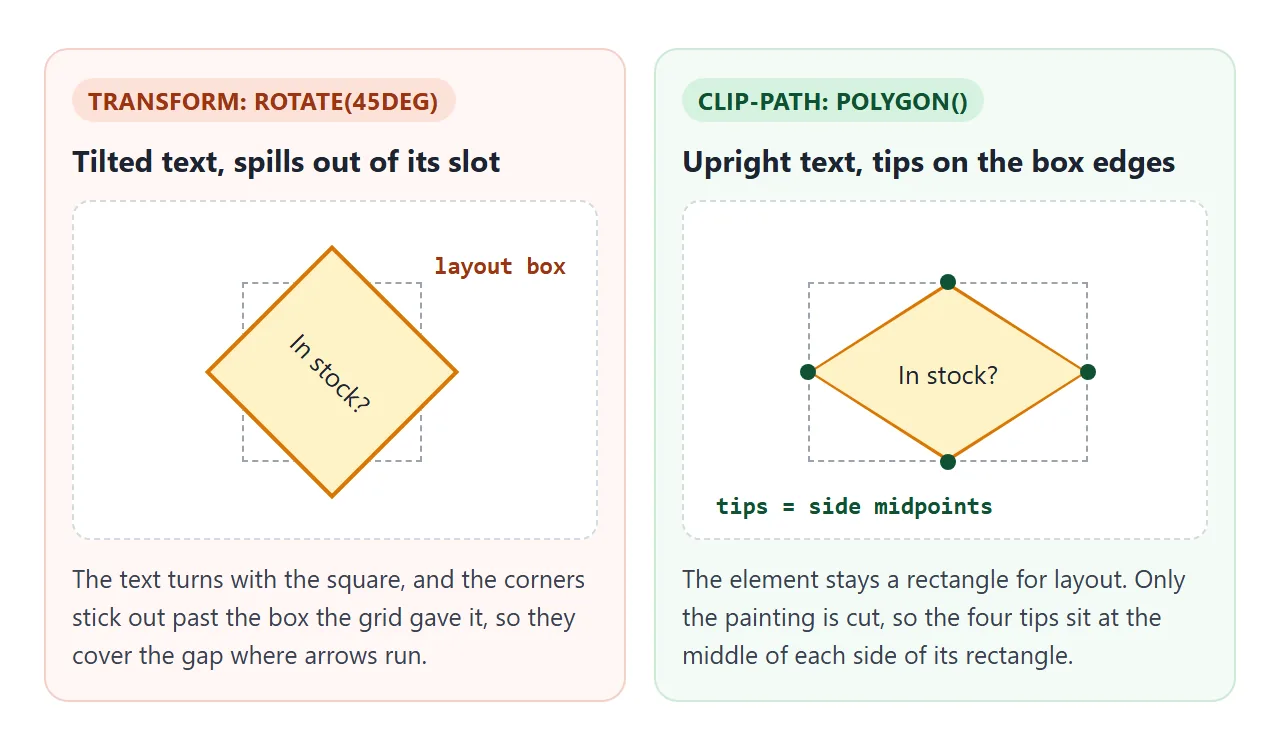
clip-path cuts the painted shape and leaves the layout box alone. The text stays upright, and the four tips land on the middle of each side, which is where anchor() already points.
.diamond {
  padding: 2px; background: #d97706;  /* the outline colour */
  clip-path: polygon(50% 0, 100% 50%, 50% 100%, 0 50%);
}
.diamond span {
  display: block; padding: 26px 34px; background: #fef3c7;
  clip-path: polygon(50% 0, 100% 50%, 50% 100%, 0 50%);
}
A border is clipped away along with everything else. The outline comes from two layers: an outer diamond in the outline colour, and an inner one in the fill colour.
Give the inner layer generous padding so the corners do not cut through the words.
A diagonal line from the diamond to a box in the next column works, but flowcharts read more easily with right angles. Tick and untick the box to compare:
<!doctype html>
<html lang="en">
<head>
<meta charset="utf-8">
<meta name="viewport" content="width=device-width, initial-scale=1">
<title>Flowchart decision diamond</title>
<style>
  body { margin: 0; padding: 16px; font-family: system-ui, sans-serif; background: #f4f5f7; }
  label { display: block; margin-bottom: 14px; font-size: 15px; }
  .chart {
    position: relative;
    display: grid; grid-template-columns: 1fr 1fr;
    row-gap: 44px; column-gap: 16px; justify-items: center; align-items: center;
  }
  .chart svg {
    position: absolute; inset: 0; width: 100%; height: 100%;
    overflow: visible; pointer-events: none;
  }
  .node {
    position: relative; padding: 12px 16px; border-radius: 8px; text-align: center;
    background: #fff; border: 2px solid #2563eb;
  }
  .start { border-radius: 999px; background: #dbeafe; }
  /* diamond: the outer layer is the outline, the inner layer the fill */
  .diamond {
    position: relative; padding: 2px; background: #d97706;
    clip-path: polygon(50% 0, 100% 50%, 50% 100%, 0 50%);
  }
  .diamond span {
    display: block; padding: 26px 34px; background: #fef3c7; text-align: center;
    clip-path: polygon(50% 0, 100% 50%, 50% 100%, 0 50%);
  }
  .edge { fill: none; stroke: #2563eb; stroke-width: 2; }
  .tag { font-size: 13px; font-weight: 700; fill: #374151; }
</style>
</head>
<body>
<label><input type="checkbox" id="elbow" checked> Elbow lines (untick for straight lines)</label>
<div class="chart" id="chart">
  <svg id="lines">
    <defs>
      <marker id="arrow" viewBox="0 0 10 10" refX="10" refY="5"
              markerWidth="7" markerHeight="7" orient="auto">
        <path d="M0 0 L10 5 L0 10 z" fill="#2563eb"/>
      </marker>
    </defs>
  </svg>
  <div class="node start" id="start">Start</div>
  <div></div>
  <div class="diamond" id="check"><span>Code<br>correct?</span></div>
  <div></div>
  <div class="node" id="ok">Sign in</div>
  <div class="node" id="err">Show an error</div>
</div>

<script>
  const chart = document.getElementById('chart');
  const svg = document.getElementById('lines');
  const elbow = document.getElementById('elbow');

  // [from id, from side, to id, to side, label]
  const edges = [
    ['start', 'bottom', 'check', 'top', ''],
    ['check', 'bottom', 'ok', 'top', 'Yes'],
    ['check', 'right', 'err', 'top', 'No'],
  ];

  // the point on one side of an element, in the chart's coordinates
  function anchor(id, side) {
    const r = document.getElementById(id).getBoundingClientRect();
    const c = chart.getBoundingClientRect();
    const x = r.left - c.left, y = r.top - c.top;
    return {
      top: [x + r.width / 2, y],
      bottom: [x + r.width / 2, y + r.height],
      left: [x, y + r.height / 2],
      right: [x + r.width, y + r.height / 2],
    }[side];
  }

  function svgEl(tag, attrs) {
    const el = document.createElementNS('http://www.w3.org/2000/svg', tag);
    for (const k in attrs) el.setAttribute(k, attrs[k]);
    return svg.appendChild(el);
  }

  // right-angle path: leave along the start side, arrive along the end side
  function route(x1, y1, outH, x2, y2, inH) {
    const mx = (x1 + x2) / 2, my = (y1 + y2) / 2;
    if (outH && inH) return `M${x1} ${y1} H${mx} V${y2} H${x2}`;
    if (!outH && !inH) return `M${x1} ${y1} V${my} H${x2} V${y2}`;
    if (outH) return `M${x1} ${y1} H${x2} V${y2}`;   // sideways, then down
    return `M${x1} ${y1} V${y2} H${x2}`;              // down, then sideways
  }

  function draw() {
    svg.querySelectorAll('.edge, .tag').forEach((el) => el.remove());
    for (const [from, fs, to, ts, label] of edges) {
      const [x1, y1] = anchor(from, fs);
      const [x2, y2] = anchor(to, ts);
      const across = fs === 'left' || fs === 'right';
      const d = elbow.checked ? route(x1, y1, across, x2, y2, ts === 'left' || ts === 'right')
                              : `M${x1} ${y1} L${x2} ${y2}`;
      svgEl('path', { class: 'edge', d, 'marker-end': 'url(#arrow)' });
      if (label) {
        const t = svgEl('text', across ? { x: x1 + 8, y: y1 - 8 } : { x: x1 + 8, y: y1 + 18 });
        t.setAttribute('class', 'tag');
        t.textContent = label;
      }
    }
  }

  elbow.addEventListener('change', draw);
  new ResizeObserver(draw).observe(chart);
</script>
</body>
</html>
Which right-angled path to draw depends on the two sides the line leaves and enters:
| Leaves from | Enters at | Path after M x1 y1 |
|---|---|---|
| bottom or top | top or bottom | V midY H x2 V y2 |
| left or right | left or right | H midX V y2 H x2 |
| left or right | top or bottom | H x2 V y2 |
| bottom or top | left or right | V y2 H x2 |
The rule is to leave along the start side and arrive along the end side, so the arrowhead always points into the box. In code, that table is one function:
function route(x1, y1, outH, x2, y2, inH) {
  const mx = (x1 + x2) / 2, my = (y1 + y2) / 2;
  if (outH && inH) return `M${x1} ${y1} H${mx} V${y2} H${x2}`;
  if (!outH && !inH) return `M${x1} ${y1} V${my} H${x2} V${y2}`;
  if (outH) return `M${x1} ${y1} H${x2} V${y2}`;
  return `M${x1} ${y1} V${y2} H${x2}`;
}
Keep the connections as data, one entry per arrow:
const edges = [
  ['stock', 'bottom', 'pack', 'top', 'Yes'],
  ['stock', 'right', 'reorder', 'left', 'No'],
];
Adding an arrow is then one more line in a list, not new drawing code.
Redraw when anything resizes
The numbers in a d attribute are fixed when you write them. When the layout changes, the boxes move and the paths do not.
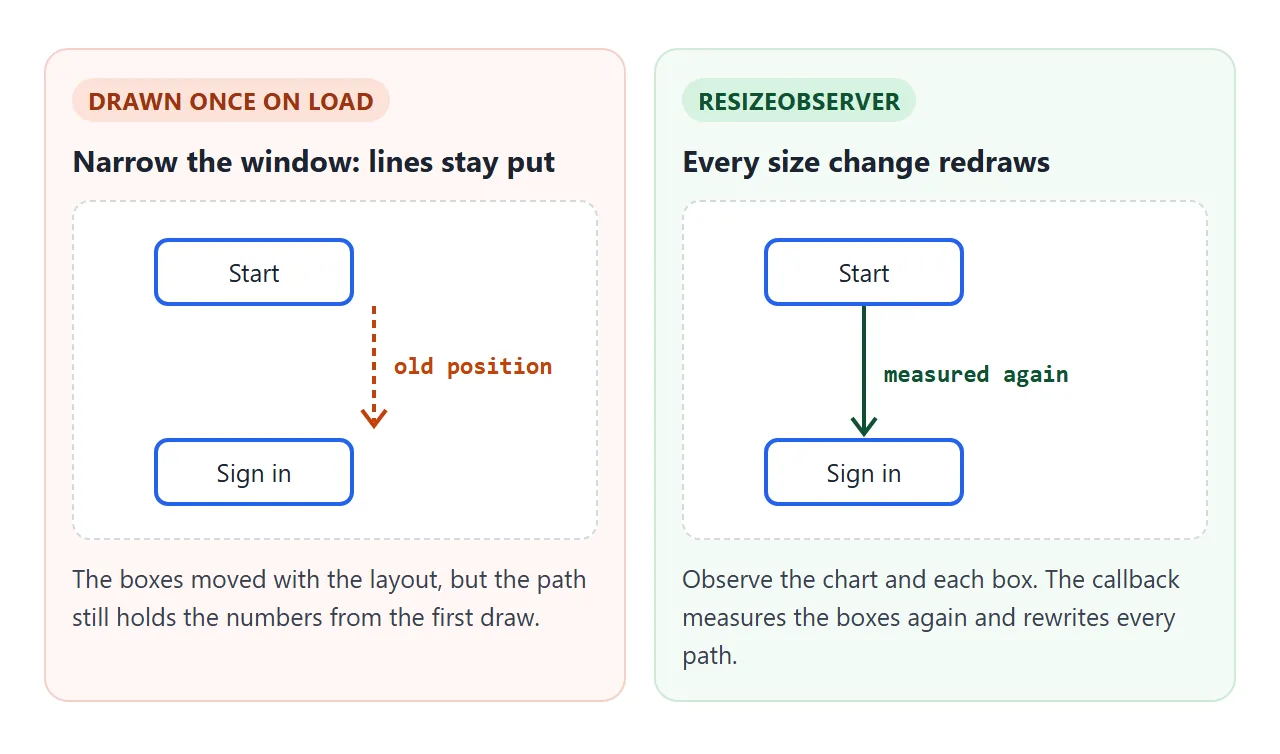
A ResizeObserver calls your function when an element changes size. It also calls it once when you start observing, so it doubles as the first draw:
const ro = new ResizeObserver(draw);
ro.observe(chart);
chart.querySelectorAll('.node, .diamond').forEach((n) => ro.observe(n));
Watch the boxes as well as the chart. A label that wraps onto a second line makes one box taller and pushes the boxes below it down.
That can happen without the window changing size, so a listener on the window resize event would miss it.
The draw function should first remove the old paths, then add new ones. Keep the <defs> with the marker, and remove only elements with your edge class.
A finished flowchart
This one puts it all together: a grid with named areas, a decision diamond, labelled Yes and No branches, and a dashed arrow that loops back up. Press the button to make one box taller and watch the arrows below it follow.
<!doctype html>
<html lang="en">
<head>
<meta charset="utf-8">
<meta name="viewport" content="width=device-width, initial-scale=1">
<title>Order flowchart</title>
<style>
  body { margin: 0; padding: 16px; font-family: system-ui, sans-serif; background: #f4f5f7; }
  button { margin-bottom: 16px; padding: 8px 14px; font: inherit; border-radius: 8px;
           border: 1px solid #9ca3af; background: #fff; cursor: pointer; }
  .chart {
    position: relative; max-width: 560px;
    display: grid; grid-template-columns: 1fr 1fr;
    grid-template-areas:
      "start   .      "
      "check   .      "
      "stock   reorder"
      "pack    .      "
      "ship    .      "
      "end     .      ";
    row-gap: 34px; column-gap: 16px; justify-items: center; align-items: center;
  }
  .chart svg { position: absolute; inset: 0; width: 100%; height: 100%;
               overflow: visible; pointer-events: none; }
  .node { position: relative; padding: 10px 14px; border-radius: 8px; text-align: center;
          background: #fff; border: 2px solid #2563eb; max-width: 100%; box-sizing: border-box; }
  .pill { border-radius: 999px; background: #dbeafe; }
  .diamond { position: relative; padding: 2px; background: #d97706;
             clip-path: polygon(50% 0, 100% 50%, 50% 100%, 0 50%); }
  .diamond span { display: block; padding: 24px 32px; background: #fef3c7; text-align: center;
                  clip-path: polygon(50% 0, 100% 50%, 50% 100%, 0 50%); }
  .edge { fill: none; stroke: #2563eb; stroke-width: 2; }
  .edge.back { stroke: #d97706; stroke-dasharray: 6 4; }
  .tag { font-size: 13px; font-weight: 700; fill: #374151; }
</style>
</head>
<body>
<button id="longer" type="button">Make one box taller</button>
<div class="chart" id="chart">
  <svg id="lines">
    <defs>
      <marker id="arrow" viewBox="0 0 10 10" refX="10" refY="5"
              markerWidth="7" markerHeight="7" orient="auto">
        <path d="M0 0 L10 5 L0 10 z" fill="#2563eb"/>
      </marker>
      <marker id="arrow-back" viewBox="0 0 10 10" refX="10" refY="5"
              markerWidth="7" markerHeight="7" orient="auto">
        <path d="M0 0 L10 5 L0 10 z" fill="#d97706"/>
      </marker>
    </defs>
  </svg>
  <div class="node pill" id="start" style="grid-area:start">Order received</div>
  <div class="node" id="check" style="grid-area:check">Check the stock</div>
  <div class="diamond" id="stock" style="grid-area:stock"><span>In<br>stock?</span></div>
  <div class="node" id="reorder" style="grid-area:reorder">Order from supplier</div>
  <div class="node" id="pack" style="grid-area:pack">Pack the order</div>
  <div class="node" id="ship" style="grid-area:ship">Ship it</div>
  <div class="node pill" id="end" style="grid-area:end">Done</div>
</div>

<script>
  const chart = document.getElementById('chart');
  const svg = document.getElementById('lines');

  // [from id, from side, to id, to side, label, extra class]
  const edges = [
    ['start', 'bottom', 'check', 'top'],
    ['check', 'bottom', 'stock', 'top'],
    ['stock', 'bottom', 'pack', 'top', 'Yes'],
    ['stock', 'right', 'reorder', 'left', 'No'],
    ['reorder', 'top', 'check', 'right', '', 'back'],   // loop back up
    ['pack', 'bottom', 'ship', 'top'],
    ['ship', 'bottom', 'end', 'top'],
  ];

  function anchor(id, side) {
    const r = document.getElementById(id).getBoundingClientRect();
    const c = chart.getBoundingClientRect();
    const x = r.left - c.left, y = r.top - c.top;
    return {
      top: [x + r.width / 2, y],
      bottom: [x + r.width / 2, y + r.height],
      left: [x, y + r.height / 2],
      right: [x + r.width, y + r.height / 2],
    }[side];
  }

  // right-angle path: leave along the start side, arrive along the end side
  function route(x1, y1, outH, x2, y2, inH) {
    const mx = (x1 + x2) / 2, my = (y1 + y2) / 2;
    if (outH && inH) return `M${x1} ${y1} H${mx} V${y2} H${x2}`;
    if (!outH && !inH) return `M${x1} ${y1} V${my} H${x2} V${y2}`;
    if (outH) return `M${x1} ${y1} H${x2} V${y2}`;
    return `M${x1} ${y1} V${y2} H${x2}`;
  }

  function svgEl(tag, attrs) {
    const el = document.createElementNS('http://www.w3.org/2000/svg', tag);
    for (const k in attrs) el.setAttribute(k, attrs[k]);
    return svg.appendChild(el);
  }

  function draw() {
    svg.querySelectorAll('.edge, .tag').forEach((el) => el.remove());
    for (const [from, fs, to, ts, label = '', extra = ''] of edges) {
      const [x1, y1] = anchor(from, fs);
      const [x2, y2] = anchor(to, ts);
      const outH = fs === 'left' || fs === 'right';
      const d = route(x1, y1, outH, x2, y2, ts === 'left' || ts === 'right');
      const marker = extra === 'back' ? 'url(#arrow-back)' : 'url(#arrow)';
      svgEl('path', { class: ('edge ' + extra).trim(), d, 'marker-end': marker });
      if (label) {
        const t = svgEl('text', outH ? { x: x1 + 6, y: y1 - 8 } : { x: x1 + 8, y: y1 + 18 });
        t.setAttribute('class', 'tag');
        t.textContent = label;
      }
    }
  }

  // watch the chart and every box: a box can grow without the chart changing width
  const ro = new ResizeObserver(draw);
  ro.observe(chart);
  chart.querySelectorAll('.node, .diamond').forEach((n) => ro.observe(n));

  document.getElementById('longer').addEventListener('click', () => {
    const pack = document.getElementById('pack');
    pack.textContent = pack.textContent === 'Pack the order'
      ? 'Pack the order, print the label and weigh the box'
      : 'Pack the order';
  });
</script>
</body>
</html>
- Loop back: the arrow from "Order from supplier" leaves from its top and enters "Check the stock" from the right. That is the last row of the table, with the line going up instead of down.
- Labels: each Yes or No is an SVG
<text>placed a few pixels from the start of its edge. - A second colour: each marker has its own fill, so the dashed loop uses a second marker in orange.
When it does not work
| What you see | Cause | Fix |
|---|---|---|
| Arrows are shifted away from the boxes | Positions taken from the window, not the chart | Subtract the chart's left and top |
| The SVG covers the page, not the chart | The chart is not positioned | position: relative on the chart |
| Nothing is drawn | Paths made with createElement |
Use createElementNS with the SVG namespace |
| Boxes cannot be clicked | The SVG layer takes the clicks | pointer-events: none on the SVG |
| Arrowhead sits past or short of the box | refX does not match the tip |
Set refX to the x of the triangle's tip |
| Lines stay put after resizing | Drawn once on load | Redraw from a ResizeObserver |
| Lines lag behind when one box grows | Only the window is watched | Observe every box too |
| The diamond's corners cover the arrows | rotate(45deg) does not change layout |
Use clip-path: polygon() |
| Arrows are off inside a scaled chart | transform: scale() on the chart scales the measured sizes |
Divide by the scale, or do not scale the chart |
Share it as a link
A flowchart is often made to be read by someone else: a team, a client, a new hire. A screenshot cannot be corrected once sent, and an .html attachment may not open at all on a phone.
To send the working version, paste the page into a NOS document and choose Create share link. HTML to link walks through it.
The page renders as written and its scripts run, so the arrows are drawn and redrawn on the reader's own screen. If you change a step later, the same link shows the new version.