An org chart online is a reporting hierarchy published at an address, so the chart people open is the current one rather than whichever copy reached their inbox. Building it takes nested HTML lists and a little CSS, with no library needed for the common top-down shape.
The part that usually goes wrong is not the drawing. It is distribution. A chart in a file on your machine is out of date the day someone changes team.
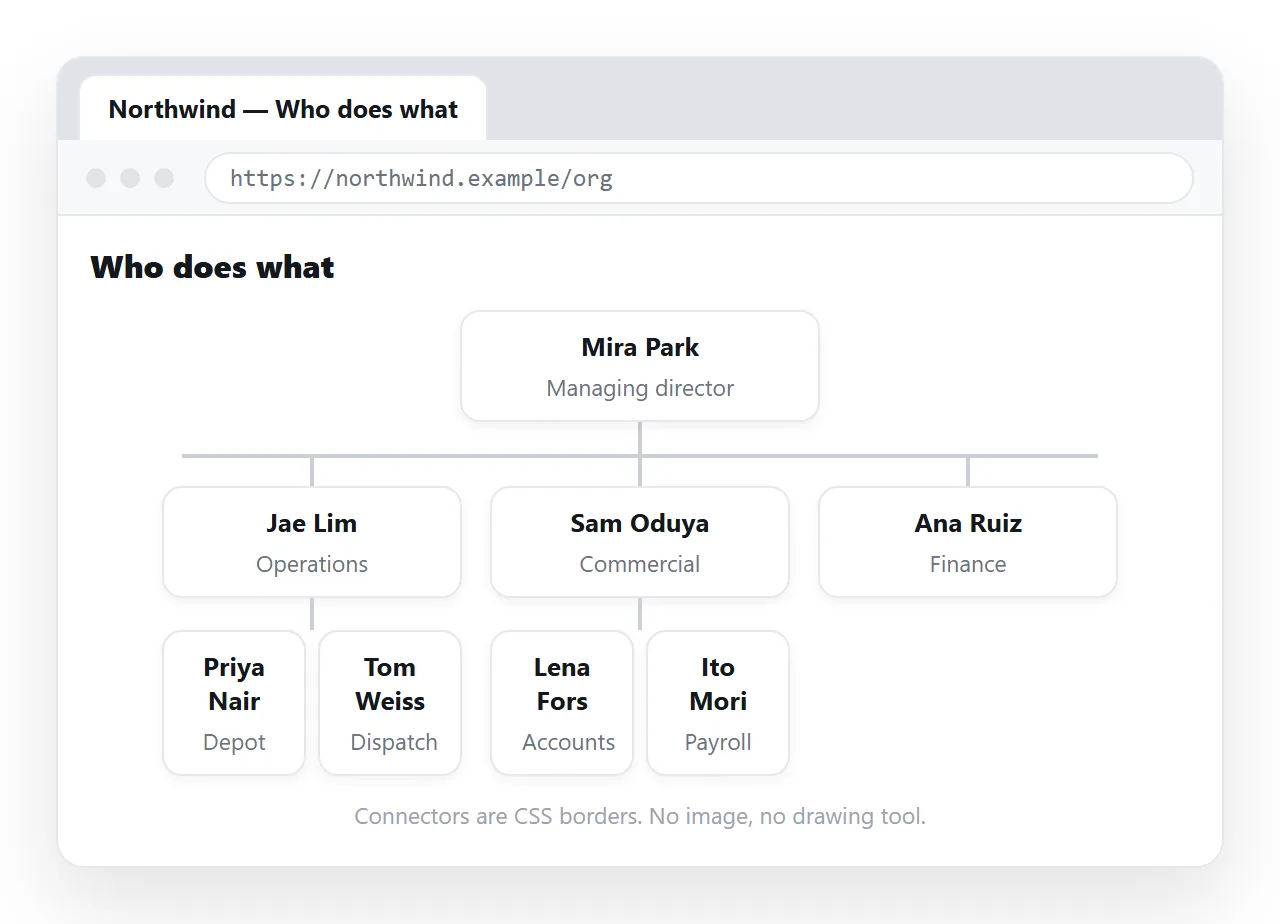
This guide covers the markup, the CSS for the lines, the phone layout, and how to put the chart at an address so the version people open is the current one.
Start with nested lists, not boxes
The hierarchy is the data. Write it first and style it second.
<ul class="org">
  <li>
    <div class="node">Head of Operations</div>
    <ul>
      <li><div class="node">Support Lead</div></li>
      <li>
        <div class="node">Logistics Lead</div>
        <ul>
          <li><div class="node">Warehouse Manager</div></li>
        </ul>
      </li>
    </ul>
  </li>
</ul>
Nesting carries the reporting line by itself. Strip the CSS and the document still reads correctly, which is what screen readers and search engines get.
A grid of absolutely positioned boxes looks the same and reads as noise. Use semantic HTML here and the accessibility work is mostly already done.
Draw the lines with CSS
Each connector is two short segments: a vertical drop from the parent, and a horizontal run to the child. Both are borders on pseudo-elements.
.org ul { display: flex; justify-content: center; gap: 1.5rem; }
.org li { position: relative; padding-top: 1.5rem; list-style: none; }
.org li::before {
  content: ""; position: absolute; top: 0; left: 50%;
  height: 1.5rem; border-left: 1px solid #555;
}
That is the drop line. The horizontal run is a second pseudo-element on the same item, stretched across the row and trimmed on the first and last child.
Keep the line colour separate from the box border colour. When they match, deep charts turn into a mesh and readers lose the branch they were following.
When a library earns its place
| What you need | Plain HTML and CSS | A charting library |
|---|---|---|
| Under about 60 people, fixed layout | Fine | Overkill |
| Collapsible branches | Needs a little JavaScript | Built in |
| Drag to reorganise | No | Built in |
| Reads correctly with CSS disabled | Yes | Depends on the library |
| Prints on one page | Yes, with a print rule | Often not |
| Loads with no network | Yes | Only if you inline the library |
Most internal charts sit in the first row. If you do pull in a library, inline it rather than linking to a CDN, so the page still works as a self-contained file.
Make it survive a phone
A five-level chart at desktop width is a horizontal scroll on a phone, and horizontal scroll inside a page is the layout people abandon.
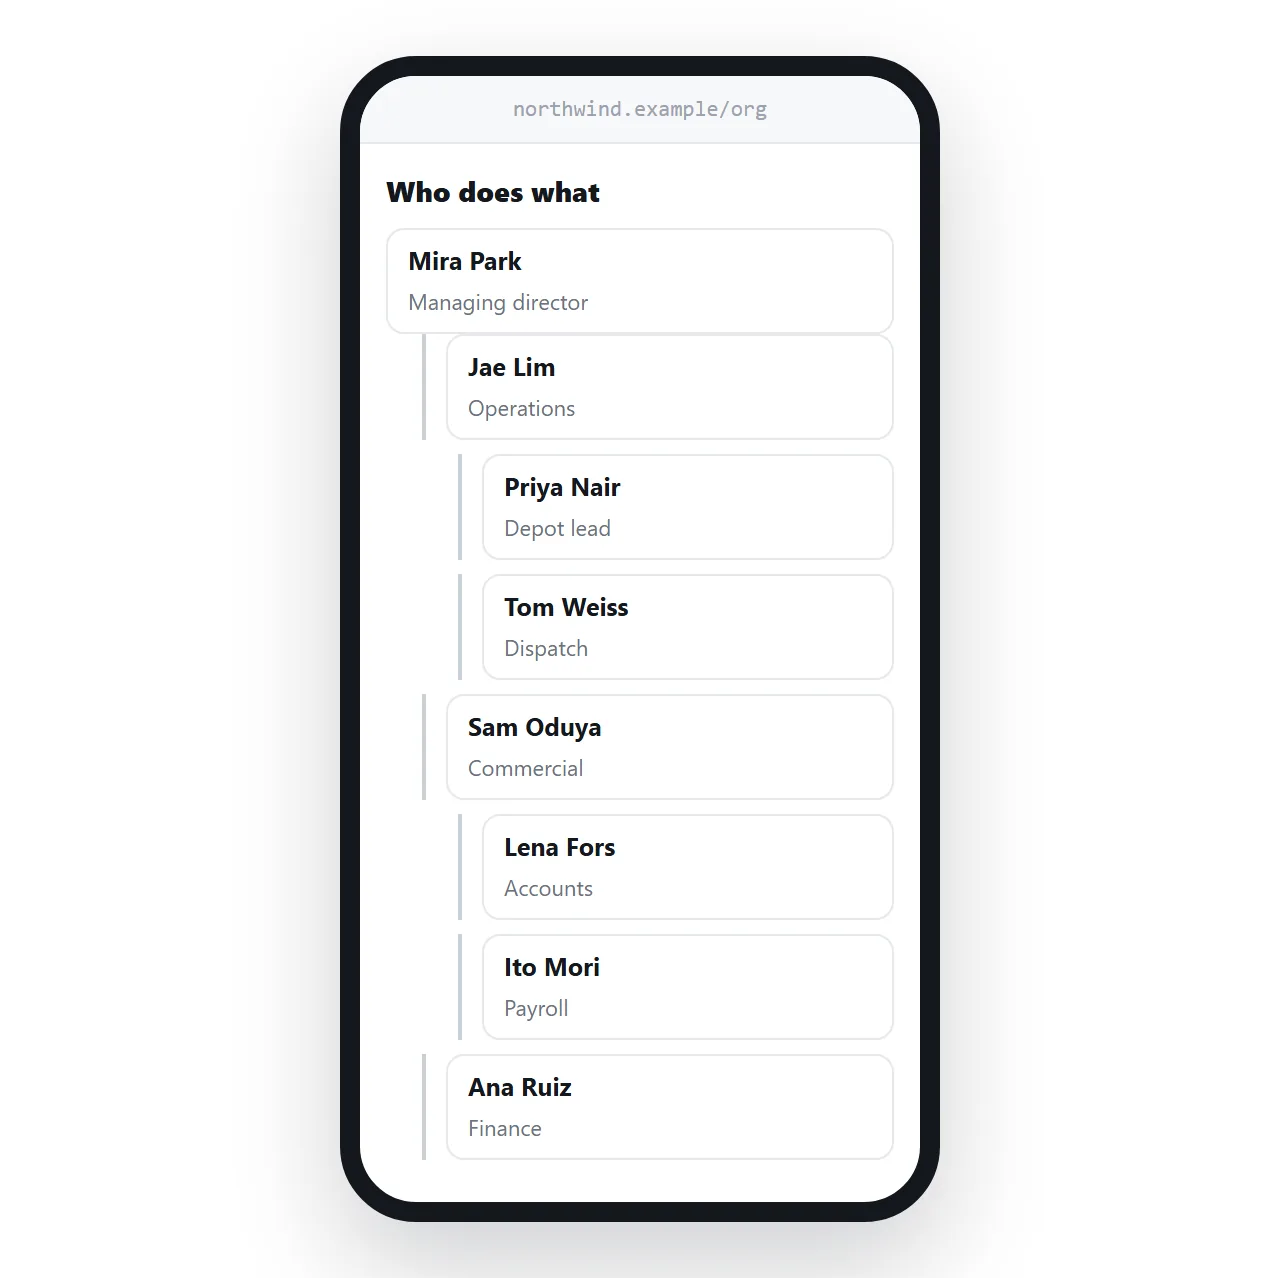
Switch the direction below a breakpoint. The reports stack vertically, indentation shows depth, and the connector becomes a single vertical spine.
@media (max-width: 700px) {
  .org ul { flex-direction: column; align-items: flex-start; }
  .org li { padding-left: 1.5rem; padding-top: 0.5rem; }
}
Check the viewport meta tag is present. Without it the phone renders at desktop width and shrinks everything, which no media query can undo.
Photos, initials, or neither
Headshots make a chart friendlier and make the file heavier. Three options, in order of how often they break.
- No images. Name and role only. Nothing to load, nothing to go missing.
- CSS initials. A circle with two letters, drawn by CSS. No requests at all.
- Embedded photos. Convert each to a base64 data URI so the chart travels as one file.
Linking photos from a folder next to the file is the option that fails. Those relative paths stop resolving the moment the page moves, and you get a chart of broken image icons.
Put the HTML org chart at an address
A chart is read by many people and edited by one. That is exactly the case where sending the file is the wrong move, and it is what most people try first.
- Open your file in the HTML file opener. If the lines and photos survive in a window that has never seen your folder, they will survive for readers.
- Paste the HTML into a NOS document. It renders as a page of its own, CSS and scripts included.
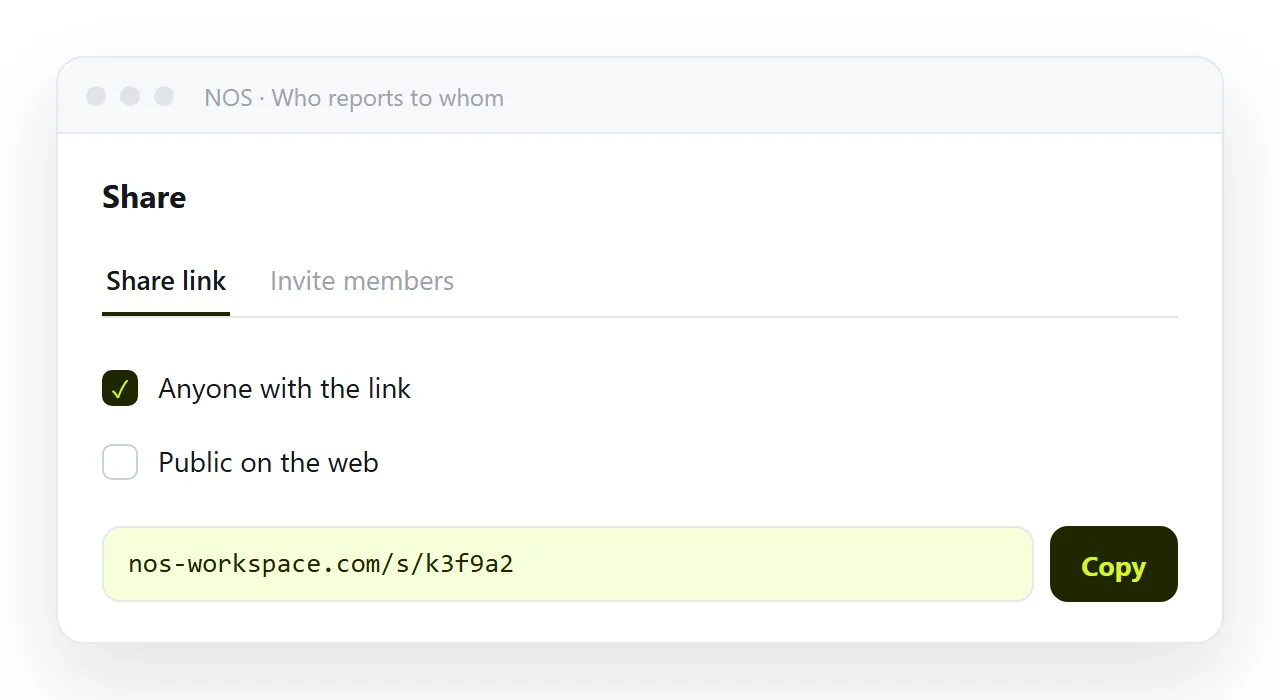
- Create the share link. Share, then Share link, then Create link. It stays unlisted unless you tick Public on the web, which matters for an internal chart.
- Send the link. Put it in the team channel or the handbook, not in an attachment.
Keeping it correct after someone moves team
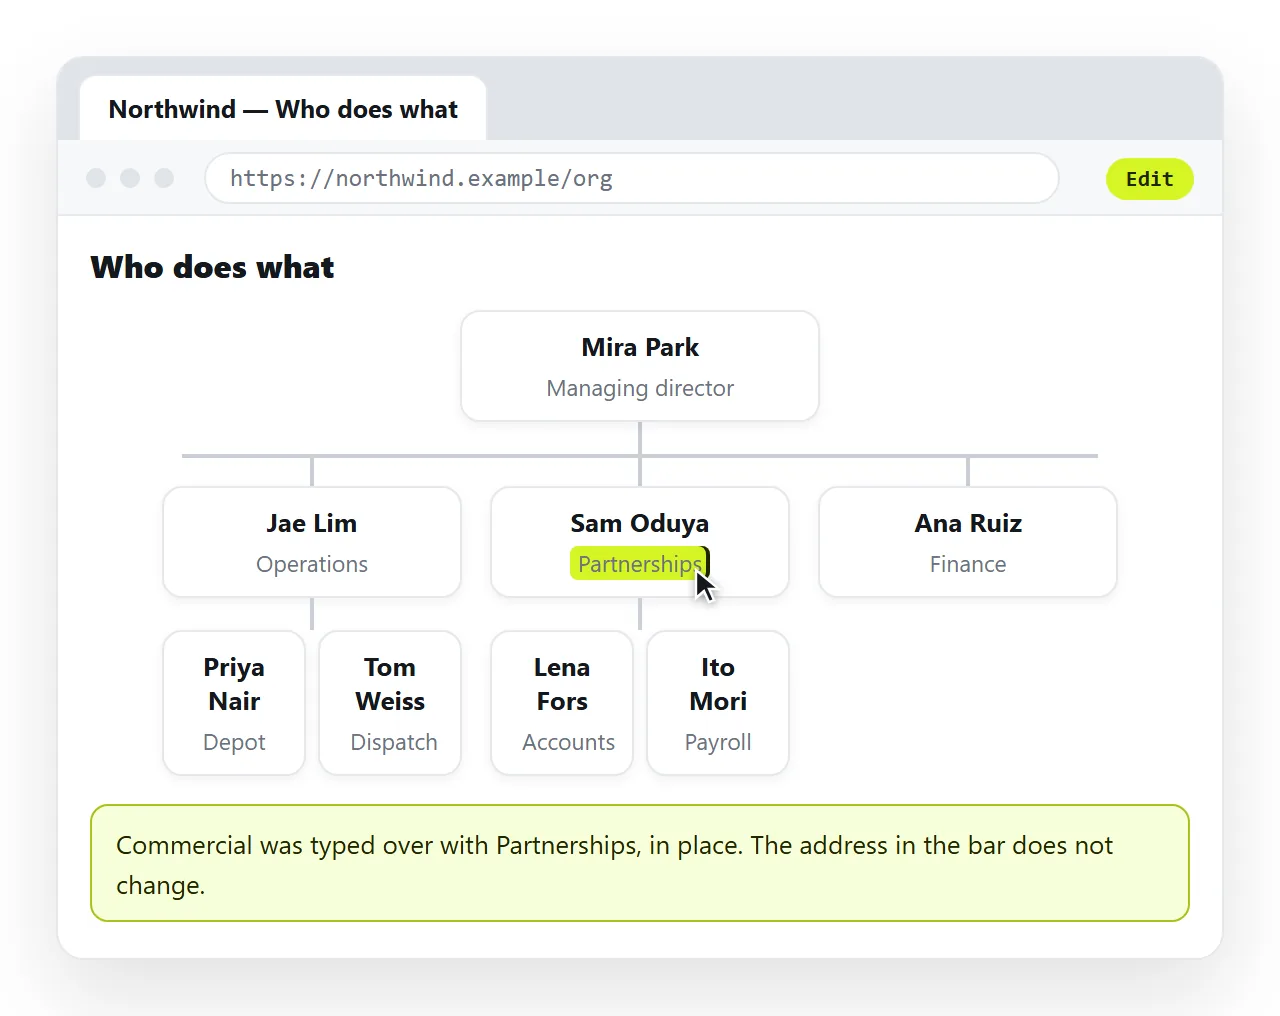
This is where the file route collapses and the link route pays off. The address does not change when the content does.
Click a name in the document and retype it. No re-export, no second email, no two versions circulating with nobody sure which is current.
If the chart is generated from a people system, paste the regenerated HTML over the old content in the same document. The link stays the same and the readers do nothing.
For the same reason a chart of dates belongs at an address too, which is what the HTML gantt chart guide covers.
A short checklist before you send it
- Does the chart render in a window that has never seen your project folder?
- Is there a
<title>? It is what the browser tab and any preview card show. - Is the viewport line present, and does the phone layout actually stack?
- Are photos embedded rather than linked to a local folder?
- Is Public on the web unticked if the chart names employees?
The last one is worth a second look. An unlisted link is not a password, so treat a company chart as something that will be forwarded, and invite named people instead when that matters.