A QBR template that works on every screen is one page with five blocks: the quarter in one line, results against target, risks with owners, the plan for next quarter, and the decision you need.
Build it as a web page and you send one link instead of a file.
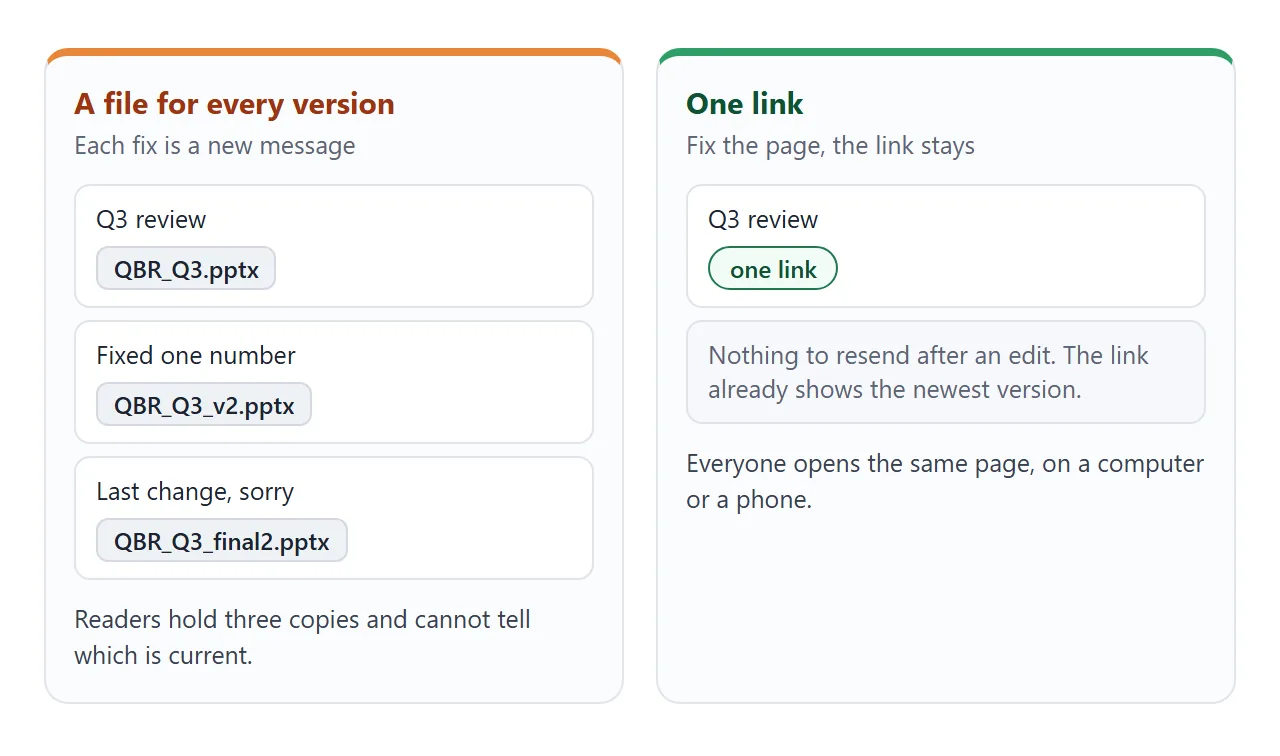
The pain it removes is small fixes. One blog post about AI-made slide decks lists, among its complaints, that the author couldn't "tweak one bullet without regenerating the whole thing". A page that you edit in place avoids that.
Here is a finished sample, with made-up numbers. Scroll it, then copy the structure.
<!doctype html>
<html lang="en">
<head>
<meta charset="utf-8">
<meta name="viewport" content="width=device-width, initial-scale=1">
<title>Q3 2026 business review</title>
<style>
  * { box-sizing: border-box; }
  body { margin: 0; background: #f3f4f7; font-family: system-ui, "Segoe UI", sans-serif; color: #1d2330; line-height: 1.5; }
  .page { max-width: 760px; margin: 0 auto; padding: 20px 16px 28px; }
  header { margin-bottom: 14px; }
  .eyebrow { font-size: 12px; font-weight: 700; letter-spacing: .06em; text-transform: uppercase; color: #5b6475; }
  h1 { margin: 4px 0 6px; font-size: 26px; line-height: 1.2; }
  .sub { margin: 0; color: #5b6475; font-size: 14px; }
  section { background: #fff; border: 1px solid #e1e4ea; border-radius: 12px; padding: 16px 18px; margin-top: 12px; }
  h2 { margin: 0 0 10px; font-size: 16px; }
  .headline { border-left: 5px solid #1f7a4d; }
  .headline p { margin: 0; font-size: 16px; }
  .tiles { display: grid; grid-template-columns: repeat(4, 1fr); gap: 10px; }
  .tile { border: 1px solid #e1e4ea; border-radius: 10px; padding: 10px 12px; }
  .tile .v { font-size: 22px; font-weight: 700; }
  .tile .l { font-size: 12px; color: #5b6475; }
  .tile .d { font-size: 12px; font-weight: 600; margin-top: 2px; }
  .up { color: #17663f; } .down { color: #b4410f; }
  table { width: 100%; border-collapse: collapse; font-size: 14px; }
  th, td { text-align: left; padding: 8px 8px; border-bottom: 1px solid #edf0f4; vertical-align: top; }
  th { font-size: 12px; text-transform: uppercase; letter-spacing: .04em; color: #5b6475; }
  .chip { display: inline-block; padding: 1px 9px; border-radius: 999px; font-size: 12px; font-weight: 700; white-space: nowrap; }
  .hit { background: #d9f2e3; color: #11583a; }
  .miss { background: #fde3d3; color: #8f3306; }
  .near { background: #fff0c2; color: #6b4a00; }
  .chart svg { width: 100%; max-width: 440px; height: auto; display: block; margin: 0 auto; }
  .plan { margin: 0; padding-left: 20px; }
  .plan li { margin-bottom: 8px; }
  .plan small { color: #5b6475; }
  .ask { background: #fff9e6; border-color: #f0dc9a; }
  .ask p { margin: 0; }
  @media (max-width: 560px) {
    .tiles { grid-template-columns: repeat(2, 1fr); }
    h1 { font-size: 22px; }
    .cut { display: none; }
  }
</style>
</head>
<body>
<div class="page">
  <header>
    <div class="eyebrow">Quarterly business review · Q3 2026 (Jul to Sep)</div>
    <h1>Harbor Lane Software: Q3 review</h1>
    <p class="sub">Sample page with made-up numbers. Prepared for the leadership meeting on 8 October.</p>
  </header>

  <section class="headline">
    <h2>The quarter in one line</h2>
    <p>Revenue beat target by 6% and churn came in under goal, but the new onboarding flow shipped three weeks late.</p>
  </section>

  <section>
    <h2>Results against target</h2>
    <div class="tiles">
      <div class="tile"><div class="v">$412k</div><div class="l">Revenue (target $390k)</div><div class="d up">+6% vs target</div></div>
      <div class="tile"><div class="v">1.9%</div><div class="l">Monthly churn (goal 2.5%)</div><div class="d up">0.6 pts better</div></div>
      <div class="tile"><div class="v">38</div><div class="l">New customers (target 45)</div><div class="d down">7 short</div></div>
      <div class="tile"><div class="v">92%</div><div class="l">Support answered in 1 day (goal 90%)</div><div class="d up">+2 pts</div></div>
    </div>
    <div class="chart" style="margin-top:14px">
      <svg viewBox="0 0 400 170" role="img" aria-label="Monthly revenue against the monthly target">
        <rect x="50" y="51.4" width="70" height="88.6" rx="4" fill="#9db4d6"/>
        <rect x="165" y="49.3" width="70" height="90.7" rx="4" fill="#9db4d6"/>
        <rect x="280" y="34.1" width="70" height="105.9" rx="4" fill="#2f6fbf"/>
        <line x1="10" y1="50" x2="390" y2="50" stroke="#5b6475" stroke-dasharray="5 4"/>
        <text x="10" y="40" font-size="13" fill="#5b6475">Monthly target $130k</text>
        <text x="85" y="160" font-size="13" text-anchor="middle" fill="#1d2330">Jul $128k</text>
        <text x="200" y="160" font-size="13" text-anchor="middle" fill="#1d2330">Aug $131k</text>
        <text x="315" y="160" font-size="13" text-anchor="middle" fill="#1d2330">Sep $153k</text>
      </svg>
    </div>
    <table style="margin-top:8px">
      <tr><th>Goal</th><th>Result</th><th class="cut">Note</th></tr>
      <tr><td>Revenue $390k</td><td><span class="chip hit">Hit</span></td><td class="cut">September carried the quarter</td></tr>
      <tr><td>45 new customers</td><td><span class="chip miss">Missed</span></td><td class="cut">Trials were fine, conversions were slow</td></tr>
      <tr><td>Onboarding flow live by 15 Aug</td><td><span class="chip near">Late</span></td><td class="cut">Shipped 5 September</td></tr>
    </table>
  </section>

  <section>
    <h2>Risks</h2>
    <table>
      <tr><th>Risk</th><th>Owner</th><th>Status</th></tr>
      <tr><td>Two large accounts renew in November</td><td>Dana</td><td><span class="chip near">Watch</span></td></tr>
      <tr><td>Conversion from trial is below plan</td><td>Marcus</td><td><span class="chip miss">Open</span></td></tr>
      <tr><td>Hosting contract ends in December</td><td>Priya</td><td><span class="chip hit">Handled</span></td></tr>
    </table>
  </section>

  <section>
    <h2>Plan for Q4</h2>
    <ol class="plan">
      <li><strong>Lift trial-to-paid conversion to 22%.</strong><br><small>Owner: Marcus · checkpoint 15 November</small></li>
      <li><strong>Renew both large accounts.</strong><br><small>Owner: Dana · done by 30 November</small></li>
      <li><strong>Launch the mobile view of reports.</strong><br><small>Owner: Priya · release 12 December</small></li>
    </ol>
  </section>

  <section class="ask">
    <h2>Decision needed</h2>
    <p>Approve one extra support hire for Q4, so onboarding calls stay within a day. Answer by 15 October.</p>
  </section>
</div>
</body>
</html>
What goes on a QBR page
Readers of a QBR want to know three things: how the quarter went, what could go wrong, and what happens next. Each block answers one of them, in the order a busy reader scans.
| Block | Question it answers | What to put in it |
|---|---|---|
| The quarter in one line | Was it a good quarter? | One sentence with the biggest win and the biggest miss |
| Results against target | Did we hit the goals? | Each target next to its result, with Hit, Close or Missed |
| Risks | What could go wrong? | A short list, each with an owner and a status |
| Plan for next quarter | What happens next? | Three goals, each with an owner and a date |
| Decision needed | What do you need from the reader? | One ask and the day you need the answer |
Keep every block short. A long explanation belongs on its own page, linked from the QBR.
Make it with AI
Any of ChatGPT, Claude or Gemini can turn your numbers into this page. The AI cannot know your figures, so paste them in. Copy this prompt and fill the brackets.
Make one self-contained HTML page for a quarterly business
review of [team or company], for [quarter and year].
Sections in this order: the quarter in one line, results
against target (a tile per metric plus a small table with
Hit, Close or Missed), risks (owner and status), plan for
next quarter (three goals, each with an owner and a date),
and one decision needed.
Use only the numbers below. If something is missing, write
TODO instead of guessing.
One column on a phone, readable on a laptop. Draw any chart
as inline SVG. No external images, scripts or fonts.
Numbers: [paste targets, results, risks, plan]
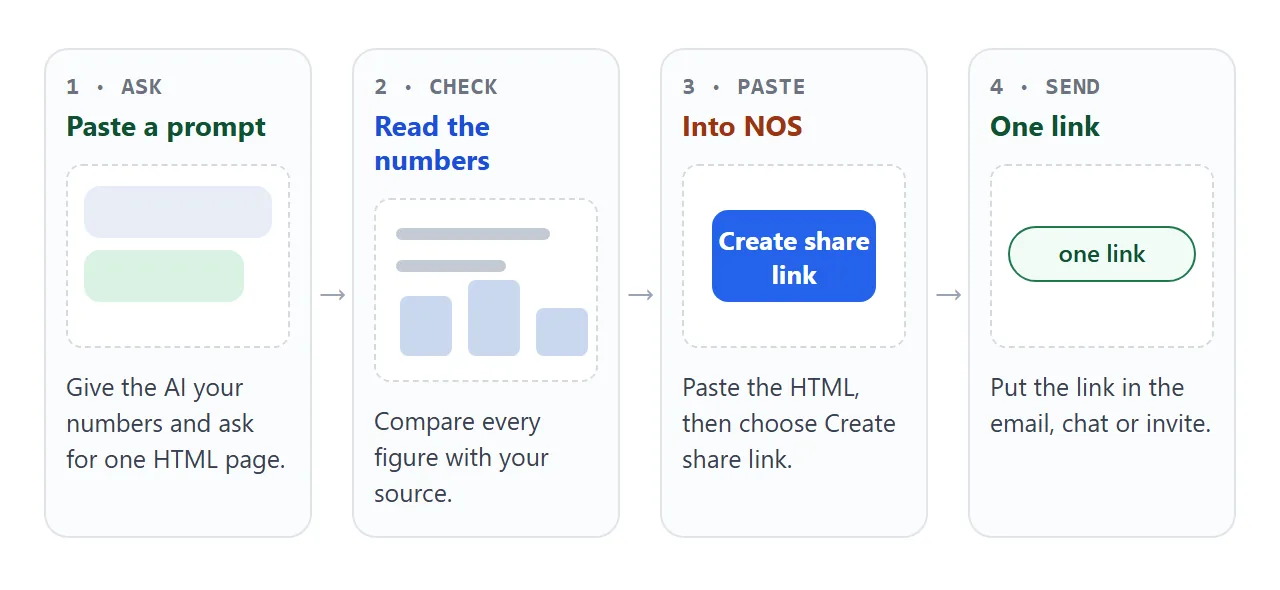
Before you send it, check the result:
- Every figure. Compare each number, name and date with your source. AI tools sometimes fill a gap with a plausible value.
- Any TODO. Replace it or delete the line.
- The statuses. A target of 45 and a result of 38 must read Missed, not Close.
- Your phone. Open the page on a phone and scroll to the end.
Keep the numbers honest
Status words are where a review quietly goes wrong, because someone has to decide what counts as Close. Fix the rule once.
In the scorecard below, 100% of target or better is Hit, 90% to 99% is Close, and anything lower is Missed. For a goal where smaller is better, such as churn, the rule flips.
<!doctype html>
<html lang="en">
<head>
<meta charset="utf-8">
<meta name="viewport" content="width=device-width, initial-scale=1">
<title>QBR scorecard</title>
<style>
  * { box-sizing: border-box; }
  body { margin: 0; padding: 14px; background: #f3f4f7; font-family: system-ui, "Segoe UI", sans-serif; color: #1d2330; }
  .card { max-width: 720px; margin: 0 auto; background: #fff; border: 1px solid #e1e4ea; border-radius: 12px; padding: 16px 18px; }
  h1 { margin: 0 0 4px; font-size: 18px; }
  .hint { margin: 0 0 12px; font-size: 13px; color: #5b6475; }
  .summary { margin: 0 0 12px; padding: 10px 12px; border-radius: 8px; background: #eef3fb; font-weight: 600; font-size: 15px; }
  .row { display: grid; grid-template-columns: 1.6fr 1fr 1fr 1.1fr; gap: 8px; align-items: center; padding: 8px 0; border-top: 1px solid #edf0f4; }
  .row.head { border-top: 0; font-size: 12px; text-transform: uppercase; letter-spacing: .04em; color: #5b6475; padding-bottom: 2px; }
  .name small { display: block; color: #5b6475; font-size: 12px; }
  input { width: 100%; font: inherit; padding: 6px 8px; border: 1px solid #c9cfd9; border-radius: 6px; }
  .out { font-size: 14px; }
  .chip { display: inline-block; padding: 1px 9px; border-radius: 999px; font-size: 12px; font-weight: 700; margin-left: 4px; }
  .hit { background: #d9f2e3; color: #11583a; }
  .near { background: #fff0c2; color: #6b4a00; }
  .miss { background: #fde3d3; color: #8f3306; }
  button { margin-top: 12px; font: inherit; padding: 7px 14px; border: 1px solid #c9cfd9; border-radius: 8px; background: #fff; cursor: pointer; }
  @media (max-width: 520px) {
    .row { grid-template-columns: 1fr 1fr; }
    .row.head { display: none; }
    .name { grid-column: 1 / -1; font-weight: 600; }
    .out { grid-column: 1 / -1; }
  }
</style>
</head>
<body>
<div class="card">
  <h1>Q3 scorecard</h1>
  <p class="hint">Change a target or a result. The percent, the status and the summary line update.</p>
  <p class="summary" id="summary"></p>

  <div class="row head"><div>Goal</div><div>Target</div><div>Result</div><div>Status</div></div>
  <div id="rows"></div>

  <button id="reset" type="button">Reset to sample numbers</button>
</div>

<script>
  // lower = true means a smaller result is better (churn, cost, days)
  const SAMPLE = [
    { name: 'Revenue ($k)',        unit: 'higher is better', target: 390, actual: 412, lower: false },
    { name: 'Monthly churn (%)',   unit: 'lower is better',  target: 2.5, actual: 1.9, lower: true },
    { name: 'New customers',       unit: 'higher is better', target: 45,  actual: 38,  lower: false },
    { name: 'Support in 1 day (%)', unit: 'higher is better', target: 90,  actual: 92,  lower: false }
  ];
  let goals = [];
  const rows = document.getElementById('rows');

  function status(g) {
    if (g.lower && g.actual === 0) return { ratio: 1, cls: 'hit', label: 'Hit' };
    const ratio = g.lower ? g.target / g.actual : g.actual / g.target;
    if (!isFinite(ratio)) return { ratio: 0, cls: 'miss', label: 'Missed' };
    if (ratio >= 1)   return { ratio, cls: 'hit',  label: 'Hit' };
    if (ratio >= 0.9) return { ratio, cls: 'near', label: 'Close' };
    return { ratio, cls: 'miss', label: 'Missed' };
  }

  function render() {
    let hit = 0, near = 0, miss = 0;
    goals.forEach((g, i) => {
      const s = status(g);
      if (s.cls === 'hit') hit++; else if (s.cls === 'near') near++; else miss++;
      const out = rows.children[i].querySelector('.out');
      out.innerHTML = Math.round(s.ratio * 100) + '% <span class="chip ' + s.cls + '">' + s.label + '</span>';
    });
    document.getElementById('summary').textContent =
      hit + ' of ' + goals.length + ' goals hit, ' + near + ' close, ' + miss + ' missed.';
  }

  function build() {
    goals = SAMPLE.map((g) => Object.assign({}, g));
    rows.innerHTML = '';
    goals.forEach((g, i) => {
      const row = document.createElement('div');
      row.className = 'row';
      row.innerHTML =
        '<div class="name">' + g.name + '<small>' + g.unit + '</small></div>' +
        '<div><input type="number" step="any" aria-label="Target for ' + g.name + '" value="' + g.target + '" data-i="' + i + '" data-f="target"></div>' +
        '<div><input type="number" step="any" aria-label="Result for ' + g.name + '" value="' + g.actual + '" data-i="' + i + '" data-f="actual"></div>' +
        '<div class="out"></div>';
      rows.appendChild(row);
    });
    render();
  }

  rows.addEventListener('input', (e) => {
    const el = e.target;
    if (!el.dataset.f) return;
    goals[el.dataset.i][el.dataset.f] = parseFloat(el.value) || 0;
    render();
  });
  document.getElementById('reset').addEventListener('click', build);
  build();
</script>
</body>
</html>
When a number changes after you send the page, ask the AI to change only that part: "Change only the Q4 plan, item 2. Keep everything else exactly as it is."
Then compare the rest of the page with the version you had. Or edit that one line yourself in the code.
Send it as a link
Paste the finished HTML into a NOS document and choose Create share link. The page renders as written, with its scripts running. HTML to link walks through it.
The person who gets the link opens it in a browser, on a computer or a phone. They need no account and cannot edit the page.
If you change the code later, the same link shows the new version, so there is no second email to send.
How you pass the link on depends on where your team talks:
- Email in Outlook. Select the text, choose Insert, then Link, and enter the address in the Address box. Typing a web address and pressing Space or Enter also turns it into a link. As of October 2026.
- Slack. Slack says that when you share a link, you see a preview of the content below your message, and that most links to websites expand into one. Whether a given page gets a preview is up to Slack. See sending a page in Slack.
- A meeting invite or a chat. A link is plain text, so you can paste it anywhere you can type.
If your review is a slide deck today, turning a deck into a link covers that case. A report that repeats every quarter fits the report to link guide.
Ways to send a QBR compared
The same review reaches readers differently depending on how you send it.
| Way to send | What the reader gets | After you fix a number |
|---|---|---|
| Slide deck as an attachment | A file to download and open in a presentation app | Send a new file |
| PDF export | A fixed copy in a PDF viewer | Export it again and resend |
| Pasted into the email body | Text and maybe a picture in the message | Send a correction |
| Link to a page | A page that opens in a browser, phone included | Edit the page, same link |
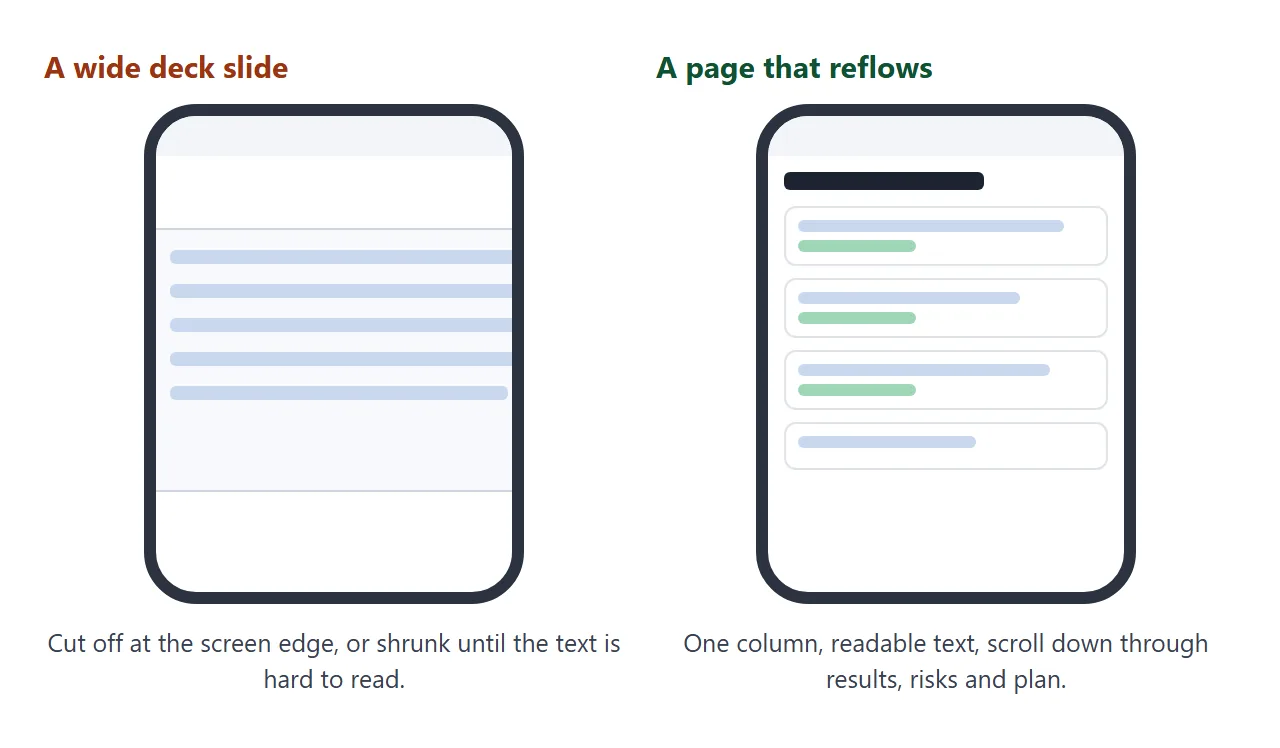
An attachment is fine when the review is final and nobody needs a phone. A link is better when the review gets fixed or read on the go. Opening an HTML file on a phone explains why a file struggles there.
When it does not work
| What you see | Cause | Fix |
|---|---|---|
| A number you never gave the AI | The prompt had no source figures | Paste your numbers and ask for TODO where data is missing |
| A chart or logo is missing | The page loads an image from another site, which is blocked | Ask for inline SVG or a CSS shape instead |
| The page runs off the side on a phone | A fixed-width table or slide layout | Ask for one column and a viewport meta tag |
| A Send button does nothing | Sending a form to a server is blocked | Keep a reply address on the page and ask readers to email you |
| A reader quotes old numbers | They kept an earlier attachment or PDF | Send the link and tell them to use it from now on |
| Slack shows no preview card | Slack decides which links get one | Paste the link with one line of context |