Recharts is a chart library built with React and D3 that draws its charts as SVG. It is normally installed with npm, but it also ships a script-tag build.
So one HTML file can load React and Recharts from a CDN and draw a chart with no build step. Hover the line below.
<!doctype html>
<html lang="en">
<head>
<meta charset="utf-8">
<meta name="viewport" content="width=device-width, initial-scale=1">
<title>Recharts in one HTML file</title>
<style>
  body { margin: 0; padding: 14px 16px; font-family: system-ui, sans-serif; background: #fff; color: #1d2330; }
  h1 { font-size: 16px; margin: 0 0 2px; }
  p { margin: 0 0 10px; font-size: 13px; color: #5b6472; }
  /* ResponsiveContainer fills its parent, so the parent needs a real height */
  #chart { height: 240px; }
</style>
</head>
<body>
<h1>Weekly sign-ups</h1>
<p>Hover or tap the line to read a value.</p>
<div id="chart"></div>

<!-- order matters: React, ReactDOM, ReactIs, then Recharts -->
<script src="https://cdn.jsdelivr.net/npm/react@18.3.1/umd/react.production.min.js"></script>
<script src="https://cdn.jsdelivr.net/npm/react-dom@18.3.1/umd/react-dom.production.min.js"></script>
<script src="https://cdn.jsdelivr.net/npm/react-is@18.3.1/umd/react-is.production.min.js"></script>
<script src="https://cdn.jsdelivr.net/npm/recharts@3.10.1/umd/Recharts.js"></script>
<script>
  const h = React.createElement;  // no JSX in a plain script
  const { ResponsiveContainer, LineChart, Line, XAxis, YAxis, CartesianGrid, Tooltip } = Recharts;

  const data = [
    { week: 'W1', signups: 12 }, { week: 'W2', signups: 19 },
    { week: 'W3', signups: 15 }, { week: 'W4', signups: 28 },
    { week: 'W5', signups: 34 }, { week: 'W6', signups: 31 },
  ];

  const chart = h(ResponsiveContainer, { width: '100%', height: '100%' },
    h(LineChart, { data, margin: { top: 8, right: 12, bottom: 0, left: -12 } },
      h(CartesianGrid, { strokeDasharray: '3 3', vertical: false }),
      h(XAxis, { dataKey: 'week' }),
      h(YAxis),
      h(Tooltip),
      h(Line, { dataKey: 'signups', stroke: '#2563eb', strokeWidth: 2.5 })
    )
  );

  ReactDOM.createRoot(document.getElementById('chart')).render(chart);
</script>
</body>
</html>
The rest of this page is what that file contains, and the few mistakes that leave you with a blank box.
The four script tags
Recharts is a React component library, so it needs React on the page first. The script-tag build looks for three globals when it loads, and it is the order of the tags that supplies them.
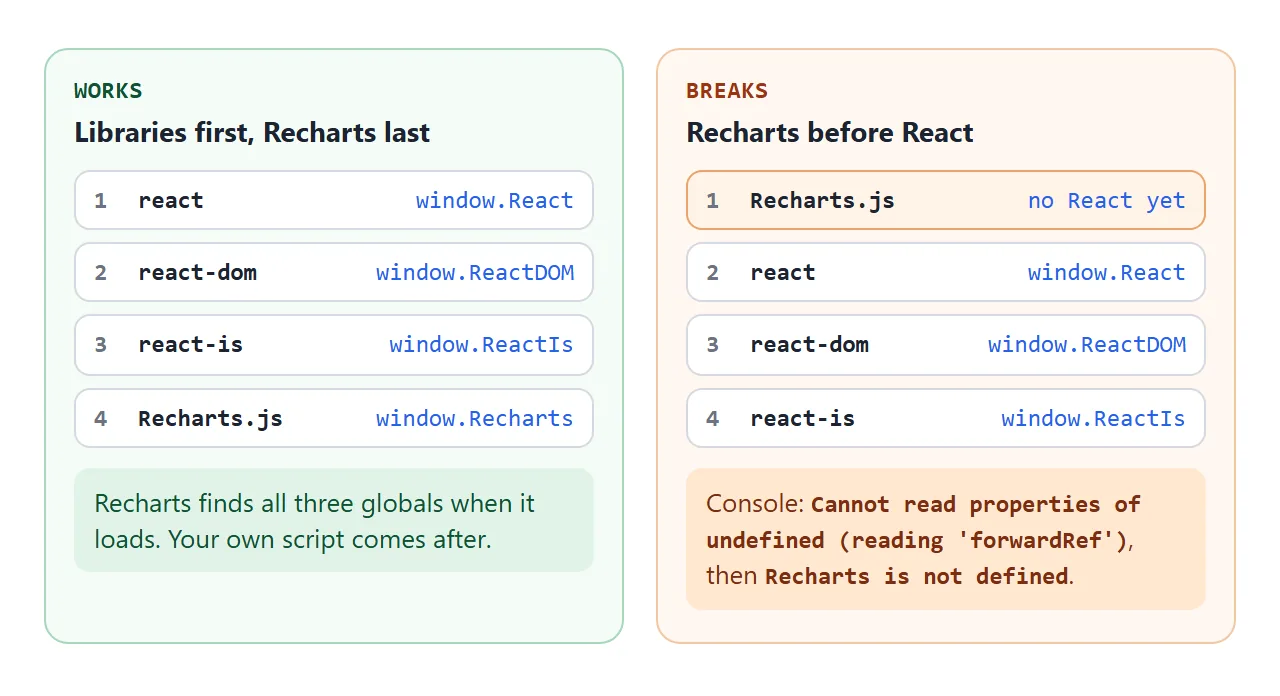
- React – the core library, which provides
window.React. - ReactDOM – draws React output into the page, as
window.ReactDOM. - react-is – a helper library that Recharts lists as a peer dependency, as
window.ReactIs. - Recharts – provides
window.Rechartswith every component.
A classic script tag runs as soon as it is fetched, and the browser reads the tags in page order. So the Recharts tag must come after the other three, and your own script must come after Recharts.
Pin a version in each address, as in recharts@3.10.1. An address without a version follows the newest release, and the jsDelivr documentation does not recommend that for production.
Draw the chart with createElement
Recharts charts are trees of components: a chart holds axes, a grid, a tooltip and one component per data series. In a plain script you build that tree with React.createElement. Giving it a short name keeps the code readable.
const h = React.createElement;
const { ResponsiveContainer, LineChart, Line, XAxis, YAxis, Tooltip } = Recharts;

const chart = h(ResponsiveContainer, { width: '100%', height: '100%' },
  h(LineChart, { data },
    h(XAxis, { dataKey: 'week' }),
    h(YAxis),
    h(Tooltip),
    h(Line, { dataKey: 'signups' })));

ReactDOM.createRoot(document.getElementById('chart')).render(chart);
The data is an array of objects, and each dataKey names a property. createRoot hands the div to React, and render draws the tree into it. For a bar or area chart, swap in BarChart with Bar, or AreaChart with Area.
Why the chart is blank: the parent needs a height
ResponsiveContainer takes a width and a height, either numbers or percentages such as '100%'. The documentation says it watches the parent's size with the ResizeObserver API, so the parent needs dimensions of its own.
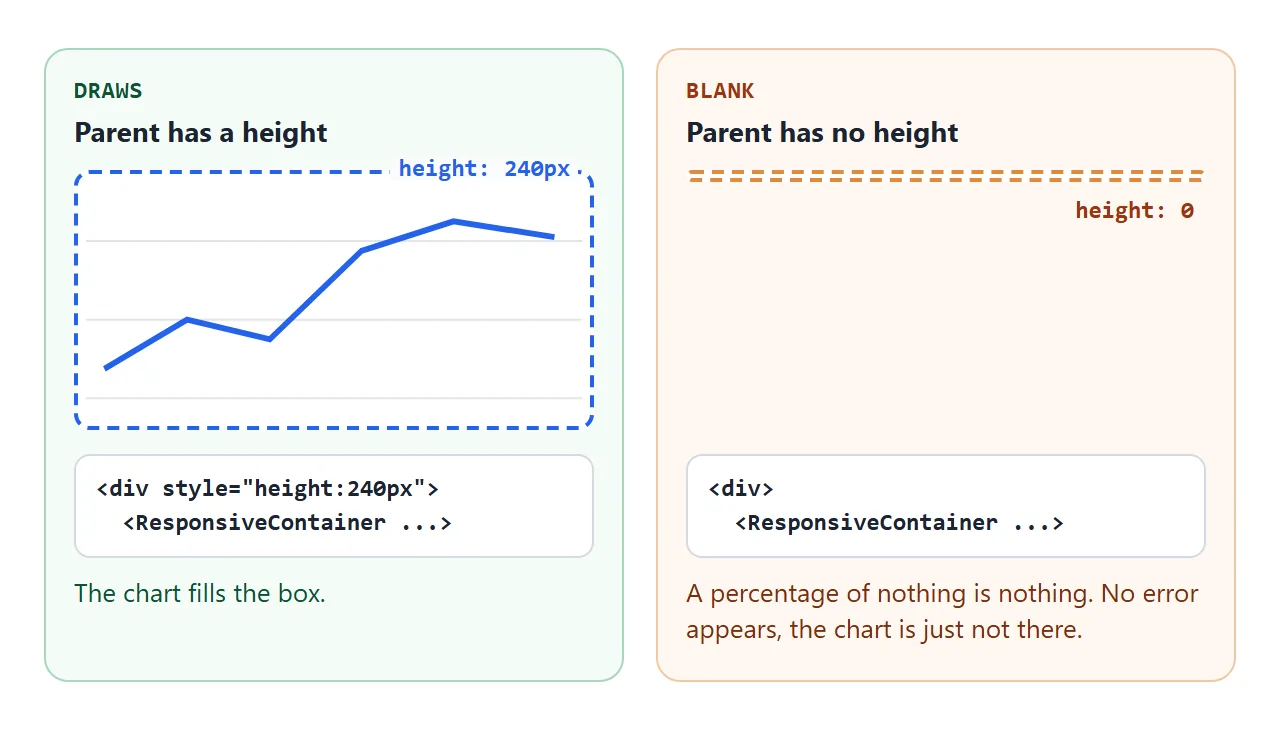
A div with no content and no height measures zero pixels tall. Then 100% of zero is zero, the chart has nowhere to draw, and the page shows nothing and reports no error.
Try it: untick the box, and drag the width slider to see the chart follow its parent.
<!doctype html>
<html lang="en">
<head>
<meta charset="utf-8">
<meta name="viewport" content="width=device-width, initial-scale=1">
<title>Recharts parent size</title>
<style>
  body { margin: 0; padding: 14px 16px; font-family: system-ui, sans-serif; background: #fff; color: #1d2330; }
  .ctl { display: grid; gap: 10px; margin-bottom: 12px; font-size: 14px; }
  .ctl label { display: flex; align-items: center; gap: 8px; flex-wrap: wrap; }
  input[type=range] { flex: 1; min-width: 120px; }
  #readout { font: 13px ui-monospace, Consolas, monospace; background: #f4f5f7; border-radius: 8px; padding: 8px 10px; margin-bottom: 10px; }
  #readout.bad { background: #fff1e6; color: #9a3412; }
  #readout.good { background: #e8f6ee; color: #0f5132; }
  #stage { border: 1px dashed #aab2bf; border-radius: 8px; padding: 6px; }
  #box { height: 220px; }  /* the parent: toggled by the checkbox */
  #box.nohigh { height: auto; }
</style>
</head>
<body>
<div class="ctl">
  <label><input type="checkbox" id="hasHeight" checked> Parent has a height (220px)</label>
  <label>Parent width <input type="range" id="w" min="30" max="100" value="100"> <b id="wv">100%</b></label>
</div>
<div id="readout"></div>
<div id="stage"><div id="box"><div id="chart" style="height:100%"></div></div></div>

<script src="https://cdn.jsdelivr.net/npm/react@18.3.1/umd/react.production.min.js"></script>
<script src="https://cdn.jsdelivr.net/npm/react-dom@18.3.1/umd/react-dom.production.min.js"></script>
<script src="https://cdn.jsdelivr.net/npm/react-is@18.3.1/umd/react-is.production.min.js"></script>
<script src="https://cdn.jsdelivr.net/npm/recharts@3.10.1/umd/Recharts.js"></script>
<script>
  const h = React.createElement;
  const { ResponsiveContainer, BarChart, Bar, XAxis, YAxis, Tooltip } = Recharts;
  const data = [{ m: 'Jan', v: 40 }, { m: 'Feb', v: 55 }, { m: 'Mar', v: 32 }, { m: 'Apr', v: 70 }, { m: 'May', v: 61 }];

  ReactDOM.createRoot(document.getElementById('chart')).render(
    h(ResponsiveContainer, { width: '100%', height: '100%' },
      h(BarChart, { data, margin: { left: -16, right: 8, top: 8 } },
        h(XAxis, { dataKey: 'm' }), h(YAxis), h(Tooltip),
        h(Bar, { dataKey: 'v', fill: '#2563eb', radius: [4, 4, 0, 0] })))
  );

  const box = document.getElementById('box');
  const readout = document.getElementById('readout');
  const hasHeight = document.getElementById('hasHeight');
  const w = document.getElementById('w');

  // report what the chart's parent measures right now
  function report() {
    const r = box.getBoundingClientRect();
    const wh = Math.round(r.width) + ' x ' + Math.round(r.height) + ' px';
    const zero = r.height < 10;
    readout.textContent = 'Parent size: ' + wh + (zero ? '  -> nothing to draw in' : '  -> chart fills it');
    readout.className = zero ? 'bad' : 'good';
  }
  new ResizeObserver(report).observe(box);

  hasHeight.addEventListener('change', () => box.classList.toggle('nohigh', !hasHeight.checked));
  w.addEventListener('input', () => {
    box.style.width = w.value + '%';
    document.getElementById('wv').textContent = w.value + '%';
  });
  report();
</script>
</body>
</html>
Two fixes work. Give the parent a height in CSS, or skip the container and put a fixed width and height on the chart. Recharts 3 also lets a chart take responsive with a CSS width and aspect ratio.
JSX does not run in a plain script
Most Recharts examples online are written in JSX, the HTML-like syntax inside JavaScript. A browser cannot read it, so pasting such an example into a script tag throws a syntax error.
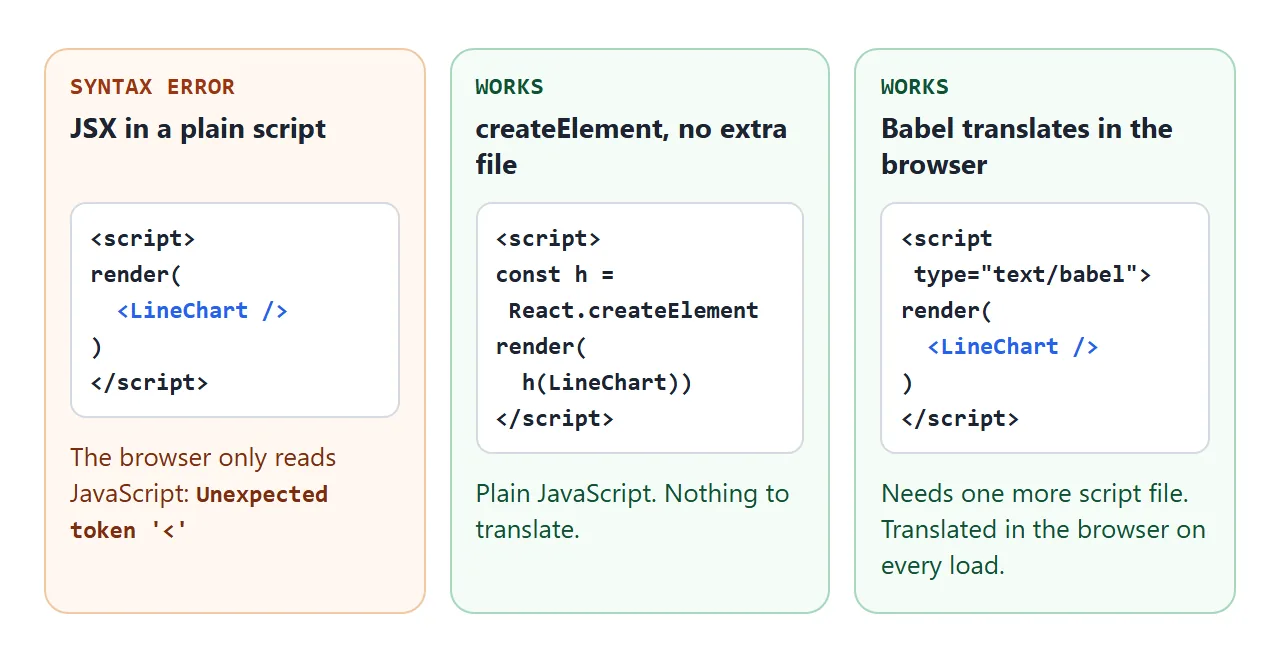
The examples here avoid the problem with createElement. If you prefer JSX, load @babel/standalone and mark your script type="text/babel". Babel's documentation says it compiles those scripts in the browser, and that production sites should compile ahead of time instead.
<script src="https://cdnjs.cloudflare.com/ajax/libs/babel-standalone/7.29.0/babel.min.js"></script>
<script type="text/babel">
  const { LineChart, Line } = Recharts;
  ReactDOM.createRoot(document.getElementById('chart')).render(
    <LineChart width={400} height={200} data={data}>
      <Line dataKey="signups" />
    </LineChart>
  );
</script>
Why the examples use React 18
React stopped publishing UMD builds with React 19, and its upgrade guide suggests an ES-module CDN instead. These examples use the script-tag route, so they pin React 18.3.1, a release that still ships a UMD file.
Recharts lists React 16.8 up to 19 as supported peers, so React 18.3.1 is within range. If you later move the project to npm and a bundler, you can use whichever React version Recharts supports.
A finished page: paste numbers, get a chart
Charts get useful when the data is easy to change. This page reads comma-separated rows from a textarea, skips any row that is not all numbers, and redraws as a line, bar or area chart.
The form is handled inside the page and sends nothing anywhere.
<!doctype html>
<html lang="en">
<head>
<meta charset="utf-8">
<meta name="viewport" content="width=device-width, initial-scale=1">
<title>Recharts data explorer</title>
<style>
  body { margin: 0; padding: 14px 16px; font-family: system-ui, sans-serif; background: #fff; color: #1d2330; }
  h1 { font-size: 16px; margin: 0 0 8px; }
  textarea { width: 100%; box-sizing: border-box; height: 96px; font: 13px ui-monospace, Consolas, monospace; padding: 8px; border: 1px solid #c9ced8; border-radius: 8px; resize: vertical; }
  .row { display: flex; flex-wrap: wrap; gap: 8px; align-items: center; margin: 8px 0; }
  button { font: inherit; font-size: 14px; padding: 6px 12px; border: 1px solid #c9ced8; background: #fff; border-radius: 8px; cursor: pointer; }
  button[aria-pressed=true] { background: #2563eb; border-color: #2563eb; color: #fff; }
  .spacer { flex: 1; }
  label { font-size: 14px; display: inline-flex; align-items: center; gap: 4px; }
  #msg { font-size: 13px; min-height: 18px; color: #9a3412; margin-bottom: 6px; }
  #chart { height: 260px; }
</style>
</head>
<body>
<h1>Paste numbers, get a chart</h1>
<form id="form">
  <textarea id="csv" aria-label="Data as CSV">month,2025,2026
Jan,40,52
Feb,55,61
Mar,32,58
Apr,70,66
May,61,79</textarea>
  <div class="row">
    <button type="submit">Draw</button>
    <span class="spacer"></span>
    <button type="button" data-kind="line" aria-pressed="true">Line</button>
    <button type="button" data-kind="bar" aria-pressed="false">Bar</button>
    <button type="button" data-kind="area" aria-pressed="false">Area</button>
  </div>
</form>
<div class="row" id="series"></div>
<div id="msg"></div>
<div id="chart"></div>

<script src="https://cdn.jsdelivr.net/npm/react@18.3.1/umd/react.production.min.js"></script>
<script src="https://cdn.jsdelivr.net/npm/react-dom@18.3.1/umd/react-dom.production.min.js"></script>
<script src="https://cdn.jsdelivr.net/npm/react-is@18.3.1/umd/react-is.production.min.js"></script>
<script src="https://cdn.jsdelivr.net/npm/recharts@3.10.1/umd/Recharts.js"></script>
<script>
  const h = React.createElement;
  const R = Recharts;
  const COLORS = ['#2563eb', '#d97706', '#0f766e', '#9333ea'];
  const root = ReactDOM.createRoot(document.getElementById('chart'));
  let kind = 'line';
  let state = { rows: [], keys: [], hidden: {} };

  // turn "label,a,b" lines into [{label, a, b}]; the first line names the series
  function parse(text) {
    const lines = text.trim().split('\n').map(l => l.split(',').map(s => s.trim()));
    const head = lines.shift();
    const keys = head.slice(1);
    const rows = [];
    let skipped = 0;
    for (const cells of lines) {
      const row = { label: cells[0] };
      let good = keys.length > 0;
      keys.forEach((k, i) => {
        const n = Number(cells[i + 1]);
        if (cells[i + 1] === '' || cells[i + 1] === undefined || Number.isNaN(n)) good = false;
        row[k] = n;
      });
      good ? rows.push(row) : skipped++;
    }
    return { rows, keys, skipped };
  }

  function draw() {
    const { rows, keys, hidden } = state;
    const Chart = { line: R.LineChart, bar: R.BarChart, area: R.AreaChart }[kind];
    const Mark = { line: R.Line, bar: R.Bar, area: R.Area }[kind];
    const marks = keys.filter(k => !hidden[k]).map(k => {
      const color = COLORS[keys.indexOf(k) % COLORS.length];
      const p = { key: k, dataKey: k, name: k };
      if (kind === 'line') Object.assign(p, { stroke: color, strokeWidth: 2.5 });
      if (kind === 'bar') Object.assign(p, { fill: color });
      if (kind === 'area') Object.assign(p, { stroke: color, fill: color, fillOpacity: 0.2 });
      return h(Mark, p);
    });
    root.render(
      h(R.ResponsiveContainer, { width: '100%', height: '100%' },
        h(Chart, { data: rows, margin: { top: 8, right: 8, left: -16, bottom: 0 } },
          h(R.CartesianGrid, { strokeDasharray: '3 3', vertical: false }),
          h(R.XAxis, { dataKey: 'label' }), h(R.YAxis), h(R.Tooltip), h(R.Legend),
          marks))
    );
  }

  function drawSeriesBoxes() {
    const box = document.getElementById('series');
    box.innerHTML = '';
    state.keys.forEach((k, i) => {
      const lab = document.createElement('label');
      const cb = document.createElement('input');
      cb.type = 'checkbox'; cb.checked = !state.hidden[k];
      cb.addEventListener('change', () => { state.hidden[k] = !cb.checked; draw(); });
      const sw = document.createElement('span');
      sw.style.cssText = 'width:10px;height:10px;border-radius:2px;background:' + COLORS[i % COLORS.length];
      lab.append(cb, sw, document.createTextNode(k));
      box.append(lab);
    });
  }

  function apply() {
    const out = parse(document.getElementById('csv').value);
    state = { rows: out.rows, keys: out.keys, hidden: {} };
    document.getElementById('msg').textContent = out.rows.length === 0
      ? 'No usable rows. Use: label,number,number per line.'
      : (out.skipped ? out.skipped + ' row(s) skipped: every value must be a number.' : '');
    drawSeriesBoxes();
    draw();
  }

  // the form is handled inside the page; nothing is sent anywhere
  document.getElementById('form').addEventListener('submit', (e) => { e.preventDefault(); apply(); });
  document.querySelectorAll('[data-kind]').forEach(btn => btn.addEventListener('click', () => {
    kind = btn.dataset.kind;
    document.querySelectorAll('[data-kind]').forEach(b => b.setAttribute('aria-pressed', String(b === btn)));
    draw();
  }));
  apply();
</script>
</body>
</html>
- Parse once: a
parsefunction turns each line into an object and converts the text to numbers withNumber(). - One root: the page creates the React root once and calls
renderagain with new data. - Series boxes: the page draws one
Line,BarorAreaper column that is ticked.
When it does not work
| What you see | Cause | Fix |
|---|---|---|
Recharts is not defined |
The Recharts file ran before React, or did not load | Put the four tags in order, Recharts last |
reading 'forwardRef' |
React was not on the page yet when Recharts ran | Move the React tag above Recharts |
reading 'ForwardRef' |
The react-is tag is missing | Add react-is before Recharts |
React is not defined |
A React 19 address returns 404, it has no UMD file | Use React 18.3.1 |
Unexpected token '<' |
JSX inside a plain script | Use createElement or type="text/babel" |
| Empty box, no error | The chart's parent has no height | Give the parent a height |
Share it as a link
A chart you can hover is more useful than a screenshot, and an .html attachment may open as plain code on a phone. Opening an HTML file on a phone covers why.
Send the working version instead. Paste the page into a NOS document and choose Create share link. HTML to link walks through it.
The scripts from jsDelivr load and run, so the people you send it to can hover the line and edit the numbers themselves. If you change the code later, the same link shows the new version.
For charts drawn without any library, see Line chart in HTML with plain SVG. If your whole app is built with a bundler, Host a built front end as static files covers that route.