A social media report template that holds up when you send it is one web page: a verdict, a few numbers, highlights and next steps. A page has no export step, so there is no PDF to reflow and no screenshot to stitch together.
The problem is familiar from exporting AI output. One public post on Threads sums it up: "save as pdf, layout shifts. always end up just screenshotting." A link skips that step.
Here is a finished report. The weekly chart is drawn from four numbers near the bottom of the code, so you can change them and watch the page update.
<!doctype html>
<html lang="en">
<head>
<meta charset="utf-8">
<meta name="viewport" content="width=device-width, initial-scale=1">
<title>Social media report - September 2026</title>
<style>
  * { box-sizing: border-box; }
  body { margin: 0; padding: 16px; background: #f1f3f6; font-family: system-ui, sans-serif; color: #1d2330; line-height: 1.5; }
  .page { max-width: 720px; margin: 0 auto; background: #fff; border-radius: 14px; padding: 22px 22px 26px; box-shadow: 0 2px 12px rgba(0,0,0,.08); }
  .eyebrow { font-size: 12px; letter-spacing: .06em; text-transform: uppercase; color: #6b7280; margin: 0; }
  h1 { font-size: 24px; line-height: 1.2; margin: 4px 0 6px; }
  .meta { font-size: 13px; color: #6b7280; margin: 0 0 16px; }
  .lead { background: #eef6ff; border-left: 4px solid #2563eb; border-radius: 6px; padding: 10px 14px; margin: 0 0 18px; font-size: 16px; }
  .stats { display: grid; grid-template-columns: repeat(4, 1fr); gap: 10px; margin-bottom: 20px; }
  .stat { border: 1px solid #e1e4ea; border-radius: 10px; padding: 10px 12px; break-inside: avoid; }
  .stat b { display: block; font-size: 22px; line-height: 1.2; }
  .stat span { font-size: 12px; color: #6b7280; }
  .up { color: #15803d; font-weight: 600; }
  .down { color: #b45309; font-weight: 600; }
  h2 { font-size: 16px; margin: 22px 0 8px; }
  .chart { border: 1px solid #e1e4ea; border-radius: 10px; padding: 10px 12px 6px; break-inside: avoid; }
  .chart svg { width: 100%; height: auto; display: block; }
  ul { margin: 0; padding-left: 20px; }
  li { margin: 0 0 6px; }
  table { width: 100%; border-collapse: collapse; font-size: 14px; }
  td:last-child, th:last-child { white-space: nowrap; }
  th, td { text-align: left; padding: 8px 8px; border-bottom: 1px solid #e1e4ea; vertical-align: top; }
  th { font-size: 12px; text-transform: uppercase; letter-spacing: .04em; color: #6b7280; }
  @media (max-width: 560px) { .stats { grid-template-columns: repeat(2, 1fr); } h1 { font-size: 21px; } }
</style>
</head>
<body>
<div class="page">
  <p class="eyebrow">Social media report</p>
  <h1>Juniper Coffee Roasters: September 2026</h1>
  <p class="meta">Instagram and TikTok. Prepared by Studio Nine. Compared with August.</p>

  <p class="lead"><b>Reach grew 18%</b>, helped by two Reels. Follower growth slowed slightly, so October focuses on conversion.</p>

  <div class="stats">
    <div class="stat"><b id="reach">48,200</b><span>Reach <span class="up">+18%</span></span></div>
    <div class="stat"><b>+312</b><span>New followers <span class="down">-9%</span></span></div>
    <div class="stat"><b>4.1%</b><span>Engagement <span class="up">+0.3 pt</span></span></div>
    <div class="stat"><b>640</b><span>Link clicks <span class="up">+12%</span></span></div>
  </div>

  <div class="chart">
    <b style="font-size:14px">Reach by week</b>
    <svg id="bars" viewBox="0 0 400 140" role="img" aria-label="Reach by week"></svg>
  </div>

  <h2>Highlights</h2>
  <ul>
    <li>The "roast day" Reel on 12 Sep had the most reach of the month.</li>
    <li>Stories with a poll got more replies than stories without one.</li>
    <li>Link clicks rose after the bio link was changed to the new menu page.</li>
  </ul>

  <h2>What did not work</h2>
  <ul>
    <li>Static product photos reached fewer people than video. Two of the four were cut from the plan.</li>
  </ul>

  <h2>Next steps</h2>
  <table>
    <tr><th>Action</th><th>Who</th><th>By</th></tr>
    <tr><td>Post two more behind-the-scenes Reels</td><td>Studio Nine</td><td>10 Oct</td></tr>
    <tr><td>Approve the October offer wording</td><td>Juniper</td><td>5 Oct</td></tr>
    <tr><td>Add a "shop now" sticker to Stories</td><td>Studio Nine</td><td>8 Oct</td></tr>
  </table>
</div>

<script>
  // Edit these four numbers: the chart and the total update.
  const weeks = [
    { label: 'Week 1', value: 9800 },
    { label: 'Week 2', value: 11400 },
    { label: 'Week 3', value: 14900 },
    { label: 'Week 4', value: 12100 }
  ];

  const svg = document.getElementById('bars');
  const max = Math.max(...weeks.map(w => w.value));
  const NS = 'http://www.w3.org/2000/svg';
  weeks.forEach((w, i) => {
    const h = Math.round((w.value / max) * 80);
    const x = 20 + i * 95;
    const bar = document.createElementNS(NS, 'rect');
    bar.setAttribute('x', x); bar.setAttribute('y', 100 - h);
    bar.setAttribute('width', 70); bar.setAttribute('height', h);
    bar.setAttribute('rx', 5); bar.setAttribute('fill', '#2563eb');
    const val = document.createElementNS(NS, 'text');
    val.setAttribute('x', x + 35); val.setAttribute('y', 94 - h);
    val.setAttribute('text-anchor', 'middle'); val.setAttribute('font-size', '12');
    val.setAttribute('fill', '#1d2330'); val.textContent = w.value.toLocaleString('en-US');
    const lab = document.createElementNS(NS, 'text');
    lab.setAttribute('x', x + 35); lab.setAttribute('y', 124);
    lab.setAttribute('text-anchor', 'middle'); lab.setAttribute('font-size', '12');
    lab.setAttribute('fill', '#6b7280'); lab.textContent = w.label;
    svg.append(bar, val, lab);
  });
  document.getElementById('reach').textContent =
    weeks.reduce((s, w) => s + w.value, 0).toLocaleString('en-US');
</script>
</body>
</html>
What goes on the page
The top carries the conclusion, so a quick look is enough. Everything under it supports it.
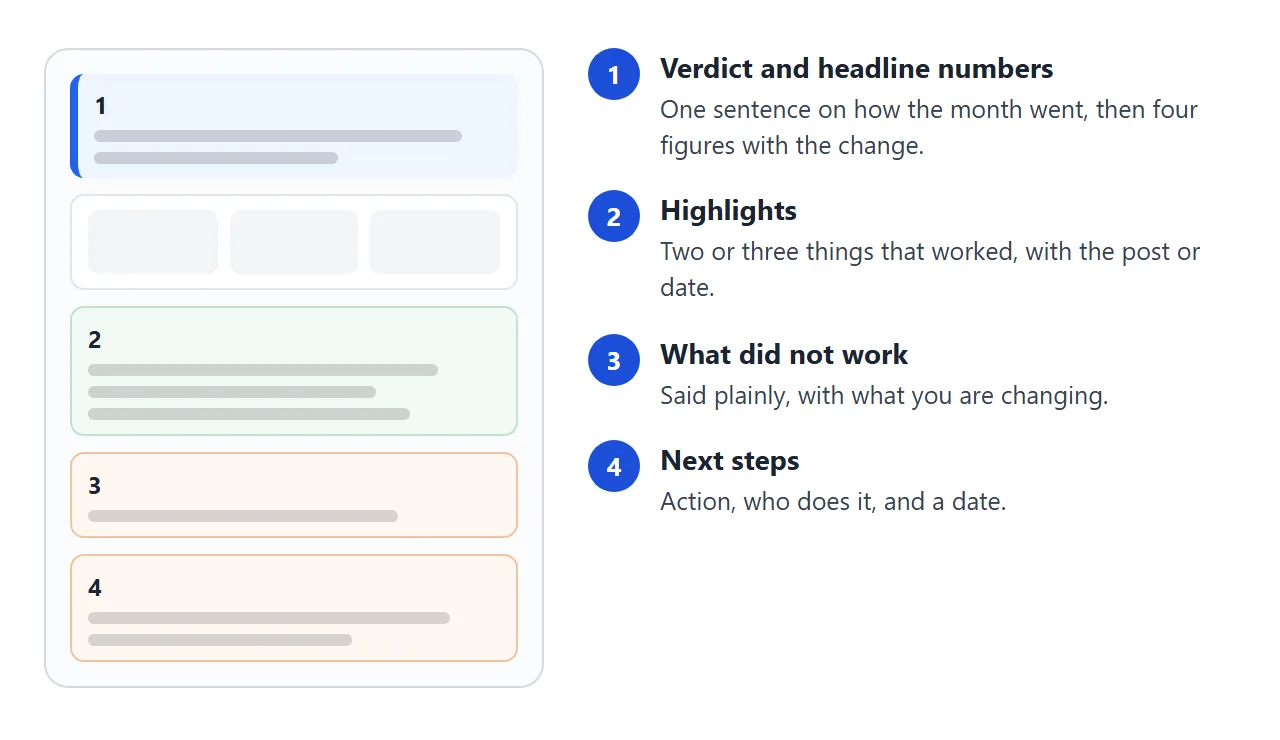
- Verdict and headline numbers. One sentence on how the month went, then four figures, each with its change from last month.
- Highlights. Two or three things that worked, with the date or post.
- What did not work. Say it plainly and say what changes.
- Next steps. An action, who does it, and a date.
For the thinking behind this order, see how to send a monthly report a client reads.
Make it with AI
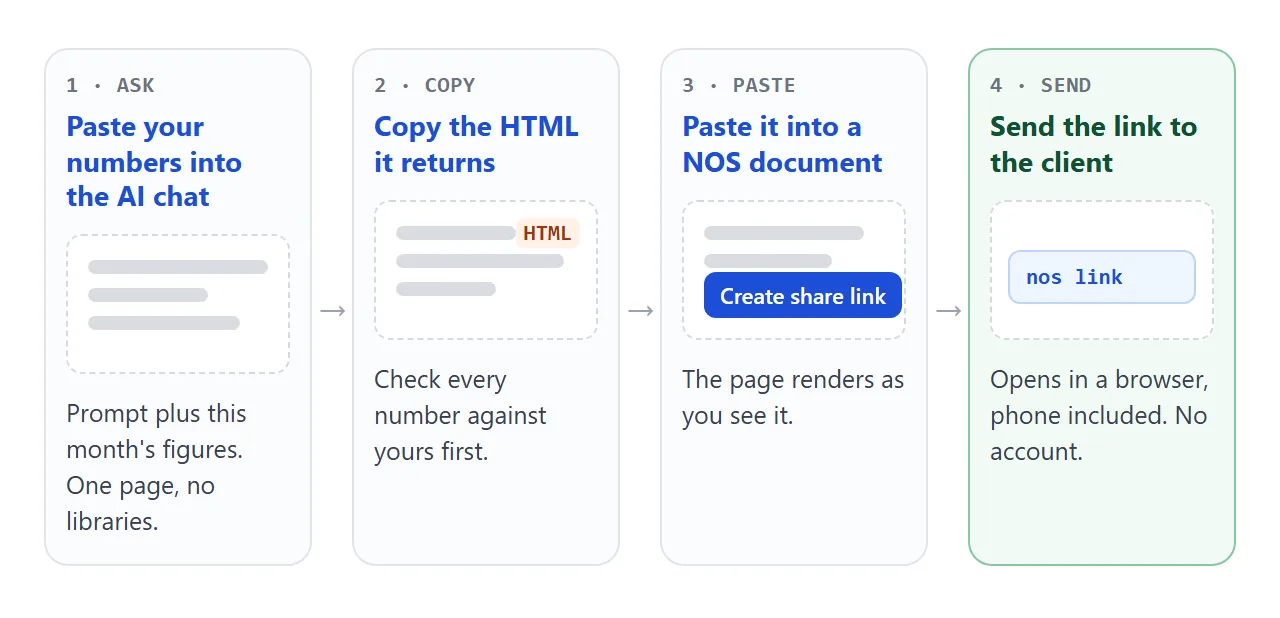
You do not need to write the HTML. Give an AI chat your figures and ask for the page. The AI does not know your numbers, so paste them in.
Make one self-contained HTML page: a social media report for
"Juniper Coffee Roasters", September 2026, prepared by Studio Nine.
Top: a one-sentence verdict, then four stat cards (reach, new followers,
engagement rate, link clicks), each with its change vs August.
Below: a bar chart of reach by week drawn as inline SVG,
a Highlights list, a "What did not work" list, and a Next steps table
with Action, Who and By columns.
Use only these numbers: [paste your figures here].
No external images, fonts or scripts. Add a viewport meta tag.
Make the cards stack two per row on a phone.
Before you use the result, check three things.
- Every number matches yours. AI can round or invent a figure. Compare each one, and recalculate any percentage.
- The verdict says what the numbers say. If followers fell, the first sentence should not call the month a success.
- It fits a phone. Open it at a narrow width. Cards should stack and nothing should run off the edge.
Send it as a link
Paste the HTML into a NOS document and choose Create share link. HTML to link walks through it. The page renders as written, so charts drawn with scripts or SVG show up as you saw them.
Anyone with the link can open it in a browser, phone included, without an account. They cannot edit it. Paste the address into an email, a message or the project chat like any other link.
If a figure was wrong, edit the code and the same link shows the new version. There is nothing to resend.
Link, PDF or screenshot
| Screenshot | Link to a page | ||
|---|---|---|---|
| What the client gets | A file | A picture | An address |
| Page breaks | Content is split into pages | None, but it is one fixed picture | None, it is one scrolling page |
| Fixing a figure after sending | Export and send again | Capture and send again | Edit the page, same link |
| Numbers can be copied as text | Depends on the export | No, it is a picture | Yes |
Screenshot vs live page goes deeper on why a picture ages badly.
Stack the months at one link
A report goes out every month. Rather than a new link each time, keep one page per client and put the newest month on top. The client keeps one address.
<!doctype html>
<html lang="en">
<head>
<meta charset="utf-8">
<meta name="viewport" content="width=device-width, initial-scale=1">
<title>Juniper Coffee Roasters: reports by month</title>
<style>
  * { box-sizing: border-box; }
  body { margin: 0; padding: 16px; background: #f1f3f6; font-family: system-ui, sans-serif; color: #1d2330; line-height: 1.5; }
  .page { max-width: 640px; margin: 0 auto; background: #fff; border-radius: 14px; padding: 20px 20px 24px; box-shadow: 0 2px 12px rgba(0,0,0,.08); }
  h1 { font-size: 20px; margin: 0 0 4px; }
  .sub { margin: 0 0 14px; font-size: 13px; color: #6b7280; }
  .tabs { display: flex; gap: 8px; margin-bottom: 16px; flex-wrap: wrap; }
  .tabs button { font: inherit; font-size: 14px; padding: 8px 14px; border-radius: 999px; border: 1px solid #cfd5df; background: #fff; cursor: pointer; }
  .tabs button[aria-pressed="true"] { background: #1d4ed8; border-color: #1d4ed8; color: #fff; }
  .big { font-size: 34px; font-weight: 700; line-height: 1.1; margin: 0; }
  .chg { font-size: 14px; font-weight: 600; }
  .up { color: #15803d; } .down { color: #b45309; } .flat { color: #6b7280; }
  .verdict { margin: 10px 0 16px; font-size: 16px; }
  h2 { font-size: 15px; margin: 0 0 8px; }
  .steps { list-style: none; margin: 0; padding: 0; }
  .steps li { display: flex; gap: 10px; align-items: flex-start; padding: 8px 0; border-bottom: 1px solid #e1e4ea; }
  .steps input { width: 20px; height: 20px; margin-top: 2px; flex: none; }
  .steps label { flex: 1; }
  .steps small { display: block; color: #6b7280; font-size: 12px; }
</style>
</head>
<body>
<div class="page">
  <h1>Juniper Coffee Roasters</h1>
  <p class="sub">Social media results. Newest month first, one link for all of them.</p>

  <div class="tabs" id="tabs"></div>

  <p class="big" id="reach"></p>
  <p class="chg" id="change"></p>
  <p class="verdict" id="verdict"></p>

  <h2>Next steps</h2>
  <ul class="steps" id="steps"></ul>
</div>

<script>
  // One entry per month. Add a new object at the top each month.
  const months = [
    { name: 'September', reach: 48200, prev: 40800,
      verdict: 'Reach is up. Two Reels did most of the work.',
      steps: [['Post two more behind-the-scenes Reels', 'Studio Nine, by 10 Oct'],
              ['Approve the October offer wording', 'Juniper, by 5 Oct']] },
    { name: 'August', reach: 40800, prev: 36000,
      verdict: 'Steady growth. Stories with polls got the most replies.',
      steps: [['Test one poll Story per week', 'Studio Nine, done'],
              ['Send new product photos', 'Juniper, done']] },
    { name: 'July', reach: 36000, prev: null,
      verdict: 'First month of tracking. This is the starting point.',
      steps: [['Set up weekly reach tracking', 'Studio Nine, done']] }
  ];

  const tabs = document.getElementById('tabs');
  const steps = document.getElementById('steps');

  function show(i) {
    const m = months[i];
    [...tabs.children].forEach((b, j) => b.setAttribute('aria-pressed', j === i));
    document.getElementById('reach').textContent = m.reach.toLocaleString('en-US') + ' reach';
    const c = document.getElementById('change');
    if (m.prev === null) {
      c.textContent = 'No earlier month to compare'; c.className = 'chg flat';
    } else {
      const pct = Math.round((m.reach - m.prev) / m.prev * 100);
      c.textContent = (pct >= 0 ? '+' : '') + pct + '% vs the month before';
      c.className = 'chg ' + (pct >= 0 ? 'up' : 'down');
    }
    document.getElementById('verdict').textContent = m.verdict;
    steps.innerHTML = '';
    m.steps.forEach(([text, who], k) => {
      const li = document.createElement('li');
      const id = 's' + i + '-' + k;
      li.innerHTML = '<input type="checkbox" id="' + id + '"><label for="' + id + '"></label>';
      li.querySelector('label').append(text);
      const small = document.createElement('small');
      small.textContent = who;
      li.querySelector('label').append(small);
      steps.append(li);
    });
  }

  months.forEach((m, i) => {
    const b = document.createElement('button');
    b.textContent = m.name;
    b.addEventListener('click', () => show(i));
    tabs.append(b);
  });
  show(0);
</script>
</body>
</html>
Next steps are a checklist here. When you open your own page in View mode and tick an item, that change is saved. A visitor's ticks are not saved, so use the list to show status, not to collect answers.
If a client still wants a PDF
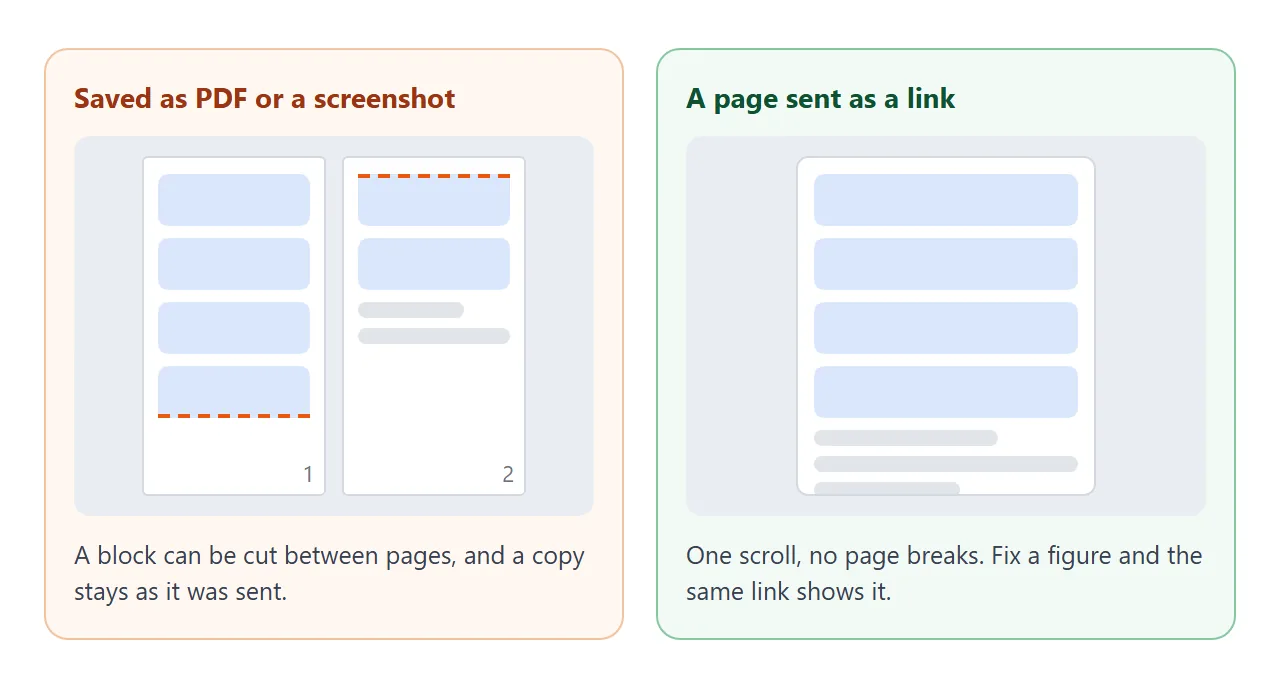
If a client wants a PDF, you can still send the link and offer a PDF as well. When you print the page, a page break can fall in the middle of a card.
MDN documents a line that asks the browser to keep a block in one piece when it breaks pages:
.stat, .chart { break-inside: avoid; }
The demo above already has it. For more on printing, see HTML to PDF without losing formatting.
When it does not work
| What you see | Cause | Fix |
|---|---|---|
| A logo or chart image is missing | It is an image loaded from another site, and those are blocked | Ask for an inline SVG, or use text instead of a logo |
| Numbers differ from yours | The AI rounded or made up a figure | Paste the figures again and say to use only those |
| The page is tiny or too wide on a phone | The viewport meta tag is missing | Ask for it; see the viewport meta tag |
| The client's ticks are gone on reload | A visitor's changes are not saved | Tick items yourself in View mode, or ask for a reply |
| A reply form on the page sends nothing | Sending a form to a server is blocked | Ask the client to reply by email or message instead |