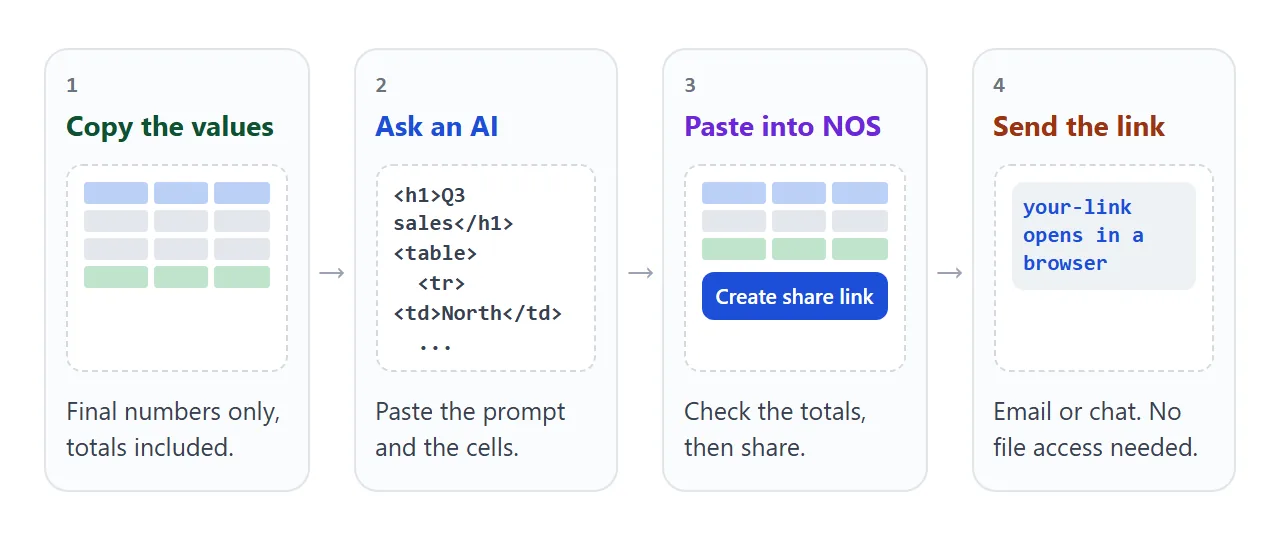
To turn a spreadsheet into a website, copy the final numbers out of it, have an AI write a page around them, and send the page as a link.
People without access to your file open it in a browser and read the numbers. They cannot change them.
One person on X put the snag like this: "A lot of my output from Claude is in HTML. But is surprisingly awkward to share HTML files." A link is one way around it, because the reader opens an address instead of a file.
Here is a finished quarter summary. Click a column heading to sort it, and make the window narrow to see it on a phone.
<!doctype html>
<html lang="en">
<head>
<meta charset="utf-8">
<meta name="viewport" content="width=device-width, initial-scale=1">
<title>Q3 sales summary</title>
<style>
  * { box-sizing: border-box; }
  body { margin: 0; padding: 22px 18px 28px; font-family: system-ui, "Segoe UI", sans-serif; color: #1d2330; background: #fff; line-height: 1.45; }
  .wrap { max-width: 760px; margin: 0 auto; }
  h1 { font-size: 22px; margin: 0 0 2px; }
  .sub { color: #5a626c; font-size: 14px; margin: 0 0 16px; }
  .tiles { display: grid; grid-template-columns: repeat(3, 1fr); gap: 10px; margin-bottom: 14px; }
  .tile { background: #f4f6f9; border-radius: 10px; padding: 12px 14px; }
  .tile b { display: block; font-size: 22px; font-variant-numeric: tabular-nums; }
  .tile span { font-size: 13px; color: #5a626c; }
  .check { font-size: 13.5px; border-radius: 8px; padding: 8px 12px; margin-bottom: 14px; }
  .check.ok { background: #e8f6ed; color: #0f5132; }
  .check.bad { background: #fff1e8; color: #9a3412; }
  table { width: 100%; border-collapse: collapse; font-size: 15px; }
  th, td { padding: 9px 8px; border-bottom: 1px solid #e3e7ec; text-align: left; }
  th.n, td.n { text-align: right; font-variant-numeric: tabular-nums; }
  th button { all: unset; cursor: pointer; font-weight: 700; color: #1d4ed8; }
  th button:focus-visible { outline: 2px solid #1d4ed8; outline-offset: 2px; }
  tfoot th { border-top: 2px solid #1d2330; border-bottom: 0; }
  .up { color: #0f5132; } .down { color: #9a3412; }
  .note { font-size: 13px; color: #5a626c; margin-top: 12px; }
  @media (max-width: 560px) {
    .tiles { grid-template-columns: 1fr 1fr; }
    .tile:last-child { grid-column: 1 / -1; }
    .wide-only { display: none; }
    thead { display: none; }
    tr { display: block; padding: 8px 0; border-bottom: 1px solid #e3e7ec; }
    td { display: flex; justify-content: space-between; border: 0; padding: 3px 4px; }
    td::before { content: attr(data-label); color: #5a626c; }
    td:first-child { display: block; font-weight: 700; }
    td:first-child::before { content: none; }
    tfoot tr { border-top: 2px solid #1d2330; }
    tfoot th { display: flex; justify-content: space-between; border: 0; padding: 3px 4px; }
    tfoot th::before { content: attr(data-label); font-weight: 400; color: #5a626c; }
    tfoot th:first-child { display: block; }
    tfoot th:first-child::before { content: none; }
  }
</style>
</head>
<body>
<div class="wrap">
  <h1 id="title"></h1>
  <p class="sub" id="sub"></p>
  <div class="tiles" id="tiles"></div>
  <div class="check" id="check"></div>
  <table>
    <thead>
      <tr>
        <th><button data-k="region">Region</button></th>
        <th class="n"><button data-k="units">Units</button></th>
        <th class="n"><button data-k="revenue">Revenue</button></th>
        <th class="n"><button data-k="change">vs last quarter</button></th>
      </tr>
    </thead>
    <tbody id="rows"></tbody>
    <tfoot id="foot"></tfoot>
  </table>
  <p class="note"><span id="note"></span> <span class="wide-only">Click a column heading to sort.</span></p>
</div>

<script>
  // ---- Change the numbers here. Paste the final values from your sheet. ----
  const TITLE = 'Q3 sales by region';
  const AS_OF = 'Figures as of 30 September';
  const ROWS = [
    // region, units, revenue, revenue last quarter
    ['North',    1204, 184200, 171500],
    ['Midlands',  960, 141700, 150300],
    ['South',    1432, 212900, 198400],
    ['West',      788, 119600, 101200],
    ['Online',   2105, 268300, 214800],
  ];
  // The totals shown in your sheet. The page compares its own sums with these.
  const SHEET_TOTALS = { units: 6489, revenue: 926700 };
  // ---------------------------------------------------------------------------

  const fmt = (n) => n.toLocaleString('en-US');
  const money = (n) => '$' + fmt(n);
  const data = ROWS.map(([region, units, revenue, prior]) => ({
    region, units, revenue, change: (revenue - prior) / prior * 100,
  }));
  const tot = {
    units: data.reduce((s, r) => s + r.units, 0),
    revenue: data.reduce((s, r) => s + r.revenue, 0),
    prior: ROWS.reduce((s, r) => s + r[3], 0),
  };
  const pct = (v) => (v >= 0 ? '+' : '−') + Math.abs(v).toFixed(1) + '%';
  const cls = (v) => (v >= 0 ? 'up' : 'down');

  document.getElementById('title').textContent = TITLE;
  document.getElementById('sub').textContent = 'Northfield Supply (fictional). ' + AS_OF;
  document.getElementById('note').textContent = 'Read-only page.';

  const best = data.reduce((a, b) => (b.revenue > a.revenue ? b : a));
  document.getElementById('tiles').innerHTML =
    '<div class="tile"><b>' + money(tot.revenue) + '</b><span>Total revenue</span></div>' +
    '<div class="tile"><b>' + fmt(tot.units) + '</b><span>Units sold</span></div>' +
    '<div class="tile"><b>' + best.region + '</b><span>Top region by revenue</span></div>';

  const match = tot.units === SHEET_TOTALS.units && tot.revenue === SHEET_TOTALS.revenue;
  const check = document.getElementById('check');
  check.className = 'check ' + (match ? 'ok' : 'bad');
  check.textContent = match
    ? 'Totals match the sheet: ' + fmt(tot.units) + ' units, ' + money(tot.revenue) + '.'
    : 'Check the numbers: these rows add up to ' + fmt(tot.units) + ' units and ' + money(tot.revenue) +
      ', but the sheet says ' + fmt(SHEET_TOTALS.units) + ' and ' + money(SHEET_TOTALS.revenue) + '.';

  let sortKey = null, dir = 1;
  function draw() {
    const list = data.slice();
    if (sortKey) {
      list.sort((a, b) => (typeof a[sortKey] === 'string'
        ? a[sortKey].localeCompare(b[sortKey])
        : a[sortKey] - b[sortKey]) * dir);
    }
    document.getElementById('rows').innerHTML = list.map((r) =>
      '<tr><td data-label="Region">' + r.region + '</td>' +
      '<td class="n" data-label="Units">' + fmt(r.units) + '</td>' +
      '<td class="n" data-label="Revenue">' + money(r.revenue) + '</td>' +
      '<td class="n ' + cls(r.change) + '" data-label="vs last quarter">' + pct(r.change) + '</td></tr>'
    ).join('');
  }
  const totalChange = (tot.revenue - tot.prior) / tot.prior * 100;
  document.getElementById('foot').innerHTML =
    '<tr><th data-label="Total">Total</th><th class="n" data-label="Units">' + fmt(tot.units) +
    '</th><th class="n" data-label="Revenue">' + money(tot.revenue) +
    '</th><th class="n ' + cls(totalChange) + '" data-label="vs last quarter">' + pct(totalChange) + '</th></tr>';

  document.querySelectorAll('th button').forEach((btn) => {
    btn.addEventListener('click', () => {
      const k = btn.dataset.k;
      dir = (sortKey === k) ? -dir : (k === 'region' ? 1 : -1);
      sortKey = k;
      draw();
    });
  });
  draw();
</script>
</body>
</html>
The green line at the top matters. The page adds up its own rows and compares them with the totals you copied from the sheet. If they differ, it turns orange and says so.
Copy the final numbers, not the workbook
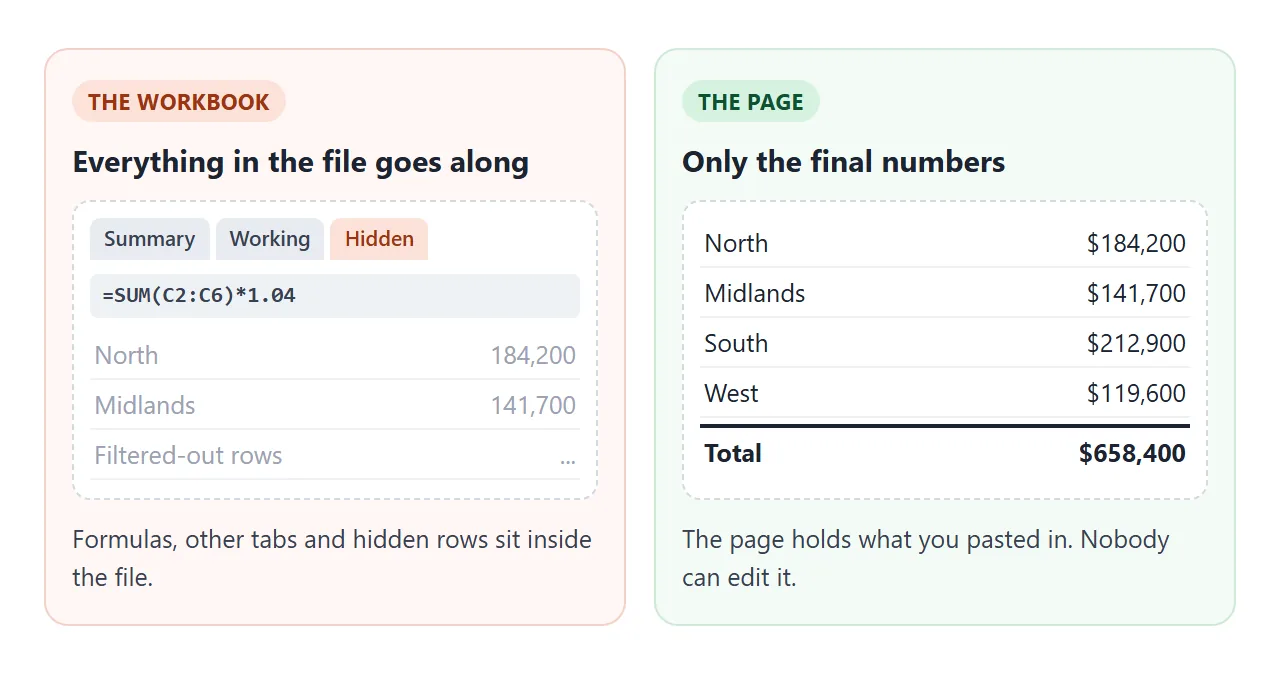
A page does not need your formulas. It needs what they produced. So the first step is getting values out of the sheet. The guide on sharing a spreadsheet as a link covers what a workbook carries along.
- Excel: copy the cells, then Home, Paste, Paste Special, Values. The shortcut is Ctrl+Alt+V. Microsoft describes Values as pasting "only the values of the copied data as displayed in the cells."
- Google Sheets: Edit, Paste special, Paste values only. Google notes that paste special works only within a single spreadsheet, so paste the values into a scratch tab of the same file and copy from there.
Keep the header row and the total row. Leave out helper columns and notes.
Hidden rows need care. In Excel, "By default, Excel copies hidden or filtered cells in addition to visible cells." Select the range, choose Home, Find and Select, Go To Special, Visible cells only, and then copy.
Make it with AI
Paste this prompt into ChatGPT, Claude or Gemini. Put your own table at the bottom.
Write ONE self-contained HTML file that shows the table below as a read-only summary page, to be read on a phone.
Rules:
- Plain HTML, CSS and JavaScript in one file. No images, no external files, no form that sends data.
- Add a viewport meta tag. Text at least 16px. One column on a narrow screen.
- Put every number in one array at the top of the script, with the comment "Change the numbers here".
- Show three summary tiles at the top: the grand total, a second total, and the top row.
- Let the reader sort by clicking a column heading.
- Add up the rows in the script. Compare with the totals from my sheet below. Show "Totals match the sheet" if they agree and an orange warning if not.
- Show the date I give you as "Figures as of".
- Do not round, rename or reorder anything. If a fact is missing, write TODO. Do not invent numbers.
Title: ...
Figures as of: ...
My table (copied cells): ...
Totals in my sheet: ...
The array line is what makes next quarter a one-minute edit. The totals line is what catches a typo.
What to check in the result
An AI writes layout well and copies numbers less reliably. Read the page like the person you are sending it to.
- Every row. Compare each number with the sheet, not just the totals. Two typos can cancel out.
- The check message. It should say the totals match. If it warns, find out why before you send.
- Signs and symbols. Minus signs, percent signs and currency symbols should match your sheet.
- The phone. Open the page on your own phone first.
If something looks off, fixing AI-generated HTML covers the usual causes.
Send it as a link
Paste the HTML into a NOS document and choose Create share link. HTML to link walks through it.
The result is a page anyone with the link can open in a browser, a phone too, with no account. They can read it but not edit it. Sorting still works, because the page renders as written and its scripts run.
Send the address in the body of an email or a chat message, with one line saying which figures it covers.
Next quarter: open the page in NOS and replace the block of numbers at the top of the script. Save, and the same link shows the new version. Change the "Figures as of" date at the same time.
One limit to say out loud: the page is a snapshot. It cannot reach your sheet to refresh itself, because a page on a share link cannot fetch from other sites.
A second shape: budget against actual
Sales figures are one shape. This one compares a plan with what happened, which is common in office reporting. It shows the gap per department and has a button to show only the rows that are over budget.
<!doctype html>
<html lang="en">
<head>
<meta charset="utf-8">
<meta name="viewport" content="width=device-width, initial-scale=1">
<title>Budget vs actual</title>
<style>
  * { box-sizing: border-box; }
  body { margin: 0; padding: 22px 18px 28px; font-family: system-ui, "Segoe UI", sans-serif; color: #1d2330; background: #fff; line-height: 1.45; }
  .wrap { max-width: 760px; margin: 0 auto; }
  h1 { font-size: 22px; margin: 0 0 2px; }
  .sub { color: #5a626c; font-size: 14px; margin: 0 0 14px; }
  .sum { display: flex; flex-wrap: wrap; gap: 8px 22px; background: #f4f6f9; border-radius: 10px; padding: 12px 14px; margin-bottom: 14px; font-size: 14px; }
  .sum b { font-size: 18px; font-variant-numeric: tabular-nums; }
  .bar-tools { display: flex; align-items: center; gap: 10px; margin-bottom: 8px; flex-wrap: wrap; }
  .toggle { font: inherit; font-size: 14px; padding: 8px 12px; min-height: 40px; border-radius: 8px; border: 1px solid #c6ccd6; background: #fff; cursor: pointer; }
  .toggle[aria-pressed="true"] { background: #1d4ed8; border-color: #1d4ed8; color: #fff; }
  .item { padding: 10px 0; border-bottom: 1px solid #e3e7ec; }
  .line { display: flex; justify-content: space-between; gap: 10px; flex-wrap: wrap; font-size: 15px; }
  .line .name { font-weight: 700; }
  .line .fig { font-variant-numeric: tabular-nums; color: #374151; }
  .var.over { color: #9a3412; font-weight: 700; }
  .var.under { color: #0f5132; font-weight: 700; }
  .track { position: relative; height: 10px; border-radius: 5px; background: #e8ebf0; margin-top: 8px; }
  .fill { position: absolute; left: 0; top: 0; bottom: 0; border-radius: 5px; }
  .fill.over { background: #ea7a3d; } .fill.under { background: #3b9b63; }
  .mark { position: absolute; top: -3px; bottom: -3px; width: 2px; background: #1d2330; }
  .key { font-size: 13px; color: #5a626c; margin-top: 12px; }
  .empty { padding: 14px 0; color: #5a626c; }
</style>
</head>
<body>
<div class="wrap">
  <h1 id="title"></h1>
  <p class="sub" id="sub"></p>
  <div class="sum" id="sum"></div>
  <div class="bar-tools">
    <button class="toggle" id="only" aria-pressed="false">Show only over budget</button>
    <span id="count" aria-live="polite"></span>
  </div>
  <div id="list"></div>
  <p class="key">The black mark is the budget. A bar past it is over budget.</p>
</div>

<script>
  // ---- Change the numbers here. Paste the final values from your sheet. ----
  const TITLE = 'Budget vs actual, year to date';
  const AS_OF = 'Figures as of 30 September';
  const ROWS = [
    // department, budget, actual
    ['Marketing',   48000,  51200],
    ['Operations', 120000, 114800],
    ['IT',          65000,  66900],
    ['HR',          30000,  27300],
    ['Facilities',  40000,  38500],
    ['Training',    18000,  21400],
  ];
  // ---------------------------------------------------------------------------

  const fmt = (n) => '$' + Math.abs(n).toLocaleString('en-US');
  const signed = (n) => (n > 0 ? '+' : n < 0 ? '−' : '') + fmt(n);
  const budget = ROWS.reduce((s, r) => s + r[1], 0);
  const actual = ROWS.reduce((s, r) => s + r[2], 0);
  const overCount = ROWS.filter((r) => r[2] > r[1]).length;

  document.getElementById('title').textContent = TITLE;
  document.getElementById('sub').textContent = 'Northfield Supply (fictional). ' + AS_OF;
  document.getElementById('sum').innerHTML =
    '<div>Budget<br><b>' + fmt(budget) + '</b></div>' +
    '<div>Actual<br><b>' + fmt(actual) + '</b></div>' +
    '<div>Difference<br><b>' + signed(actual - budget) + '</b></div>' +
    '<div>Over budget<br><b>' + overCount + ' of ' + ROWS.length + '</b></div>';

  const SCALE = 1.3; // the bar track shows up to 130% of budget
  let onlyOver = false;
  function draw() {
    const rows = ROWS.filter((r) => !onlyOver || r[2] > r[1]);
    document.getElementById('count').textContent = rows.length + ' of ' + ROWS.length + ' shown';
    document.getElementById('list').innerHTML = rows.length ? rows.map(([name, b, a]) => {
      const diff = a - b, over = diff > 0;
      const w = Math.min(a / b / SCALE, 1) * 100;
      return '<div class="item"><div class="line"><span class="name">' + name + '</span>' +
        '<span class="fig">' + fmt(a) + ' of ' + fmt(b) + '</span>' +
        '<span class="var ' + (over ? 'over' : 'under') + '">' + signed(diff) + '</span></div>' +
        '<div class="track"><div class="fill ' + (over ? 'over' : 'under') + '" style="width:' + w.toFixed(1) + '%"></div>' +
        '<div class="mark" style="left:' + (100 / SCALE).toFixed(1) + '%"></div></div></div>';
    }).join('') : '<p class="empty">Nothing is over budget.</p>';
  }
  const btn = document.getElementById('only');
  btn.addEventListener('click', () => {
    onlyOver = !onlyOver;
    btn.setAttribute('aria-pressed', onlyOver);
    draw();
  });
  draw();
</script>
</body>
</html>
The same method applies. Paste values, give the AI the table, and check the totals: here the three over-budget lines add up to 8,500 over, the three under-budget lines to 9,400 under, and the difference is 900 under.
For a page with charts and several tables, see dashboard to link.
Link, attachment or published sheet
You have three ways to get numbers to someone who does not have your file. They suit different jobs.
| Workbook attached | Google Sheets, Publish to the web | Page as a NOS link | |
|---|---|---|---|
| What they receive | A copy of the whole file | A published version they cannot edit | A page with only what you pasted in |
| Needs access to your file | No, they hold a copy | No, when published to everyone with the URL | No |
| When numbers change | Send a new file | Updates automatically unless you turn it off | Edit the page, same link |
| Limits to know | Personal Gmail: 25 MB, larger files become a Drive link | A work or school admin may have turned publishing off | Numbers are pasted in, not read live |
These are as of October 2026 and can change.
Publish to the web is the better fit when you want live numbers and your account allows it.
A page is the better fit when you want to choose the layout and show only final numbers. For the wider comparison, see email vs link for documents.
What the reader sees on a phone
A wide grid does not fit a narrow screen, so a spreadsheet opened on a phone usually means pinching and sideways scrolling. A page can lay the same rows out as labelled blocks, one per row, with the totals first.
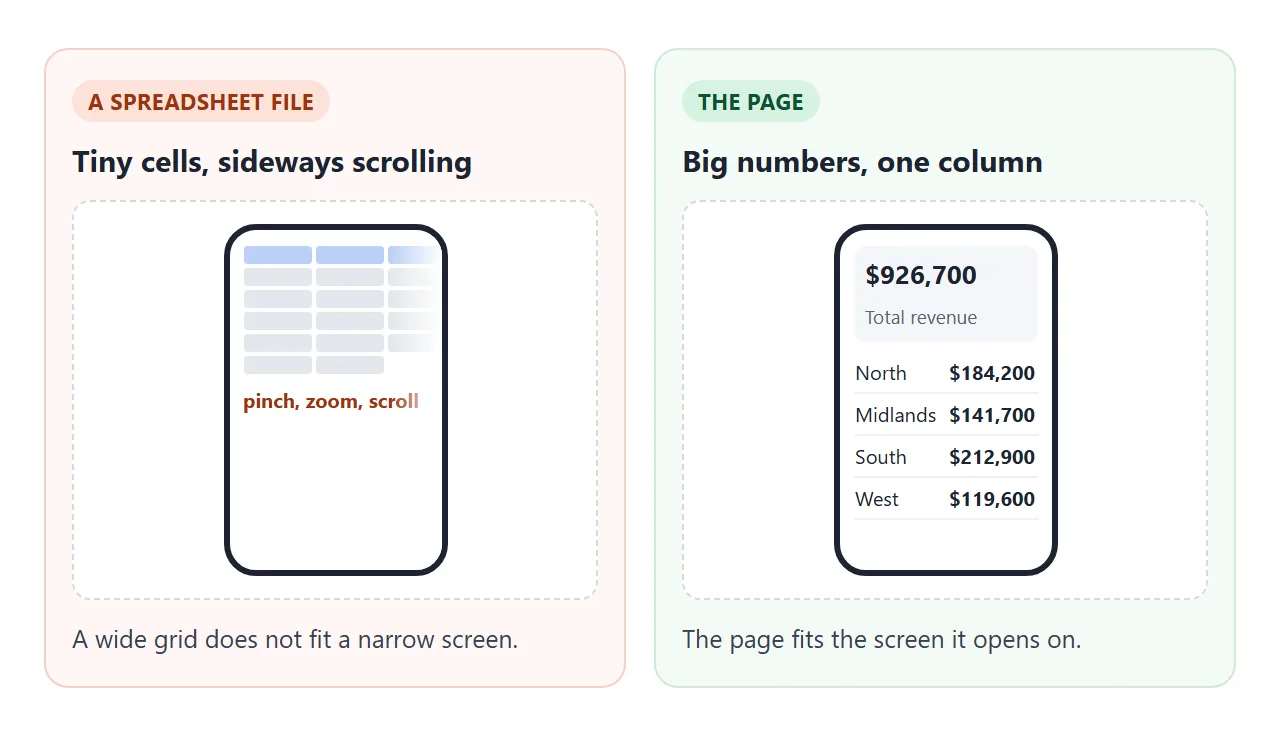
If your table has more than five or six columns, pick the ones the reader needs and ask the AI to fold each row into a block on narrow screens. The first example does this at phone width.
A table that starts as a CSV file is covered in HTML table from CSV.
When it does not work
| What you see | Cause | Fix |
|---|---|---|
| The page shows text like SUM(C2:C6) | You copied formulas, not values | Paste values only, then copy again |
| Rows you hid are on the page | Excel copies hidden and filtered cells by default | Use Visible cells only, then copy |
| The totals check turns orange | A number was mistyped, or the sheet changed after you copied | Compare row by row, then copy again |
| Columns are shifted | The pasted cells lost their column breaks | Include the header row and say which columns there are |
| The table is squeezed on a phone | Too many columns | Choose four or five, or ask for a block per row |
| A chart image is missing | Images from other sites are blocked | Ask for bars drawn with CSS or inline SVG |
| The reader sees old numbers | They opened an old file or an old copy | Send only the link, and show the date on the page |
| No Publish to the web option | A work or school admin may have turned it off | Use a page link, or ask your admin |